• 미리보기
  • 리뷰
  • 코멘트

CCi MA Trend

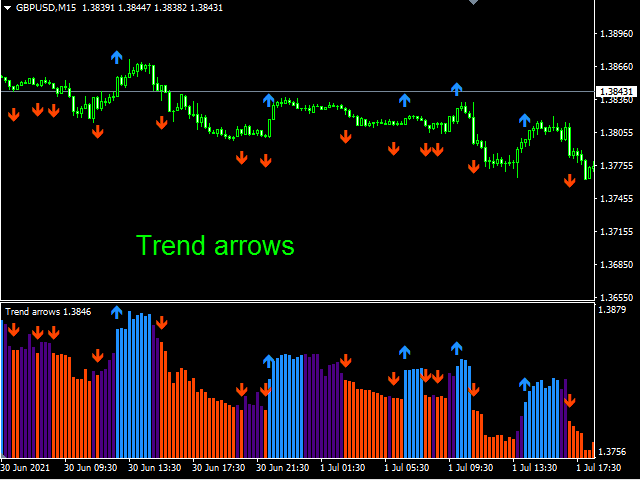
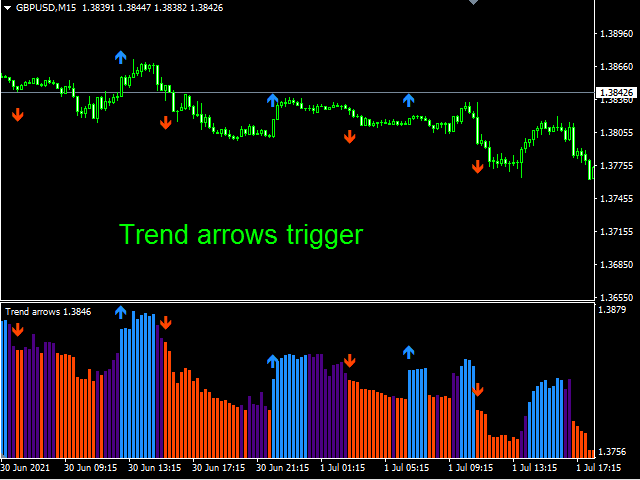
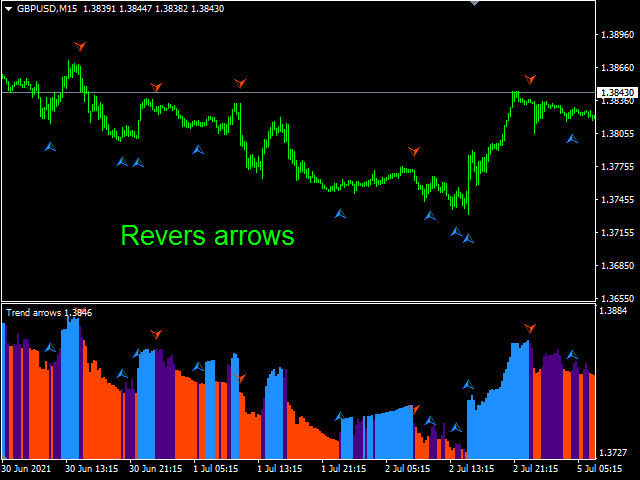
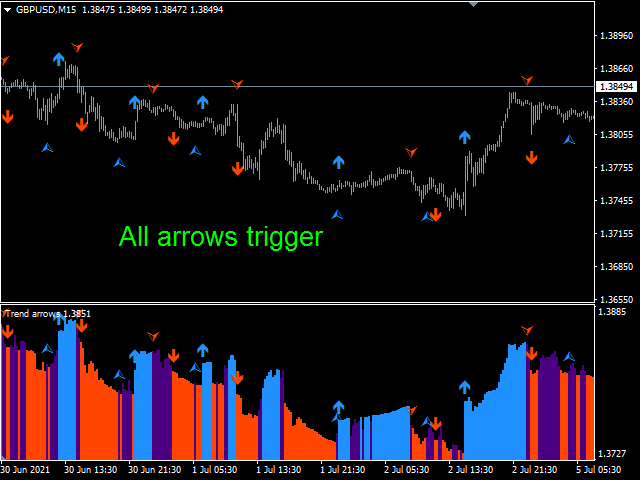
The indicator consists of a base of the standard CCI and levels calculated on the basis of MAs, which move following the price. To strengthen the trend movement, the deviation coefficient is used. To exclude triggering in a flat, the minimum trend limiter is used. Signal arrows are displayed on the indicator chart and the price chart - everything is turned off. There is an arrow trigger function - the arrows alternate when it is turned on. You can display signals on a chart, on e-mail and on a mobile terminal.
추천 제품
Owl smart levels
Sergey Ermolov
4.34 (35)
MT5 버전  |   FAQ Owl Smart Levels Indicator 는   Bill Williams 의 고급 프랙탈, 시장의 올바른 파동 구조를 구축하는 Valable ZigZag, 정확한 진입 수준을 표시하는 피보나치 수준과 같은 인기 있는 시장 분석 도구를 포함하는 하나의 지표 내에서 완전한 거래 시스템입니다. 시장과 이익을 취하는 장소로. 전략에 대한 자세한 설명 표시기 작업에 대한 지침 고문-거래 올빼미 도우미의 조수 개인 사용자 채팅 ->구입 후 나에게 쓰기,나는 개인 채팅에 당신을 추가하고 거기에 모든 보너스를 다운로드 할 수 있습니다 힘은 단순함에 있습니다! Owl Smart Levels   거래 시스템은 사용하기 매우 쉽기 때문에 전문가와 이제 막 시장을 연구하고 스스로 거래 전략을 선택하기 시작한 사람들 모두에게 적합합니다. 전략 및 지표에는 눈에 보이지 않는 비밀 공식 및 계산 방법이 없으며 모든 전략 지표는 공개되어 있습니다. Owl Smart Lev
Super Reversal Pattern
Parfait Mujinga Ndalika
Super Reversal Pattern Indicator Unlock the power of advanced pattern recognition with our Super Reversal Pattern Indicator. Designed for traders seeking precision and reliability, this indicator identifies one of the most effective reversal patterns in technical analysis, offering a significant edge in your trading strategy. Key Features: Non-Repainting Accuracy: Enjoy the confidence of non-repainting technology. Once a Super Reversal Pattern is detected, it remains static, providing consis
VR Cub
Vladimir Pastushak
VR Cub 은 고품질 진입점을 얻는 지표입니다. 이 지표는 수학적 계산을 용이하게 하고 포지션 진입점 검색을 단순화하기 위해 개발되었습니다. 지표가 작성된 거래 전략은 수년 동안 그 효율성을 입증해 왔습니다. 거래 전략의 단순성은 초보 거래자라도 성공적으로 거래할 수 있다는 큰 장점입니다. VR Cub은 포지션 개시 지점과 이익 실현 및 손절매 목표 수준을 계산하여 효율성과 사용 편의성을 크게 높입니다. 간단한 거래 규칙을 이해하려면 아래 전략을 사용한 거래 스크린샷을 살펴보세요. 설정, 세트 파일, 데모 버전, 지침, 문제 해결 등은 다음에서 얻을 수 있습니다. [블로그] 다음에서 리뷰를 읽거나 작성할 수 있습니다. [링크] 버전 [MetaTrader 5] 진입점 계산 규칙 포지션 개설 진입점을 계산하려면 VR Cub 도구를 마지막 최고점에서 마지막 최저점까지 늘려야 합니다. 첫 번째 지점이 두 번째 지점보다 빠른 경우, 거래자는 막대가 중간선 위에서 마감될 때까지 기다립
Chart Patterns Detect 15 patterns (Ascending Triangle, Descending Triangle, Rising Wedge, Falling Wedge, Bullish Flag, Bearish Flag, Bullish Rectangle, Bearish Rectangle Symmetrical triangle, Head and Shoulders, Inverted Head and Shoulders, Triple top, Triple Bottom, Double Top, Double Bottom) Use historical data to calculate the probability of each pattern to succeed (possibility to filter notification according to the chance of success) gives graphic indication about the invalidation level and
KT Horizontal Lines MT4
KEENBASE SOFTWARE SOLUTIONS
In MetaTrader, plotting multiple   horizontal lines   and then tracking their respective price levels can be a hassle. This indicator automatically plots multiple horizontal lines at equal intervals for setting price alerts, plotting support and resistance levels, and other manual purposes. This indicator is suitable for Forex traders who are new and looking for chances to make quick profits from buying and selling. Horizontal lines can help traders find possible areas to start trading when the
Trend Ray
Andriy Sydoruk
The indicator shows the potential trend direction by cyclical-wave dependence. Thus, all the rays of the intersection will be optimal rays, in the direction of which the price is expected to move, taking into account the indicator period. Rays can be used as a direction for potential market movement. But we must not forget that the approach must be comprehensive, the indicator signals require additional information to enter the market.
The Th3Eng PipFinite indicator is based on a very excellent analysis of the right trend direction with perfect custom algorithms. It show the true direction and the best point to start trading. With StopLoss point and Three Take Profit points. Also it show the right pivot of the price and small points to order to replace the dynamic support and resistance channel, Which surrounds the price. And Finally it draws a very helpful Box on the left side on the chart includes (take profits and Stop loss
ZhiBiCCI MT4
Qiuyang Zheng
[ZhiBiCCI] indicators are suitable for all cycle use, and are also suitable for all market varieties. [ZhiBiCCI] Green solid line is a reversal of bullish divergence. The green dotted line is a classic bullish divergence. [ZhiBiCCI] The solid line to the red is a reverse bearish divergence. The red dotted line is a classical bearish divergence. [ZhiBiCCI] can be set in the parameters (Alert, Send mail, Send notification), set to (true) to send instant signals to the alarm window, email, in
Gvs Undefeated Trend   indicator is designed for trend and signal trading. This indicator generates trend signals.  It uses many algorithms and indicators to generate this signal. It tries to generate a signal from the points with the highest trend potential. This indicator is a complete trading product. This indicator does not need any additional indicators.  You can only trade with this indicator. The generated signals are displayed on the graphical screen.  Thanks to the alert features you ca
Noize Absorption Index MT4
Ekaterina Saltykova
5 (1)
Noize Absorption Index - is the manual trading system that measures the difference of pressure between bears forces and bulls forces. Green line - is a noize free index that showing curent situation. Zero value of index shows totally choppy/flat market.Values above zero level shows how powerfull bullish wave is and values below zero measures bearish forces.Up arrow appears on bearish market when it's ready to reverse, dn arrow appears on weak bullish market, as a result of reverse expectation. S
Signal From Level
Yaroslav Varankin
Binary Options Support Resistance Indicator This indicator is designed for binary options trading and effectively shows retracements from support and resistance levels. Signals appear on the current candle. A red arrow pointing downwards indicates a potential selling opportunity, while a blue arrow pointing upwards suggests buying opportunities. All that needs adjustment is the color of the signal arrows. It is recommended to use it on the M1-M5 timeframes as signals are frequent on these timef
PZ Penta O MT4
PZ TRADING SLU
The Penta-O is a 6-point retracement harmonacci pattern which usually precedes big market movements. Penta-O patterns can expand and repaint quite a bit. To make things easier this indicator implements a twist: it waits for a donchian breakout in the right direction before signaling the trade. The end result is an otherwise repainting indicator with a very reliable trading signal. The donchian breakout period is entered as an input. [ Installation Guide | Update Guide | Troubleshooting | FAQ | A
Indicator. "Indicator wave or Indicator Ma". Using 23 standard indicators and the author's algorithm, the levels of purchases (from 0 to +100) and sales (from 0 to -100) are calculated. Then, using the calculated levels, the "Wave Indicator" draws a wave with 21 moving averages. The wave number is equal to the averaging period of the calculated levels. Waves # 1 - 7 Fast Moving Averages Waves from No. 8 -14 moving averages Waves from No. 15-21 slow moving averages Looking at the figu
This is a new strategy for SUPPLY DEMAND areas It is based on a calculation using the tick volume to detect the big price action in market for both bear /bull actions this smart volume action candles are used to determine the supply and demand areas prices in between main supply and demand lines indicate sideway market  up arrows will be shown when prices moves above the main supply and the secondary supply lines Down arrows will be shown when prices moves below the main demand and the secondary
Binary Option Signal
Yaroslav Varankin
Indicator for binary options arrow is easy to use and does not require configuration works on all currency pairs, cryptocurrencies buy signal blue up arrow sell signal red down arrow tips do not trade during news and 15-30 minutes before their release, as the market is too volatile and there is a lot of noise it is worth entering trades one or two candles from the current period (recommended for 1 candle) timeframe up to m 15 recommended money management fixed lot or fixed percentage of the depo
Real Magic Trend
Muhammed Emin Ugur
This   Real Magic Trend   indicator is designed for signal trading. This indicator generates trend signals. It uses many algorithms and indicators to generate this signal. It tries to generate signals from the points with the highest trend potential. This indicator is a complete trading product. This indicator does not need any additional indicators. The indicator is never repainted. The point at which the signal is given does not change.      Features and Recommendations Time Frame
Trend Master Chart MT4
Frederic Jacques Collomb
Trend Master Chart는 귀하에게 필요한 추세 지표입니다. 차트를 오버레이하고 색상 코딩을 사용하여 다양한 시장 동향/움직임을 정의합니다. 두 개의 이동 평균과 서로 다른 오실레이터를 결합하는 알고리즘을 사용합니다. 이 세 가지 요소의 기간은 수정 가능합니다. 모든 시간대와 모든 쌍에서 작동합니다. 한 눈에 상승 또는 하락 추세와 이 추세의 다양한 진입점을 식별할 수 있습니다. 예를 들어 뚜렷한 상승 추세(밝은 녹색) 동안 이 추세 내의 다양한 시장 충동은 짙은 녹색 양초로 표시됩니다. 구성 가능한 경고를 사용하면 이러한 충동 중 하나를 놓치지 않을 수 있습니다. MT5 버전. 입력 매개변수: Period 1: 빠른 기간 이동 평균. Period 2: 느린 기간 이동 평균. Oscillator period: 오실레이터 기간. Sell/Buy alert: 시장 충동 경고, 추세 진입점. Bullish/Bearish a
Trend PRO Expert Advisor
Nguyen Tran Ha
1 (1)
Trend PRO Expert Advisor  is developed base on the PipFinite Trend PRO Indicator, the best indicators on the market so far. PipFinite  Trend Pro's smart algorithm detects the trend, filters out market noise and gives entry signals with exit levels.  This EA open order when the indicator has buy/sell signals and set SL/TP follow the indicator rules. You can read more information about PipFinite Trend PRO indicator  here . Important Information   This EA will only work if you purchased  PipFin
Wolfe Wave Scanner
Jalitha K Johny
5 (1)
Wolfe Waves scanner - It scans all the Symbols and identify the movement of price and it gives confidence in trade. It automatically plots  fifth wave breaks out of the channel. According to the theory behind the pattern, a line drawn from the point at the beginning of the first wave and passing through the beginning of the fourth wave predicts a target price for the end of the fifth wave. If a trader properly identifies a Wolfe Wave as it forms, the beginning of the fifth wave represents an op
"Adjustable Fractals" - 프랙탈 표시기의 고급 버전으로 매우 유용한 거래 도구입니다! 우리가 알고 있듯이 표준 프랙탈 mt4 표시기에는 설정이 전혀 없습니다. 이는 거래자에게 매우 불편합니다. 조정 가능한 프랙탈(Adjustable Fractals)이 해당 문제를 해결했습니다. 필요한 모든 설정이 포함되어 있습니다. 조정 가능한 표시 기간(권장 값 - 7 이상) 고점/저점과의 거리 조절 가능 프랙탈 화살표에 따라 조정 가능한 디자인 ............................................................................................................................................. // 더 훌륭한 전문가 자문 및 지표는 여기에서 확인할 수 있습니다: https://www.mql5.com/en/users/def1380/seller 본 MQL5 홈페이지에서만 제공
Best indicator for trend reversals Can be optimized for crypto trading or all currency pairs How to use:When the arrow appears, wait for the candle to close and open the order Level lines appear when candle closes,  The system shows you the best entry levels It is simple and easy to use, no additional settings are required. Best indicator for beginners and professionals You can set the displayed stop loss and desired profit levels. You can use it alone or in addition to your strategy. Recommend
Trend Line Chart Pattern Signals  Is a traders Tool for Signals based on Strong  Patterns Formed By a pair of robust trend lines. They FOR WITH DIFFERENT POPULAR PATTERNS ON CHARTS LIKE – TRIANGLES, FLAGS,RANGE , ASCENDING TRIANGLES, DESCENDING PATTERNS, PENNANTS ETC. The TREND LINES  form  dynamically  on running bars. The  sensitivity  of the trend lines can be changed by custom settings. The  Buy and Sell Signals Generate upon Break Of the Trend Line + "Close" of the same bar above the previo
Support and Resistance is a very important reference for trading.  This indicator provides customized support and resistance levels, automatic draw line and play music functions.  In addition to the custom RS, the default RS includes Pivot Point, Fibonacci, integer Price, MA, Bollinger Bands. Pivot Point is a resistance and support system. It has been widely used at froex,stocks, futures, treasury bonds and indexes. It is an effective support resistance analysis system. Fibonacci also known as t
Trend PA
Mikhail Nazarenko
5 (3)
The Trend PA indicator uses   Price Action   and its own filtering algorithm to determine the trend. This approach helps to accurately determine entry points and the current trend on any timeframe. The indicator uses its own algorithm for analyzing price changes and Price Action. Which gives you the advantage of recognizing, without delay, a new nascent trend with fewer false positives. Trend filtering conditions can be selected in the settings individually for your trading style. The indicator
HMA Trend Professional MT4
Pavel Zamoshnikov
4.57 (7)
Improved version of the free HMA Trend indicator (for MetaTrader 4) with statistical analysis. HMA Trend is a trend indicator based on the Hull Moving Average (HMA) with two periods. HMA with a slow period identifies the trend, while HMA with a fast period determines the short-term movements and signals in the trend direction. The main differences from the free version: Ability to predict the probability of a trend reversal using analysis of history data. Plotting statistical charts for analyz
이것은 가격 레이블이 있는 Advanced ZigZag Dynamic   및/또는   Extended Fractals   표시기 극값을 기반으로 하는 지원 및 저항 수준의 MTF 표시기입니다(비활성화 가능). MTF 모드에 대해 더 높은 TF를 선택할 수 있습니다. 기본적으로 레벨은 지그재그 표시 점을 기반으로 생성됩니다. 프랙탈 표시 점은 지그재그와 함께 또는 대신 사용할 수도 있습니다. 사용을 단순화하고 CPU 시간을 절약하기 위해 열릴 때 각 막대당 한 번씩 계산이 수행됩니다. 매개변수: ForcedTF - 레벨 계산을 위한 차트 타임프레임(현재와 같거나 초과할 수 있음) MinPipsLevelWidth - 포인트 단위의 최소 레벨 너비(매우 좁은 레벨에 사용) Use ZigZag Extremums points - 지그재그 피크를 사용하여 지원/저항 수준 계산을 활성화/비활성화합니다. Fixed pips range - 지그재그 표시기를 계산하기 위한 최소값과 최대값 사이의 거리
We present you the indicator "Candle closing counter", which will become your indispensable assistant in the world of trading. That’s why knowing when the candle will close can help: If you like to trade using candle patterns, you will know when the candle will be closed. This indicator will allow you to check if a known pattern has formed and if there is a possibility of trading. The indicator will help you to prepare for market opening and market closure. You can set a timer to create a p
Title : Market Bias Indicator - Oscillator-Based Trading Tool Introduction : Discover the potential of the "Market Bias Indicator," a revolutionary oscillator-based trading tool designed for precise market analysis. If you're in search of a robust alternative to traditional bias indicators, your quest ends here. Market Bias Indicator offers unparalleled accuracy in identifying market sentiment and is your gateway to confident trading decisions. Recommended Trading Pairs : Market Bias Indicator i
LordAutoFibonnaci
Igor Pereira Calil
5 (1)
Lord Auto Fibonnaci is a free indicator for Meta Trader, in order to show the most famous chart in the financial market known as "Fibonnaci". As we can see in the images below, the fibonnaci table will automatically analyze the graph for you, with trend factors through percentage, almost infallible use, you can always work when the percentage is low or high, start shopping and sales on time, great for analyzing entries! In the images below we can see an example in gold in H4, where we are a
FREE
GTAS FibTdi
Riviera Systems
GTAS FidTdi is a trend indicator using combination of volatility and potential retracement levels. This indicator was created by Bernard Prats Desclaux, proprietary trader and ex-hedge fund manager, founder of E-Winvest. Description The indicator is represented as a red or green envelope above or under prices. How to use Trend detecting When the envelope is green, the trend is bullish. When it is red, the trend is bearish. Trading Once a trade is opened, GTAS FibTdi shows retracement zones
FREE
이 제품의 구매자들이 또한 구매함
Gann Made Easy
Oleg Rodin
4.85 (82)
Gann Made Easy 는 mr.의 이론을 사용하여 최고의 거래 원칙을 기반으로 하는 전문적이고 사용하기 쉬운 Forex 거래 시스템입니다. W.D. 간. 이 표시기는 Stop Loss 및 Take Profit Levels를 포함하여 정확한 BUY 및 SELL 신호를 제공합니다. PUSH 알림을 사용하여 이동 중에도 거래할 수 있습니다. 구매 후 연락주세요! 내 거래 팁과 훌륭한 보너스 지표를 무료로 공유하겠습니다! 아마도 Gann 거래 방법에 대해 이미 여러 번 들었을 것입니다. 일반적으로 Gann의 이론은 초보자 거래자뿐만 아니라 이미 거래 경험이 있는 사람들에게도 매우 복잡한 것입니다. Gann의 거래 방식은 이론적으로 적용하기 쉽지 않기 때문입니다. 나는 그 지식을 연마하고 Forex 지표에 최고의 원칙을 적용하기 위해 몇 년을 보냈습니다. 표시기는 적용하기가 매우 쉽습니다. 차트에 첨부하고 간단한 거래 권장 사항을 따르기만 하면 됩니다. 지표는 지속적으로 시장 분석 작업
Atomic Analyst
Issam Kassas
5 (2)
우선적으로 언급할 점은이 거래 지표가 다시 그리지 않고 지연되지 않으며 이를 통해 수동 및 로봇 거래 모두에 이상적이라는 점입니다. 사용자 매뉴얼: 설정, 입력 및 전략. Atomic Analyst는 가격의 강도와 모멘텀을 활용하여 시장에서 더 나은 이점을 찾는 PA Price Action Indicator입니다. 고급 필터를 장착하여 잡음과 거짓 신호를 제거하고 거래 잠재력을 높이는 데 도움이 됩니다. 복잡한 지표의 다중 레이어를 사용하여 Atomic Analyst는 차트를 스캔하고 복잡한 수학적 계산을 간단한 신호와 색상으로 변환하여 초보 트레이더가 이해하고 일관된 거래 결정을 내릴 수 있도록합니다. "Atomic Analyst"는 새로운 및 경험이 풍부한 트레이더를위한 종합적인 거래 솔루션입니다. 프리미엄 지표와 최고 수준의 기능을 하나의 거래 전략에 결합하여 모든 종류의 트레이더에 대한 다재다능한 선택지가되었습니다. 인트라데이 거래 및 스캘핑 전략 : 빠르고 정확한
Scalper Inside PRO
Alexey Minkov
4.73 (56)
An exclusive indicator that utilizes an innovative algorithm to swiftly and accurately determine the market trend. The indicator automatically calculates opening, closing, and profit levels, providing detailed trading statistics. With these features, you can choose the most appropriate trading instrument for the current market conditions. Additionally, you can easily integrate your own arrow indicators into Scalper Inside Pro to quickly evaluate their statistics and profitability. Scalper Inside
현재 20% 할인 ! 초보자 또는 전문가 트레이더를 위한 최고의 솔루션! 이 대시보드 소프트웨어는 28개의 통화 쌍에서 작동합니다. 2가지 주요 지표(Advanced Currency Strength 28 및 Advanced Currency Impulse)를 기반으로 합니다. 전체 Forex 시장에 대한 훌륭한 개요를 제공합니다. 고급 통화 강도 값, 통화 이동 속도 및 모든(9) 시간대의 28 Forex 쌍에 대한 신호를 보여줍니다. 추세 및/또는 스캘핑 기회를 정확히 파악하기 위해 차트의 단일 지표를 사용하여 전체 시장을 볼 수 있을 때 거래가 어떻게 개선될지 상상해 보십시오! 잠재적인 거래를 식별하고 확인하면서 강력한 통화와 약한 통화를 더욱 쉽게 식별할 수 있도록 이 지표에 기능을 내장했습니다. 이 표시기는 통화의 강세 또는 약세가 증가 또는 감소하는지 여부와 모든 시간대에서 수행되는 방식을 그래픽으로 보여줍니다. 추가된 새로운 기능은 현재 시장 조건 변화에 적
Enigmera
Ivan Stefanov
5 (3)
에니메라: 시장의 핵심 https://www.enigmera.com 소개 이 지표 및 트레이딩 시스템은 금융 시장에 대한 놀라운 접근 방식입니다. 에니메라는 프랙탈 주기를 사용하여 지지선과 저항선을 정확하게 계산합니다. 진정한 축적 단계를 보여주고 방향과 목표를 제시합니다.  추세에 있든 조정에 있든 작동하는 시스템입니다.  어떻게 작동하나요? 에니메라는 지지선/저항선, 목표선, 편차선의 세 가지 라인으로 구성됩니다. 이 시스템은 과거 데이터를 현재와 미래로 추정하는 일반적인 시장 지표와 달리 현재에 대한 완전한 그림을 제공합니다. 지지선 위에 있으면 실제 지지를 의미하고 저항선 위에 있으면 실제 저항을 의미합니다. 레벨이 깨지면 추세의 변화를 나타냅니다. 다시 그리지 않습니다. 시장이 지속적으로 진화함에 따라 에니메라는 평가 도구를 조정하여 전략을 정기적으로 수정합니다.   이를 통해 모든 시나리오를 철저히 평가할 수 있습니다. 이 시장 지표의 고유성은 분명하며 그 기
TPSproTREND PrO
Roman Podpora
4.79 (19)
TPSpro TREND PRO는   시장을 자동으로 분석하여 추세와 각 변화에 대한 정보를 제공할 뿐만 아니라 다시 그리지 않고도 거래에 진입할 수 있는 신호를 제공하는 추세 지표입니다! 지표는 각 양초를 사용하여 개별적으로 분석합니다. 다른 임펄스를 언급합니다 - 업 또는 다운 임펄스. 통화, 암호화폐, 금속, 주식, 지수 거래의 정확한 진입점! 버전 MT5                   표시기에 대한 전체 설명       표시기   와 함께 사용하는 것이 좋습니다   -   RFI LEVELS 주요 기능: 렌더링 없이 정확한 입력 신호! 신호가 나타나면 관련성은 유지됩니다! 이는 신호를 제공한 후 변경하여 예금 자금 손실을 초래할 수 있는 다시 그리기 지표와의 중요한 차이점입니다. 이제 더 큰 확률과 정확도로 시장에 진입할 수 있습니다. 화살표가 나타난 후 목표에 도달(이익실현)하거나 반전 신호가 나타날 때까지 캔들을 색칠하는 기능도 있습니다. STOP LOSS / TAK
Dynamic Forex28 Navigator - 차세대 외환 거래 도구. 현재 49% 할인. Dynamic Forex28 Navigator는 오랫동안 인기 있는 지표의 진화형으로, 세 가지의 힘을 하나로 결합했습니다. 고급 통화 Strength28 지표(695개 리뷰) + 고급 통화 IMPULSE with ALERT(520개 리뷰) + CS28 콤보 신호(보너스). 지표에 대한 자세한 정보 https://www.mql5.com/en/blogs/post/758844 차세대 Strength 지표는 무엇을 제공합니까?  원래 지표에서 좋아했던 모든 것이 새로운 기능과 더 높은 정확도로 강화되었습니다. 주요 기능: 독점적인 통화 Strength 공식.  모든 시간대에 걸쳐 부드럽고 정확한 강도선. 추세와 정확한 진입을 식별하는 데 이상적입니다. 역동적인 시장 피보나치 수준(시장 피보나치).  이 지표에만 있는 고유한 기능. 가격 차트가 아닌 통화 강도에 피보나치가 적용
Trend Punch
Mohamed Hassan
4.95 (19)
This indicator is unstoppable when combined with our other indicator called  Support & Resistance . After purchase, send us a message and you will get it   for  FREE as a BONUS! Introducing Trend Punch , the revolutionary forex trend indicator that will transform the way you trade! Trend Punch is uniquely designed to provide precise buy and sell arrows during strong market trends, making your trading decisions clearer and more confident. Whether you're trading major currency pairs or exotic sym
FX Volume
Daniel Stein
4.58 (33)
모닝 브리핑을 통해 세부 정보와 스크린샷으로 매일 시장 업데이트를 받으세요 여기 mql5 및 텔레그램에서 FX 거래량은 브로커의 관점에서 시장 심리에 대한 실제 통찰력을 제공하는 최초이자 유일한 거래량 지표입니다. 브로커와 같은 기관 시장 참여자가 외환 시장에서 어떤 포지션을 취하고 있는지에 대한 훌륭한 통찰력을 COT 보고서보다 훨씬 빠르게 제공합니다. 차트에서 이 정보를 직접 확인하는 것은 트레이딩의 진정한 판도를 바꾸고 획기적인 솔루션입니다. 다음과 같은 고유한 시장 데이터 인사이트의 이점 비율 는 통화의 매수/매도 포지션 비율을 백분율로 표시 비율 변화 는 선택한 기간 내 매수 비율과 비율 변화를 표시 총 거래량 는 해당 통화의 총 거래량(롱 및 숏)을 로트 단위로 보여줍니다 Volumes Long 는 해당 통화의 모든 롱 포지션의 거래량을 보여줍니다 Volumes Short 는 해당 통화의 모든 숏 포지션의 거래량을 보여줍니다 Net Long 는 순 롱 포지션의 거래량
TPSpro RFI Levels
Roman Podpora
4.82 (22)
지침         러시아   -        영어       표시기와 함께 사용하는 것이 좋습니다   .       -       TPSpro   트렌드 프로 -   MT4 버전         거래에서 핵심 요소는 거래 상품을 매수 또는 매도하기로 결정하는 구역 또는 수준입니다. 주요 업체가 시장에서 자신의 존재를 숨기려는 시도에도 불구하고, 그들은 필연적으로 흔적을 남깁니다. 우리의 과제는 이러한 흔적을 식별하고 올바르게 해석하는 방법을 배우는 것이었습니다. 주요 기능:: 판매자와 구매자를 위한 활성 영역을 표시합니다! 이 지표는 매수 및 매도를 위한 모든 올바른 초기 임펄스 레벨/존을 보여줍니다. 진입점 검색이 시작되는 이러한 레벨/존이 활성화되면 레벨의 색상이 바뀌고 특정 음영으로 채워집니다. 또한 상황을 보다 직관적으로 이해하기 위해 화살표가 나타납니다. 더 높은 시간대의 레벨/존 표시(MTF 모드) 더 높은 시간 간격을 사용하여 레벨/존을 표시하는 기능을 추가했습니다.
FX Power MT4 NG
Daniel Stein
5 (13)
모닝 브리핑 여기 mql5 와 텔레그램에서 FX Power MT4 NG 는 오랫동안 인기 있는 통화 강도 측정기인 FX Power의 차세대 버전입니다. 이 차세대 강도 측정기는 무엇을 제공합니까? 기존 FX Power에서 좋아했던 모든 것 PLUS GOLD/XAU 강도 분석 더욱 정밀한 계산 결과 개별 구성 가능한 분석 기간 더 나은 성능을 위한 사용자 정의 가능한 계산 한도 특별 멀티더 많은 것을보고 싶은 사람들을위한 특별한 다중 인스턴스 설정 모든 차트에서 좋아하는 색상을위한 끝없는 그래픽 설정 수많은 알림 옵션, 중요한 것을 다시는 놓치지 않도록 Windows 11 및 macOS 스타일의 둥근 모서리가 있는 새로운 디자인 마법처럼 움직이는 인디케이터 패널 FX 파워 키 특징 모든 주요 통화의 완전한 강세 이력 모든 시간대에 걸친 통화 강세 이력 모든 브로커 및 차트에서 고유 계산 결과 100% 신뢰할 수있는 실시간100 % 신뢰할 수있는 실시간 계산-> 다시 칠하지 않음
우선적으로, 이 거래 도구는 전문적인 거래에 이상적인 비-다시 그리기 및 지연되지 않는 지표입니다.  온라인 강좌, 사용자 매뉴얼 및 데모. 스마트 가격 액션 컨셉트 인디케이터는 신규 및 경험 많은 트레이더 모두에게 매우 강력한 도구입니다. Inner Circle Trader Analysis 및 Smart Money Concepts Trading Strategies와 같은 고급 거래 아이디어를 결합하여 20가지 이상의 유용한 지표를 하나로 결합합니다. 이 인디케이터는 스마트 머니 컨셉트에 중점을 두어 대형 기관의 거래 방식을 제공하고 이동을 예측하는 데 도움을 줍니다.  특히 유동성 분석에 뛰어나 기관이 어떻게 거래하는지 이해하는 데 도움을 줍니다. 시장 트렌드를 예측하고 가격 변동을 신중하게 분석하는 데 탁월합니다. 귀하의 거래를 기관 전략에 맞추어 시장의 동향에 대해 더 정확한 예측을 할 수 있습니다. 이 인디케이터는 시장 구조를 분석하고 중요한 주문 블록을 식별하고 다양한
MetaTrader 4용 Ultimate Gold Advisor Ultimate Gold Advisor는 MetaTrader 4에서 거래 경험을 최적화하도록 설계된 고급 기술 도구입니다. 경험 많은 거래자의 요구를 충족하기 위해 개발된 이 지표는 정밀성, 정교한 분석 및 다기능성을 결합하여 정보에 입각한 거래 결정을 내리는 데 도움을 줍니다. 금 거래에 이상적이지만 다양한 자산에 적용 가능하며, Ultimate Gold Advisor는 시장 전략을 향상시키는 데 도움을 줄 수 있습니다. Ultimate Gold Advisor가 거래자에게 훌륭한 도구인 이유는 무엇입니까? 고급 성능: 각 거래 결과를 차트에 명확하게 표시하는 지표들의 조합으로 전략 성과를 투명하게 볼 수 있습니다. 이를 통해 접근 방식을 개선하고 더 정보에 입각한 결정을 내릴 수 있습니다. 즉각적이고 시각적인 거래 신호: 차트에 빨간색과 파란색 화살표가 표시되어 매수 및 매도 기회를 신호합니다. 이러한 시각적 신호는
M1 Gold
Abdulkarim Karazon
Legacy of Gann
Pavel Zamoshnikov
4.83 (12)
The indicator very accurately determines the levels of the possible end of the trend and profit fixing. The method of determining levels is based on the ideas of W.D.Gann, using an algorithm developed by his follower Kirill Borovsky. Extremely high reliability of reaching levels (according to K. Borovsky  - 80-90%) Indispensable for any trading strategy – every trader needs to determine the exit point from the market! Precisely determines targets on any timeframes and any instruments (forex, met
Gold Channel XAUUSD
Paulo Rocha
5 (2)
Gold Channel is a volatility-based indicator, developed with a specific timing algorithm for the XAUUSD pair, which consists of finding possible corrections in the market. This indicator shows two outer lines, an inner line (retracement line) and an arrow sign, where the theory of the channel is to help identify overbought and oversold conditions in the market. The market price will generally fall between the boundaries of the channel. If prices touch or move outside the channel it is a tra
Currency Strength Wizard
Oleg Rodin
4.93 (44)
통화 강도 마법사는 성공적인 거래를 위한 올인원 솔루션을 제공하는 매우 강력한 지표입니다. 표시기는 여러 시간 프레임의 모든 통화 데이터를 사용하여 이 또는 해당 외환 쌍의 힘을 계산합니다. 이 데이터는 특정 통화의 힘을 확인하는 데 사용할 수 있는 사용하기 쉬운 통화 지수 및 통화 전력선의 형태로 표시됩니다. 필요한 것은 거래하려는 차트에 표시기를 부착하는 것뿐입니다. 표시기는 거래하는 통화의 실제 강세를 보여줍니다. 지표는 또한 추세와 거래할 때 유리하게 사용할 수 있는 구매 및 판매 거래량 압력의 극한값을 보여줍니다. 지표는 또한 피보나치에 기반한 가능한 대상을 보여줍니다. 표시기는 PUSH 알림을 포함한 모든 유형의 알림을 제공합니다. 구매 후 연락주세요. 나는 당신과 거래 팁을 공유하고 당신에게 무료로 훌륭한 보너스 지표를 줄 것입니다! 나는 당신에게 행복하고 유익한 거래를 기원합니다!
GOLD Impulse with Alert
Bernhard Schweigert
4.56 (9)
이 지표는 Advanced Currency IMPULSE with ALERT  +   Currency Strength Exotics  의 2가지 제품의 슈퍼 조합입니다. 그것은 모든 시간 프레임에 대해 작동하며 8개의 주요 통화와 하나의 기호에 대한 강약의 충동을 그래픽으로 보여줍니다! 이 표시기는 금, 이국적인 쌍, 상품, 지수 또는 선물과 같은 기호에 대한 통화 강도 가속을 표시하는 데 특화되어 있습니다. 금, 은, 오일, DAX, US30, MXN, TRY, CNH 등의 진정한 통화 강도 가속(충동 또는 속도)을 표시하기 위해 9번째 줄에 모든 기호를 추가할 수 있습니다. 새로운 기본 알고리즘을 기반으로 구축되어 잠재적인 거래를 훨씬 더 쉽게 식별하고 확인할 수 있습니다. 이는 통화의 강세 또는 약세가 가속되는지 여부를 그래픽으로 표시하고 가속 속도를 측정하기 때문입니다. 자동차의 속도계처럼 생각하면 됩니다. 가속화할 때 Forex 시장에서 동일한 일이 분명히
Scalper Vault
Oleg Rodin
5 (27)
Scalper Vault 는 성공적인 스캘핑에 필요한 모든 것을 제공하는 전문 스캘핑 시스템입니다. 이 표시기는 외환 및 바이너리 옵션 거래자가 사용할 수 있는 완전한 거래 시스템입니다. 권장 시간 프레임은 M5입니다. 시스템은 추세 방향으로 정확한 화살표 신호를 제공합니다. 또한 상단 및 하단 신호와 Gann 시장 수준을 제공합니다.  이 시스템은 사용하기가 매우 쉽습니다. 원하는 시장 지역의 화살표만 따라가면 됩니다. 엑시트는 가격이 적정 수준에 도달하거나 시장의 고점 또는 저점 신호가 나타날 때 수행됩니다.  표시기는 PUSH 알림을 포함한 모든 유형의 경고를 제공합니다. 인디케이터 구매 후 연락주세요. 내 개인 거래 권장 사항과 훌륭한 보너스 지표를 무료로 공유합니다! 나는 당신에게 행복하고 유익한 거래를 기원합니다!
Matrix Arrow Indicator MT4
Juvenille Emperor Limited
5 (3)
매트릭스 화살표 표시기 MT4 는 외환, 상품, 암호 화폐, 지수, 주식과 같은 모든 기호/도구에 사용할 수 있는 100% 다시 칠하지 않는 다중 기간 표시기를 따르는 고유한 10 in 1 추세입니다.  Matrix Arrow Indicator MT4 는 다음과 같은 최대 10개의 표준 지표에서 정보와 데이터를 수집하여 초기 단계에서 현재 추세를 결정합니다. 평균 방향 이동 지수(ADX) 상품 채널 지수(CCI) 클래식 하이켄 아시 캔들 이동 평균 이동 평균 수렴 발산(MACD) 상대 활력 지수(RVI) 상대 강도 지수(RSI) 포물선 SAR 스토캐스틱 오실레이터 윌리엄스의 백분율 범위 모든 지표가 유효한 매수 또는 매도 신호를 제공하면 강력한 상승/하락 추세를 나타내는 다음 캔들/막대가 시작될 때 해당 화살표가 차트에 인쇄됩니다. 사용자는 사용할 표시기를 선택하고 각 표시기의 매개변수를 개별적으로 조정할 수 있습니다. 매트릭스 화살표 표시기 MT4는 선택한 표시기에서만 정보를 수
Advanced Currency IMPULSE with ALERT
Bernhard Schweigert
4.9 (481)
현재 31% 할인!! 초보자 또는 전문가 트레이더를 위한 최고의 솔루션! 이 지표는 우리가 독점 기능과 비밀 공식을 통합했기 때문에 독특하고 고품질이며 저렴한 거래 도구입니다. 단 하나의 차트로 28개 통화 쌍 모두에 대한 경고를 제공합니다. 새로운 추세 또는 스캘핑 기회의 정확한 트리거 포인트를 정확히 찾아낼 수 있기 때문에 거래가 어떻게 개선될지 상상해 보십시오! 새로운 기본 알고리즘을 기반으로 구축되어 잠재적인 거래를 훨씬 더 쉽게 식별하고 확인할 수 있습니다. 이는 통화의 강세 또는 약세가 가속되는지 여부를 그래픽으로 표시하고 가속 속도를 측정하기 때문입니다. 자동차의 속도계처럼 생각하면 됩니다. 가속화할 때 Forex 시장에서 동일한 일이 분명히 더 빠르게 발생합니다. 즉, 반대 방향으로 가속화되는 통화를 페어링하면 잠재적으로 수익성 있는 거래를 식별한 것입니다. 통화 모멘텀의 수직선과 화살표가 거래를 안내합니다! 역동적인 Market Fibonacci 23
Chart Patterns All in One
Davit Beridze
4.25 (8)
구매 후 댓글을 남기시면 고품질의 인디케이터 4개를 보너스로 받으실 수 있습니다. Chart Patterns All-in-One 지표는 트레이더가 기술 분석에서 흔히 사용되는 다양한 차트 패턴을 시각화하는 데 도움을 줍니다. 이 지표는 잠재적인 시장 움직임을 식별하는 데 도움이 되지만, 수익성을 보장하지는 않습니다. 구매 전에 데모 모드에서 지표를 테스트하는 것이 좋습니다. 현재 할인 : "Chart Patterns All in One" 지표 50% 할인 중. 포함된 패턴 : 1-2-3 패턴 : 세 가지 주요 지점(고점 또는 저점)을 사용하여 시장 반전을 감지합니다. 매수 : 연속된 두 저점 이후, 이전 고점보다 낮은 고점이 발생할 때. 매도 : 연속된 두 고점 이후, 이전 저점보다 높은 저점이 발생할 때. 시각화 : 선과 화살표가 감지된 지점을 연결합니다. 더블 탑과 더블 바텀 : 가격이 두 개의 연속된 고점(더블 탑) 또는 저점(더블 바텀)을 형성할 때, 반전의 가능성을 나타냅니
Blahtech Supply Demand
Blahtech Limited
4.61 (33)
Was: $299  Now: $99   Supply Demand uses previous price action to identify potential imbalances between buyers and sellers. The key is to identify the better odds zones, not just the untouched ones. Blahtech Supply Demand indicator delivers functionality previously unavailable on any trading platform. This 4-in-1 indicator not only highlights the higher probability zones using a multi-criteria strength engine, but also combines it with multi-timeframe trend analysis, previously confirmed swings
AW Prime Oscillator
AW Trading Software Limited
5 (1)
두 개의 오실레이터의 조합. 첫 번째 항목은 진입점을 표시하고 두 번째 항목은 현재 추세를 표시합니다. 표시기는 두 가지 모드의 화살표로 오실레이터 신호를 표시할 수 있습니다. 모든 빠른 오실레이터 신호 또는 현재 추세 방향의 신호만 표시할 수 있습니다. 다중 시간대 패널과 세 가지 유형의 신호 알림이 있습니다. 이익: 일일 및 스캘핑 거래에 적합 추세 필터링 간단하고 민감한 설정 다중 시간대 패널 Advisor에 통합하는 데 적합합니다. 모든 기호 및 기간에서 작동합니다. 세 가지 유형의 알림 MT5 version ->  HERE  / Problem solving ->  HERE 지표 전략 표시기는 두 개의 서로 다른 오실레이터로 구성됩니다. 느린 추세선(두꺼움) - 지표의 고수준이 위에서 아래로 교차하면 하락세 지표이고, 낮은 수평 수준(지표의 낮은 수준)이 아래에서 위로 교차하면 하락 추세 지표입니다. 상승 경향. 또한, 하단 영역에서 느린 선을 발견하면 현재 추세가 하락세임
SSM ZakopiecFX Follow The Trend
ROBERT URBANSKI
4.81 (21)
맞춤형 MT4 지표로 성공적인 외환 거래에 대한 비밀을 발견하십시오! 외환 시장에서 성공을 달성하고 위험을 최소화하면서 일관되게 이익을 얻는 방법을 궁금해 한 적이 있습니까? 여기에 당신이 찾고 있던 답이 있습니다! 거래에 대한 귀하의 접근 방식을 혁신 할 독점적 MT4 지표를 소개 할 수 있습니다. 독특한 다양성 우리의 지표는 Renko 및 Rangebar Candle Formations를 선호하는 사용자를 위해 특별히 설계되었습니다. 우리는 이러한 차트 유형이 많은 숙련 된 거래자들이 선호한다는 것을 이해하기 때문에 우리의 지표가 그들과 완벽하게 통합되어 비교할 수없는 시장 분석을 제공합니다. 명확한 추세 신호 복잡한 분석을 잊어 버리십시오! 우리의 지표는 생생한 색상과 명확한 점 구조를 사용하여 시장 동향을 명확하게 나타냅니다. 빨간색과 파란색 점은 가격 이동 방향에 대해 의심의 여지가 없어 거래에서 빠른 의사 결정을 할 수 있습니다. HH/HL HL/LL
Advanced Currency Strength28 Indicator
Bernhard Schweigert
4.9 (650)
현재 26% 할인 초보자 또는 전문가 트레이더를 위한 최고의 솔루션! 이 지표는 우리가 독점 기능과 새로운 공식을 통합했기 때문에 독특하고 고품질이며 저렴한 거래 도구입니다. 단 하나의 차트로 28 Forex 쌍의 통화 강도를 읽을 수 있습니다! 새로운 추세 또는 스캘핑 기회의 정확한 트리거 포인트를 정확히 찾아낼 수 있기 때문에 거래가 어떻게 개선될지 상상해 보십시오. 사용 설명서: 여기를 클릭  https://www.mql5.com/en/blogs/post/697384 그것이 첫 번째, 원본입니다! 쓸모없는 지망생 클론을 사지 마십시오. 더 스페셜  강력한 통화 모멘텀을 보여주는 하위 창의 화살표 GAP가 거래를 안내합니다! 기본 또는 호가 통화가 과매도/과매도 영역(외부 시장 피보나치 수준)에 있을 때 개별 차트의 기본 창에 경고 표시가 나타납니다. 통화 강도가 외부 범위에서 떨어질 때 풀백/반전 경고. 교차 패턴의 특별 경고 추세를 빠르게 볼 수 있는
Black dragon indicator
Ramil Minniakhmetov
4.85 (110)
추세 감지 표시기는 모든 전략을 보완하며 독립적인 도구로도 사용할 수 있습니다. 표시기 작업에 대한 권장 사항은 댓글 #8 에서 다운로드할 수 있습니다. 장점 사용하기 쉽고 불필요한 정보로 차트에 과부하가 걸리지 않습니다. 모든 전략에 대한 필터로 사용할 수 있습니다. 기본 제공 수준의 동적 지원 및 저항이 있어 이익을 얻고 손절매를 설정하는 데 모두 사용할 수 있습니다. 촛대가 닫힌 후에도 표시기는 색상을 변경하지 않습니다.  주식 시장, 지수, 석유, 금 및 모든 시간대에서 작동합니다. 토스트 알림, 이메일 알림, 푸시 알림 및 소리 알림 기능이 있습니다. 내 다른 개발은 여기에서 찾을 수 있습니다: https://www.mql5.com/ko/users/mechanic/seller 입력 매개변수 Alert - 켜기/끄기. 알리다; Push Notification - 켜기/끄기. 푸시 알림; Mail - 켜기/끄기 이메일 알림; Fibo 1,2,3,4,5,6,7,11,
Automated Trendlines
Georgios Kalomoiropoulos
5 (16)
추세선은 외환 거래에서 기술적 분석의 가장 필수적인 도구입니다. 불행히도, 대부분의 거래자는 올바르게 그리지 않습니다. 자동 추세선 표시기는 시장의 추세 움직임을 시각화하는 데 도움이 되는 진지한 거래자를 위한 전문 도구입니다. 추세선 강세 추세선과 약세 추세선에는 두 가지 유형이 있습니다. 상승 추세에서 Forex 추세선은 가격 움직임의 가장 낮은 스윙 포인트를 통해 그려집니다. 최소 두 개의 "최저 저점"을 연결하면 추세선이 생성됩니다. 하락 추세에서 추세선은 가격 움직임의 가장 높은 스윙 포인트를 통해 그려집니다. 최소 두 개의 "최고 최고점"을 연결하면 추세선이 생성됩니다. 추세선이 깨질 때? 강세 추세선은 약세 양초가 강세 추세선 아래에서 닫히고 양초의 고점이 추세선 위에 있을 때 깨집니다. 약세 추세선은 강세 양초가 약세 추세선 위로 마감되고 양초 저점이 추세선 아래에 있을 때 깨집니다. 추세선이 삭제되면? 강세 추
Best Currency Strength Indicator
Tumelo Patrick Rakotsoane
4.59 (46)
Advanced Currency Strength Indicator The Advanced Divergence Currency Strength Indicator. Not only it breaks down all 28 forex currency pairs and calculates the strength of individual currencies across all timeframes , but, You'll be analyzing the WHOLE forex market in 1 window (In just 1 minute) . This indicator is very powerful because it reveals the true movements of the market.  It is highly recommended to  analyze charts knowing the performance of individual currencies or the countries ec
Allows multiple indicators to be combined into a single indicator, both visually and in terms of an alert. Indicators can include standard indicators, e.g. RSI, CCI, etc., and also Custom Indicators, even those purchased through Market, or where just have the ex4 file. An early alert is provided, say when 4 out 5 indicators have lined up, and a confirmed alert when all are in agreement. A‌lso features a statistics panel reporting the success of the combined indicator by examining the current cha
제작자의 제품 더 보기
Delta 2 symbols
VLADISLAV AKINDINOV
The indicator is designed for pair trading with 2 highly correlated instruments.  Indicator charts can be displayed as lines or histograms. There is an MTF mode, the maximum and minimum deltas for the calculated number of bars are displayed with a check for a specified minimum value. It is possible to enable the calculation of trade operations with checking the current correlation coefficient for the minimum specified, the current delta in points or percent of the maximum (minimum) delta and
Signal indicator Cma 2 Cjcf
VLADISLAV AKINDINOV
5 (1)
A signal indicator consisting of several well-known indicators that process data sequentially. 2 options - for schedule and basement. In the settings it is possible to enable alerts about the change of trend (alerts) sound, by e-mail and push. It is possible to change the colors and thickness of the lines, the colors and codes of the arrows, the number of calculation bars and separately configure the parameters included in the indicators.
FREE
Amka Ccf
VLADISLAV AKINDINOV
5 (4)
A trend indicator is a hybrid of several well-known indicators that process data sequentially with signaling a trend change. Final processing of the AMka indicator data. The indicator is conventionally not drawing - upon restarting, it can change some of the chart data, but if you do not touch it, it will not redraw. It is possible to issue an alert, sound, send an e-mail or a message to another terminal when the trend changes.
FREE
Advisor for semi-automatic trading with a virtual multi-level trail of take profit and stop loss, a trail of target profit, martingale functions, manual opening of orders, managing third-party orders, counting trading instruments, displaying current information and statistics on a chart. It is possible to set several levels of trailing take profit and stop loss and to each level to assign the percentage of partial closing of the order. The percentage of the lot when closing the level is calculat
The indicator is a mathematical analog of a two-level RC (resistor-capacitor) filter. On the chart (default colors), the red line is the standard terminal Moving Average, the values ​​of which are filtered by the first level filter (yellow line) and then by the second level filter (blue line). Moving Average sets the preliminary smoothing of the price series.  The indicator has the ability to use the sticking together of any combination of its own charts among themselves, if they are at a dis
Trend Deviation
VLADISLAV AKINDINOV
Trend indicator with calculation of dynamic levels and signaling their intersection. Description of input parameters: StepTF = true; - Calculation of the indicator by closing the bar (true) or by each tick (false) BarsCount = 300; - Number of settlement bars Price = PRICE_CLOSE; - Type of price used TimeFrame = PERIOD_CURRENT; - Estimated timeframe TrendPeriod = 9; - Trend calculation period TrendDeviations = 4.9; - coefficient of deviation PeriodTrendSmooth = 1; - Trend smoothi
MEA2RTEn
VLADISLAV AKINDINOV
The adviser works on the basis of terminal indicators. It can work in martingale mode if you set the number of unidirectional orders to be greater than 1 and adjust the lot coefficients and the step of opening the knees, which can be opened taking into account the indicator signal. If the adviser is launched on several instruments and the comments of the orders are the same, then you can limit the number of simultaneously trading advisers - the advisers themselves will track how much they are c
Arrow indicator of trend reversal with 2-level signaling and multi timeframe. The indicator line consists of 4 colors, indicating the divergence level and possible trend reversals. Light arrows indicate a weak trend, dark arrows indicate a strong one. Sensitivity levels and steps are set in the settings. Signals are output to the mailbox and mobile terminal.
The Expert Advisor trades on a trend reversal on any instrument and timeframe. Testing was carried out on the H4 timeframe. Trades are not frequent and therefore, to increase the number of trades, it is advisable to put on several instruments. To control the number of simultaneously trading advisors, a limit for trading symbols is set and advisors must have the same order comments. Closing deals can be done in virtual mode (preferably). There are information and statistics panels. Indicator base
CCi indicator with dynamic levels based on the standard MA, taken as the basis for reading the levels, and modified data of the standard CCi relative to the MA. The input parameter CutCCi, if greater than 0, limits the vertical drawing of the CCi graph, but does not affect the calculations. There are 3 options for displaying arrows: arrows when crossing levels to exit the level zone - trend, arrows to return after exiting the level zone - reverse and crossing the zero level (red MA line). You ca
Growth and trend reversal indicator. It does not redraw in the bar calculation mode and can redraw on the 0th bar in the tick calculation mode. The trend line and level lines with their own settings are calculated separately. There are 2 types of arrows - for the intersection of trend lines and the reverse intersection of trend lines (reversal). The arrows are buffer and you can output signals to the Expert Advisor. The arrows can be duplicated with a sound signal, a message from the terminal,
Deviation trend indicator
VLADISLAV AKINDINOV
5 (1)
Indicator of trend deviation with a static level. The deviation coefficient is set for the trend histogram. Signals are the intersection of the level trend histogram in the direction of the trend or during a trend reversal - the option is selected in the indicator settings by the "Revers" parameter. There are all the necessary settings for the design of the indication and sending messages to mail or a mobile terminal. All input parameters have an intuitive name. Analog for MT5: https://www.mql5
Multi Closer MT4
VLADISLAV AKINDINOV
The utility is designed to control all account orders with the ability to automatically close them by: profit, breakeven or trailing profit in points separately for each order separately profit, breakeven or trailing profit in points for buy orders of each symbol profit, breakeven or trailing profit in points for sell orders of each symbol profit, breakeven or trailing profit in points for buy+sell orders of each symbol profit, breakeven or trailing profit in points for the entire account as a
The Expert Advisor is designed for pair trading with 2 instruments with high positive or negative correlation. Instrument lots are balanced automatically depending on the tick value of the instrument, and therefore it is advisable to use the base lot of at least 0.05. The function of refills is built-in, taking into account the number of knees and the coefficients of multiplication and addition of lots. Trades are opened when there is a discrepancy by a specified distance in points of instrument
The Expert Advisor is designed for pair trading with 2 selected instruments with automatic calculation of the correlation coefficient and determination of one of 8 possible entries by 4 for positive and negative correlation. The inputs used are set in the settings: 1 and 3 for trading for a fall in the delta between instruments, 2 and 3 for trading for a rise in the delta (a more dangerous trading option). There are trade control buttons, information and statistical panels. There is a wide range
Trend reversal expert
VLADISLAV AKINDINOV
The Expert Advisor is based on a proprietary triple indicator. Each of the 3 parts of the indicator can be disabled and individually configured. Initially, it was supposed to enter trade at a trend reversal, but you can set up an entry along the trend. It is possible to control the main functions using the buttons on the chart, including opening positions manually. There are grid functions with the total profit of all unidirectional positions (for hedging accounts) with martingale functions (opt
Deviation trend
VLADISLAV AKINDINOV
Indicator of trend deviation with a static level. The deviation coefficient is set for the trend histogram. Signals are the intersection of the level trend histogram in the direction of the trend or during a trend reversal - the option is selected in the indicator settings by the "Revers" parameter. There are all the necessary settings for the design of the indication and sending messages to mail or a mobile terminal. All input parameters have an intuitive name. Analog for MT4: https://www.mql5.
Delta 2 Symbols MT5
VLADISLAV AKINDINOV
The indicator is designed for pair trading with 2 highly correlated instruments.  Indicator charts can be displayed as lines or histograms. There is an MTF mode, the maximum and minimum deltas for the calculated number of bars are displayed with a check for a specified minimum value. It is possible to enable the calculation of trade operations with checking the current correlation coefficient for the minimum specified, the current delta in points or percent of the maximum (minimum) delta and
The indicator calculates the correlation coefficient of 2 instruments, shifts the chart of the 2nd instrument relative to the 1st and displays the charts of both instruments on the current chart. The maximum positive and negative deltas and the current delta as a percentage of the maximum are calculated. It is possible for signals to set a delta for entry and exit with displaying the direction of entry into trade for each instrument. The space between the charts is also filled with different col
Signal scanner MT5
VLADISLAV AKINDINOV
The scanner is designed to scan signal buffers of indicators (arrows) and display the nearest signal bar on the panel in color and digital display. Symbols to be scanned, time frames and the number of bars to be scanned are specified, starting from the current (0th) bar. There is also a complex signal, which indicates a list of timeframes on which the indicator signal must match.   You can collapse the indicator by clicking the left mouse button on the upper left corner of the panel (name)
Extremum levels
VLADISLAV AKINDINOV
이 지표는 전일, 주, 월의 최고 및 최저 가격을 보여줍니다. 극한 지점의 돌파를 식별하고 거래 진입 방향을 결정하도록 설계되었습니다. 반전 수준을 보다 정확하게 결정하기 위해 피보나치 수준을 표시할 수 있습니다. 또한 이전 청구 기간 동안의 가격 변동을 보다 명확하게 보여주기 위해 최고 가격과 최저 가격 사이의 공간에 표시할 수도 있습니다. 현재 캔들(바)이 닫힐 때까지의 시간을 나타냅니다. 버전 2.0에는 3가지 새로운 지그재그 반전 신호 레벨이 추가되었으며 각 레벨에 대한 경보를 제공합니다. This indicator shows the maximum and minimum prices of the previous day, week and month. Designed to identify breakouts of extreme points and determine the direction of entry into a trade. To more accurately determin
Semi automatic expert
VLADISLAV AKINDINOV
The advisor is intended for trading on a hedging account, because trades in both directions simultaneously. In this case, you can use both trading with one order (preferably) and a grid of orders in martingale mode. In this case, built-in indicators of our own design are used. There is a limit on the number of simultaneously trading symbols. Trading can be carried out on any symbol with any time frames. The advisor has built-in functionality for manual trading. This is a panel with the abilit
Flipping expert
VLADISLAV AKINDINOV
The advisor is intended for trading on a hedging account, because trades in both directions simultaneously and reverses the direction of trade. In this case, you can use both trading with one order (preferably) and a grid of orders in martingale mode. In this case, a built-in indicator of our own design is used. There is a limit on the number of simultaneously trading advisors. Trading can be carried out on any symbol with any time frames.
필터:
리뷰 없음
리뷰 답변