Stochastic Rsi Style MT5
- 지표
- Javier Morales Fernandez
- 버전: 1.0
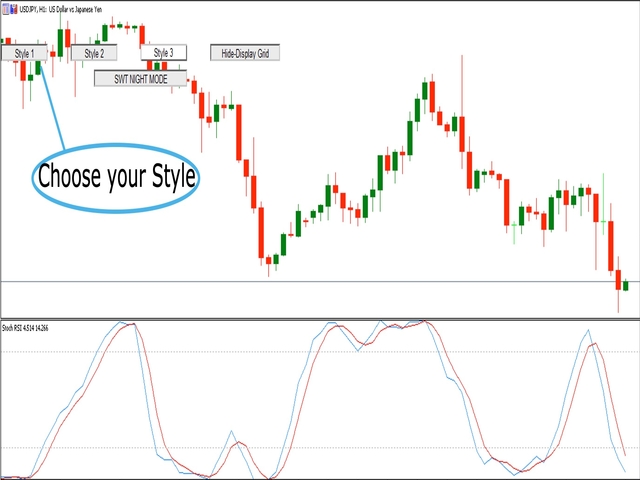
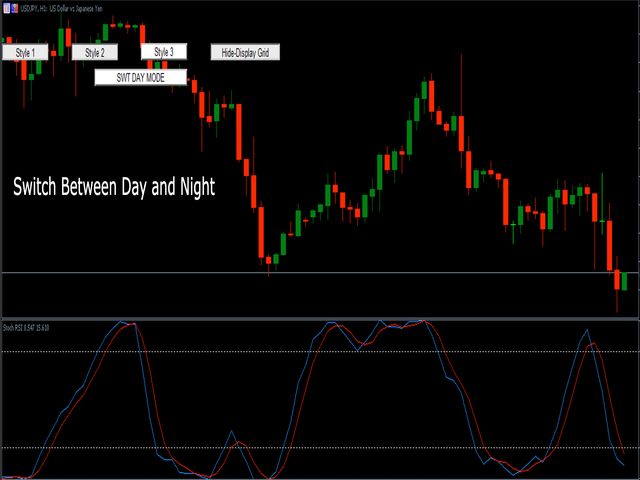
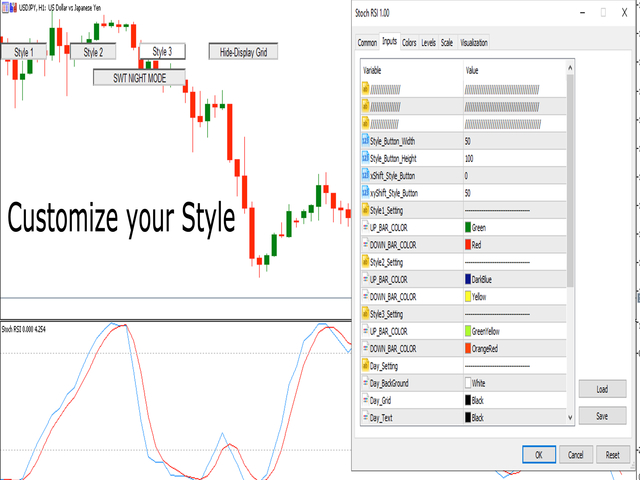
스타일이 중요하기 때문에 촛불의 색상, 배경을 밝거나 어둡게 변경하고 격자를 넣거나 제거하기 위해 매번 속성을 클릭하는 것이 얼마나 성가신 일인지 압니다. 클릭 한 번으로 해결하는 방법은 다음과 같습니다.
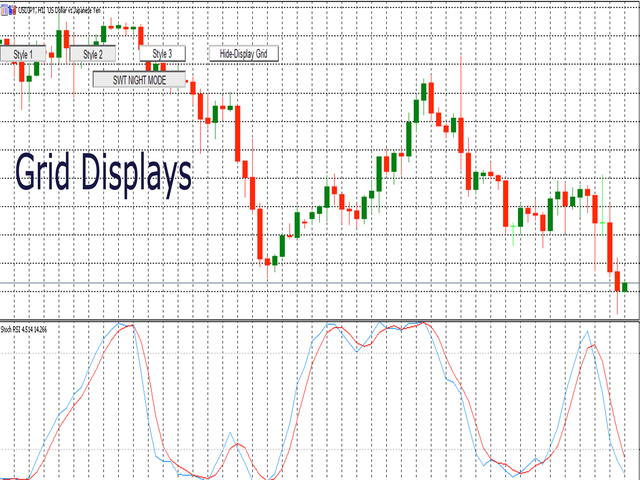
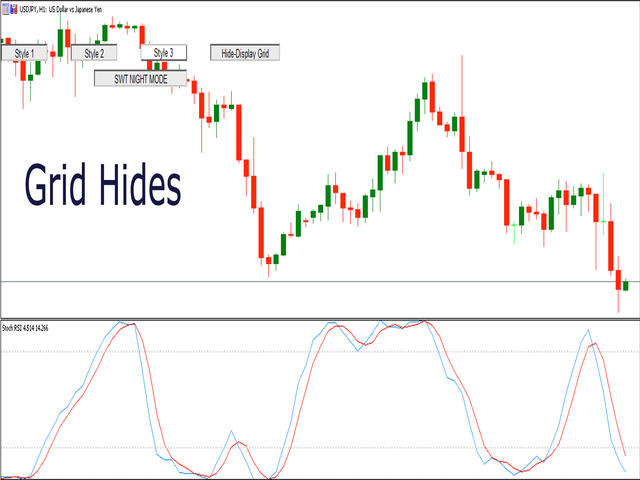
- 차트에서 그리드를 표시하거나 숨기는 버튼 1개.
- 트레이더가 원하는 캔들 스타일을 선택할 수 있는 3개의 맞춤형 버튼.
- 주간 모드와 야간 모드 사이를 전환하는 버튼 1개.
*****설정에서 화면에서 버튼을 표시할 위치를 선택할 수 있습니다.***
내 다른 제품을 확인하는 것을 고려하십시오 https://www.mql5.com/en/users/javimorales.fer/seller
스토캐스틱 RSI란 무엇입니까?
스토캐스틱 RSI(StochRSI)는 0과 1(또는 일부 차트 플랫폼의 경우 0과 100) 범위의 기술적 분석에 사용되는 지표이며 스토캐스틱 오실레이터 공식을 상대 강도 지수(RSI) 값 세트에 적용하여 생성됩니다. 표준 가격 데이터보다
작가
트레이딩 알고리즘의 창시자 하비에르 모랄레스(Javier Morales).