• 미리보기
  • 리뷰
  • 코멘트

Arlene Sessions Backgrounds 2

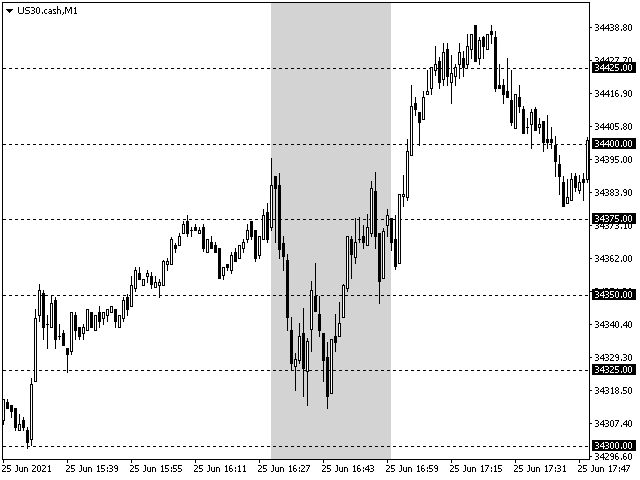
Arlene Sessions Background is an indicator that draws colored vertical background on the chart depending on your session.
You can see the version 1 here: https://www.mql5.com/en/market/product/68822

You can see more of my publications here: https://www.mql5.com/en/users/joaquinmetayer/seller

If you only want to paint a session on your chart, you must set the color "none" to deactivate it.


추천 제품
Matrix Arrow Indicator Multi Timeframe Panel MT4 는 Matrix Arrow Indicator MT4 를 위한 무료 추가 기능이자 훌륭한 자산입니다. 5개의 사용자 맞춤형 타임프레임과 총 16개의 수정 가능한 기호/기기에 대한 현재 매트릭스 화살표 표시기 MT4 신호를 보여줍니다. 사용자는 Matrix Arrow Indicator MT4 로 구성된 10개의 표준 표시기를 활성화/비활성화할 수 있습니다. Matrix Arrow Indicator MT4 에서와 같이 10개의 모든 표준 지표 속성도 조정 가능합니다. 매트릭스 화살표 표시기 다중 시간 프레임 패널 MT4는 16개의 수정 가능한 기호 버튼 중 하나를 클릭하여 첨부된 현재 차트를 변경할 수 있는 옵션도 제공합니다. 이렇게 하면 다른 기호 간에 훨씬 빠르게 작업할 수 있고 다시는 거래 기회를 놓치지 않을 수 있습니다. 이 무료 Matrix Arrow Indicator Multi Time
FREE
Arlene Sessions Backgrounds
Joaquin Nicolas Metayer
Arlene Sessions Background is an indicator that draws colored rectangles on the chart depending on your session, within the price range that has moved and when the sessions overlap, it will be painted in a color that will be the mixture of the colors of the respective sessions. You can see the version 2 here:  https://www.mql5.com/en/market/product/68934 Inputs NumberOfDays AsiaBegin AsiaEnd AsiaColor EurBegin EurEnd EurColor USABegin USAEnd USAColor If you only want to paint a session on yo
FREE
Indicators are professional data statistics, position orders, historical order analysis->>>>>> <This version is in Chinese -> English version please move> Necessary for traders: tools and indicators Waves automatically calculate indicators, channel trend trading Perfect trend-wave automatic calculation channel calculation , MT4 Perfect trend-wave automatic calculation channel calculation , MT5 Local Trading copying Easy And Fast Copy , MT4 Easy And Fast Copy , MT5 Local Trading copying For DEMO
FREE
FVG Fair Value Gap is an indicator that plot rectangle for last found fair value gap. There will be a total of eight fair value gaps. Four is bullish fair value gaps and another four is bearish fair value gaps. Bullish Fair Value Gaps Top Bullish/Bearish Fair Value Gap is the gap that will obey the "Recent candles" and "Nearby Size In Pips" parameters. This fair value gap will be above current price. Bottom Bullish/Bearish Fair Value Gap is the gap that will obey the "Recent candles" and "Nearb
FREE
트레이딩 세션 시간 인디케이터: "트레이딩 세션 시간 인디케이터"는 외환 시장의 다양한 거래 세션에 대한 이해를 높이기 위해 설계된 강력한 기술 분석 도구입니다. 이 시스템에 통합된 인디케이터는 도쿄, 런던 및 뉴욕을 포함한 주요 세션의 개장 및 마감 시간에 대한 중요한 정보를 제공합니다. 자동 시간대 조정을 통해 이 인디케이터는 전 세계 트레이더를 대상으로 하여 고유의 거래 일정을 최적화하고 저활동 시간을 피할 수 있습니다. 시장 심리, 피크 변동성 시기 및 중첩 세션에 대한 통찰력을 제공하여 일중 트레이더가 전략과 일치하는 정확한 결정을 내릴 수 있도록 지원합니다. 사용자 정의 가능한 디스플레이를 통해 사용자 경험을 개인화할 수 있으며, 해당 데이터를 활용한 스마트 트레이딩 계획은 향상된 거래 결과를 가져올 수 있습니다. 저활동 시간을 인식하여 과다 거래를 피하고 품질 높은 기회에 집중함으로써 트레이더가 이 인디케이터를 통해 거래 여정을 최적화할 수 있습니다. 특징:
FREE
IceFX SpreadMonitor
Norbert Mereg
4.91 (11)
IceFX SpreadMonitor is a special spread logging indicator which displays the current, minimum/maximum and average spread values. These values are set to be visible even after a reboot. Also, SpreadMonitor could save all the desired spread values to .csv files for later analysis of the results. Indicator parameters: SpreadLowLevel - low level of spread (show value in green color) SpreadHighLevel - high level of spread (show value in red color) BGColor - background of panel SpreadNormalColor - c
FREE
Show Pips
Roman Podpora
4.3 (54)
이 정보 표시기는 계정의 현재 상황을 항상 알고 싶어하는 사람들에게 유용합니다. 표시기는 포인트, 백분율, 통화 단위의 이익뿐만 아니라 현재 쌍의 스프레드와 현재 기간에서 막대가 마감될 때까지의 시간과 같은 데이터를 표시합니다. 버전 MT5 -   더욱 유용한 지표 차트에 정보선을 배치하는 데는 여러 가지 옵션이 있습니다. 가격 오른쪽(가격보다 뒤에 있음) 코멘트로(차트의 왼쪽 상단에 있음) 화면의 선택된 모서리에 있습니다. 정보 구분 기호를 선택할 수도 있습니다. | / . \ # 표시기에는 다음과 같은 단축키가 내장되어 있습니다. 키 1 - 정보 표시 유형으로 뒤로 이동(가격, 설명 또는 코너 오른쪽) 키 2 - 정보 표시 유형에서 앞으로 나아갑니다. 키 3 - 정보 라인 표시 위치 변경 단축키는 설정에서 다시 할당할 수 있습니다. 이 표시기는 사용하기 쉽고 매우 유익합니다. 설정에서 불필요한 정보 항목을 비활성화할 수 있습니다. 설정 표시된 정보를 교체하기 위한 단축키(
FREE
Easy Pips Maker
Andrei Gerasimenko
4.25 (4)
The recommended timeframe is H1! The indicator has two kinds of signal. This is a signal to open a position from the appearance of an arrow. The price leaves the channel In the first case, the indicator builds arrows based on the constructed channel and Bollinger Bands years. In another case, the trader can trade if the price just went beyond the channel. If the price is higher than the channel - we sell. If the price is lower than the channel, then you can look for a place to buy. It ca
FREE
Ind4 InfoPad Information Panel
Vladislav Andruschenko
4.83 (6)
INFOPad는 MetaTrader 4 터미널에서 선택한 통화 쌍에 대한 정보를 생성하는 정보 패널입니다. 이 표시기에는 5가지 기능이 있습니다. 선택한 기호에 대한 주요 및 주요 정보를 표시합니다. 매도호가 매수, 스프레드, 스탑 레벨, 스왑, 틱 값, 수수료 가격; SL 목표와 TP 목표의 미래 목표를 보여줍니다(설정된 손절매와 이익실현의 포인트 수, 달러 금액). 그것은 기간 동안 받은 이익을 보여줍니다: 오늘, 주, 월, 연도, 선택한 통화에 대한 총 이익; 현재 오픈 포지션, 로트(볼륨), 포지션 수, 포지션 이익(포인트, 달러, 퍼센트)을 보여줍니다. 미결 거래에 대한 차트에 대한 추가 정보를 표시합니다. 그것은 손절매 및 이익 수준 및 이러한 정지 수준의 목표를 보여줍니다. 심볼에서 트랜잭션이 열리거나 트랜잭션이 닫히거나 트랜잭션이 수정될 때 로그 파일에 정보를 기록합니다. 거래를 열 때, 거래를 닫을 때, 거래를 수정할 때 사운드 파일을 재생합니다. 거래 개시, 거래
FREE
SpreadChartOscillator is an indicator that displays the spread line of a symbol in the subwindow of the oscillator. In the parameters it is possible to specify another symbol from which the spread line will be broadcast. If the "Symbol" parameter is left empty, the spread line will be displayed from the current symbol on which the indicator is set. This tool is ideal for traders who want to see the spread dynamics in the oscillator format and use it to protect themselves from entering the market
FREE
ZhiBiQuShi MT4
Qiuyang Zheng
This ZhiBiQuShi tool is suitable for all varieties and is suitable for more than 5 minutes. It is a good tool for judging trends! The price is a downward trend below the two lines, and the price is an upward trend above the two lines. DESCRIPTION OF SETTINGS till_breakeven_rate : Determines how closely the channel will follow the price till the trade breaks even.                                   RECOMMEND 1  space1 : Determines the width of the channel from the beginning of a trade till pro
FREE
Info Symbol Bsm
Thiery Anicet Navis
Info Symbol is an indicator that will allow you to monitor up to 9 different markets. Just enter the name of the symbols and the number of decimal places. With a single click you can switch from one market to another, it will take two clicks for a chart with an expert attached to it. With this indicator, you will know how many points or pips that the monitored markets have gained or lost since the beginning of the day and you will also have the percentage.
FREE
Symbols Spread panel
Andrii Miknevich
5 (1)
An indicator in the form of a panel for collecting statistics on spreads from a specified list of pairs. It is enough to open one chart and set an indicator to collect statistics for all specified pairs. After completion of work, the panel writes values to a file, which allows not to interrupt statistics after completion of work. Input parameters: -Interval to update the spread for pairs (sec) Allows you to specify how often to collect statistics (allows you to reduce the load) -List of p
FREE
FFx Bears Power
Eric Venturi-Bloxs
5 (1)
The purpose of this new version of the MT4 standard indicator provided in your platform is to display in a sub-window multiple timeframes of the same indicator. See the example shown in the picture below. But the display isn’t like a simple MTF indicator. This is the real display of the indicator on its timeframe. Here's the options available in the FFx indicator: Select the timeframes to be displayed (M1 to Monthly) Define the width (number of bars) for each timeframe box Alert pop up/sound/ema
FREE
Visual correlation
Andrey Tatarinov
4 (2)
친애하는 친구, 나는 당신의 관심에 지표 Visual Correlation 를 제시합니다. 서로 다른 통화 쌍의 동작은 서로 연결되어 있습니다. Visual Correlation 표시기를 사용하면 척도를 유지하면서 하나의 차트에 다른 상품을 표시할 수 있습니다. 양의 상관 관계, 음의 상관 관계 또는 상관 관계 없음을 정의할 수 있습니다. 일부 악기는 다른 악기보다 먼저 움직이기 시작합니다. 이러한 순간은 그래프를 오버레이하여 확인할 수 있습니다. 차트에 상품을 표시하려면 Symbol 필드에 상품 이름을 입력합니다. 서로 다른 통화 쌍의 동작은 서로 연결되어 있습니다. Visual Correlation 표시기를 사용하면 척도를 유지하면서 하나의 차트에 다른 상품을 표시할 수 있습니다. 양의 상관 관계, 음의 상관 관계 또는 상관 관계 없음을 정의할 수 있습니다. 일부 악기는 다른 악기보다 먼저 움직이기 시작합니다. 이러한 순간은 그래프를 오버레이하여 확인
FREE
This indicator is one of the useful tools for traders who trade on currency pairs and based on the strength of each currency they can make a correct decision or confirmation in the positions.  It has been calculated for all the minor currency pairs supported by the broker and displays the values of the major currencies. These currencies are displayed horizontally or vertically according to the trader's config when executing the indicator. One of the trading strategies that can be used is to cho
FREE
Austin Currency Strength
Augustine Kamatu
5 (2)
Check out other great products from  https://www.mql5.com/en/users/augustinekamatu/seller   This indicator is the best so far at determining the currency strength of each pair. It provides stable values and is highly adaptive to market changes. It is a great tool to add to your arsenal to make sure you are on the right side of the trend at all times. No inputs required, it is simple plug and play. A Winning Trading Strategy This article describes the components and logic needed to develop a tr
FREE
Pin Bars
Yury Emeliyanov
5 (3)
주요 목적:"핀 바"는 금융 시장 차트에서 핀 바를 자동으로 감지하도록 설계되었습니다. 핀 바는 특징적인 몸체와 긴 꼬리를 가진 촛불로,추세 반전 또는 교정을 신호 할 수 있습니다. 작동 원리:표시기는 차트의 각 촛불을 분석하여 촛불의 몸,꼬리 및 코의 크기를 결정합니다. 미리 정의 된 매개 변수에 해당하는 핀 막대가 감지되면 표시기는 핀 막대의 방향(강세 또는 약세)에 따라 위 또는 아래 화살표로 차트에 표시합니다. 매개 변수: 꼬리의 길이와 핀 바의 몸체 크기 사이의 최소 비율을 정의합니다. "코"와 핀 바의 꼬리 사이의 최대 허용 비율을 설정합니다. 화살표 크기-표시된 핀 막대와 차트에서 핀 막대를 가리키는 화살표 사이의 거리를 정의합니다. 신청:"핀 바"표시기는 잠재적 인 추세 반전 지점을 식별하고 시장 또는 가까운 위치에 진입하기 위해 신호를 생성하는 데 사용할 수 있습니다. 올바르게 사용하고 다른 기술 지표 및 분석 방법과 결합하면이 지표는 거래 결과를 향상시킬
FREE
FFx RVI
Eric Venturi-Bloxs
5 (1)
The purpose of this new version of the MT4 standard indicator provided in your platform is to display in a sub-window multiple timeframes of the same indicator. See the example shown in the picture below. But the display isn’t like a simple MTF indicator. This is the real display of the indicator on its timeframe. Here's the options available in the FFx indicator: Select the timeframes to be displayed (M1 to Monthly) Define the width (number of bars) for each timeframe box Alert pop up/sound/ema
FREE
RSI Dashboard Panel
Niravkumar Maganbhai Patel
5 (7)
This indicator helps you to scan symbols which are in the Market Watch window and filter out a trend according to RSI. The relative strength index (RSI) is a technical indicator used in the analysis of financial markets. It is intended to chart the current and historical strength or weakness of a stock or market based on the closing prices of a recent trading period. The indicator should not be confused with relative strength. The RSI is classified as a momentum oscillator, measuring the veloc
FREE
FFx Awesome Oscillator
Eric Venturi-Bloxs
4 (1)
The purpose of this new version of the MT4 standard indicator provided in your platform is to display in a sub-window multiple timeframes of the same indicator. See the example shown in the picture below. But the display isn’t like a simple MTF indicator. This is the real display of the indicator on its timeframe. Here's the options available in the FFx indicator: Select the timeframes to be displayed (M1 to Monthly) Define the width (number of bars) for each timeframe box Alert pop up/sound/ema
FREE
Silver Bullet MT4
Saksham Solanki
Contact me for any queries or custom orders, if you want to use this in an EA. Key Features: Pattern Recognition : Identifies Fair Value Gaps (FVGs) Spots Break of Structure (BOS) points Detects Change of Character (CHoCH) patterns Versatile Application : Optimized for candlestick charts Compatible with any chart type and financial instrument Real-Time and Historical Analysis : Works seamlessly with both real-time and historical data Allows for backtesting strategies and live market analysis V
FREE
FFx Bulls Power
Eric Venturi-Bloxs
3.67 (3)
The purpose of this new version of the MT4 standard indicator provided in your platform is to display in a sub-window multiple timeframes of the same indicator. See the example shown in the picture below. But the display isn’t like a simple MTF indicator. This is the real display of the indicator on its timeframe. Here's the options available in the FFx indicator: Select the timeframes to be displayed (M1 to Monthly) Define the width (number of bars) for each timeframe box Alert pop up/sound/ema
FREE
Info Spread
Jaroslav Rajcher
4.5 (2)
Displays current spread in the main window of the chart. Indicator Setting: BigDisplay =true or false to switch on and off. DisplaySize = 20 is default DisplayColor = Blue Display_y = 550 position: staring position Y of background panel Display_x = 1200 position: staring position X of background panel Author: Happy Forex (Expert Advisor - your algorithm-driven profit, without stress or work)
FREE
CrossRate
Stanislav Korotky
5 (1)
Ever wondered what is XAU/XAG rate or how Chinese Yuan is traded against Russian Ruble? This indicator gives the answers. It shows a cross rate between current chart symbol and other symbol specified in parameters. Both symbols must have a common currency. For example, in cases of XAUUSD and XAGUSD, or USDRUB and USDCHN, USD is the common currency. The indicator tries to determine the common part from symbols automatically. If it fails, the DefaultBase parameter is used. It is required for non-F
FREE
Period Change Button
Rainer Albrecht
3 (1)
Fastest way to change the period. Suitable for traders who use many charts and timeframes. Size, shape and color can be customized. Inputs Parameters Corner — Choose corner placement Standart is "Right lower chart corner" Color — Background color of the button ColorText — Text color of the button ColorOn — Background color of the button for the current period ColorOnText — Text color of the button for the current period Font — Arial, Verdana... FontSize — Size of the font in pixels DistanceX —
FREE
MQLTA Currency Strength Matrix DEMO
MQL4 Trading Automation
2 (2)
Currency Strength Matrix (CSM) is an indicator that will show you the current strength of the major currencies in several timeframes allowing you to sort the currencies for strength and spot possible trading setups. This indicator is ideal for scalping and in all those events of sudden big moves. This DEMO only shows 4 currencies and 4 timeframes, for the full version please check https://www.mql5.com/en/market/product/24252 How does it work? The CSM compares the value of the current moving av
FREE
Hidden V0lume
Christian Ricard
This indicator allows to hide Volume (on all MT4 timeframes) from a date define by the user with a vertical line (Alone) or a panel (with "Hidden Candles").  The color of each bar depends if this one is higher or lower of the previous bar. Indicator Inputs: No inputs for this indicator Information on "Volume" indicator is available in this post:   https://www.mql5.com/en/forum/134260 ************************************************************* Hey traders!!  Give me your feeds!  We are a commun
FREE
Basic Theme Builder
Mehran Sepah Mansoor
5 (1)
Basic Theme Builder: 차트 맞춤화를 간편하게 Basic Theme Builder   지표로 거래 경험을 혁신하세요. 이 다용도 도구는 MetaTrader 4 에서 차트의 외관을 간편하게 사용자 맞춤화할 수 있도록 설계된 직관적인 패널을 제공합니다. 다양한 테마와 색상 스킴을 간단히 전환하여 거래 환경의 시각적 매력과 기능성을 향상시킬 수 있습니다.   Free MT5 version Basic Theme Builder   지표는 MetaTrader 4 차트를 손쉽게 개인화하려는 거래자에게 최적의 도구입니다. 간단한 패널 인터페이스와 다양한 테마 프리셋을 통해 거래 스타일이나 기분에 맞게 차트의 외관을 빠르게 조정할 수 있습니다. 클래식한 룩부터 현대적인 미학까지, Basic Theme Builder는 시각적 경험을 향상시키고 집중력을 높이는 데 도움이 되는 다양한 옵션을 제공합니다. 오늘 이 실용적이고 사용하기 쉬운 지표로 거래 환경을 최적화하세요. 주요 기능: 간편
FREE
This indicator will turn the colors of your candles into a trend oriented colored showing 4 different colors based on two moving averages and the slope of the slow moving average. very powerful indicator for all periods of time showing you the direction of the trend to confirm your trades. Green: Bullish Dark Green: Bullish Weak Light red: Bearish Weak Red: Bearish  For more info: https://linktr.ee/trader_1st
FREE
이 제품의 구매자들이 또한 구매함
Gann Made Easy
Oleg Rodin
4.85 (82)
Gann Made Easy 는 mr.의 이론을 사용하여 최고의 거래 원칙을 기반으로 하는 전문적이고 사용하기 쉬운 Forex 거래 시스템입니다. W.D. 간. 이 표시기는 Stop Loss 및 Take Profit Levels를 포함하여 정확한 BUY 및 SELL 신호를 제공합니다. PUSH 알림을 사용하여 이동 중에도 거래할 수 있습니다. 구매 후 연락주세요! 내 거래 팁과 훌륭한 보너스 지표를 무료로 공유하겠습니다! 아마도 Gann 거래 방법에 대해 이미 여러 번 들었을 것입니다. 일반적으로 Gann의 이론은 초보자 거래자뿐만 아니라 이미 거래 경험이 있는 사람들에게도 매우 복잡한 것입니다. Gann의 거래 방식은 이론적으로 적용하기 쉽지 않기 때문입니다. 나는 그 지식을 연마하고 Forex 지표에 최고의 원칙을 적용하기 위해 몇 년을 보냈습니다. 표시기는 적용하기가 매우 쉽습니다. 차트에 첨부하고 간단한 거래 권장 사항을 따르기만 하면 됩니다. 지표는 지속적으로 시장 분석 작업
- Real price is 80$ - 40% Discount ( It is 49$ now ) Contact me for instruction, add group and any questions! Related Product:  Bitcoin Expert , Gold Expert Introduction The breakout and retest strategy is traded support and resistance levels. it involves price breaking through a previous level.  The break and retest strategy is designed to help traders do two main things, the first is to avoid false breakouts. Many false breakouts start with a candlestick that breaks out of a level but ends wi
Atomic Analyst
Issam Kassas
5 (2)
우선적으로 언급할 점은이 거래 지표가 다시 그리지 않고 지연되지 않으며 이를 통해 수동 및 로봇 거래 모두에 이상적이라는 점입니다. 사용자 매뉴얼: 설정, 입력 및 전략. Atomic Analyst는 가격의 강도와 모멘텀을 활용하여 시장에서 더 나은 이점을 찾는 PA Price Action Indicator입니다. 고급 필터를 장착하여 잡음과 거짓 신호를 제거하고 거래 잠재력을 높이는 데 도움이 됩니다. 복잡한 지표의 다중 레이어를 사용하여 Atomic Analyst는 차트를 스캔하고 복잡한 수학적 계산을 간단한 신호와 색상으로 변환하여 초보 트레이더가 이해하고 일관된 거래 결정을 내릴 수 있도록합니다. "Atomic Analyst"는 새로운 및 경험이 풍부한 트레이더를위한 종합적인 거래 솔루션입니다. 프리미엄 지표와 최고 수준의 기능을 하나의 거래 전략에 결합하여 모든 종류의 트레이더에 대한 다재다능한 선택지가되었습니다. 인트라데이 거래 및 스캘핑 전략 : 빠르고 정확한
Scalper Inside PRO
Alexey Minkov
4.73 (56)
An exclusive indicator that utilizes an innovative algorithm to swiftly and accurately determine the market trend. The indicator automatically calculates opening, closing, and profit levels, providing detailed trading statistics. With these features, you can choose the most appropriate trading instrument for the current market conditions. Additionally, you can easily integrate your own arrow indicators into Scalper Inside Pro to quickly evaluate their statistics and profitability. Scalper Inside
Gold Stuff
Vasiliy Strukov
4.89 (239)
Gold Stuff는 금을 위해 특별히 설계된 추세 지표이며 모든 금융 상품에서도 사용할 수 있습니다. 표시기가 다시 그려지지 않고 지연되지 않습니다. 권장 기간 H1. 표시기에서 완전 자동 Expert Advisor EA Gold Stuff를 작동합니다. 내 프로필에서 찾을 수 있습니다. 설정 및 개인 보너스를 받으려면 구매 후 즉시 저에게 연락하십시오!   강력한 지원 및 트렌드 스캐너 표시기의 무료 사본을 받으실 수 있습니다. 메시지를 보내주세요. 나!   설정 화살표 그리기 - 켜기 끄기. 차트에 화살표 그리기. 경고 - 가청 경고를 끕니다. 이메일 알림 - 켜기 끄기. 이메일 알림. Puch-notification - 켜기 끄기. 푸시 알림. 다음으로 색 영역을 조정합니다. Gold Stuff는 금을 위해 특별히 설계된 추세 지표이며 모든 금융 상품에서도 사용할 수 있습니다. 표시기가 다시 그려지지 않고 지연되지 않습니다. 권장 기간 H1. 표시기에서 완
현재 20% 할인 ! 초보자 또는 전문가 트레이더를 위한 최고의 솔루션! 이 대시보드 소프트웨어는 28개의 통화 쌍에서 작동합니다. 2가지 주요 지표(Advanced Currency Strength 28 및 Advanced Currency Impulse)를 기반으로 합니다. 전체 Forex 시장에 대한 훌륭한 개요를 제공합니다. 고급 통화 강도 값, 통화 이동 속도 및 모든(9) 시간대의 28 Forex 쌍에 대한 신호를 보여줍니다. 추세 및/또는 스캘핑 기회를 정확히 파악하기 위해 차트의 단일 지표를 사용하여 전체 시장을 볼 수 있을 때 거래가 어떻게 개선될지 상상해 보십시오! 잠재적인 거래를 식별하고 확인하면서 강력한 통화와 약한 통화를 더욱 쉽게 식별할 수 있도록 이 지표에 기능을 내장했습니다. 이 표시기는 통화의 강세 또는 약세가 증가 또는 감소하는지 여부와 모든 시간대에서 수행되는 방식을 그래픽으로 보여줍니다. 추가된 새로운 기능은 현재 시장 조건 변화에 적
Enigmera
Ivan Stefanov
5 (3)
에니메라: 시장의 핵심 https://www.enigmera.com 소개 이 지표 및 트레이딩 시스템은 금융 시장에 대한 놀라운 접근 방식입니다. 에니메라는 프랙탈 주기를 사용하여 지지선과 저항선을 정확하게 계산합니다. 진정한 축적 단계를 보여주고 방향과 목표를 제시합니다.  추세에 있든 조정에 있든 작동하는 시스템입니다.  어떻게 작동하나요? 에니메라는 지지선/저항선, 목표선, 편차선의 세 가지 라인으로 구성됩니다. 이 시스템은 과거 데이터를 현재와 미래로 추정하는 일반적인 시장 지표와 달리 현재에 대한 완전한 그림을 제공합니다. 지지선 위에 있으면 실제 지지를 의미하고 저항선 위에 있으면 실제 저항을 의미합니다. 레벨이 깨지면 추세의 변화를 나타냅니다. 다시 그리지 않습니다. 시장이 지속적으로 진화함에 따라 에니메라는 평가 도구를 조정하여 전략을 정기적으로 수정합니다.   이를 통해 모든 시나리오를 철저히 평가할 수 있습니다. 이 시장 지표의 고유성은 분명하며 그 기
TPSproTREND PrO
Roman Podpora
4.79 (19)
TPSpro TREND PRO는   시장을 자동으로 분석하여 추세와 각 변화에 대한 정보를 제공할 뿐만 아니라 다시 그리지 않고도 거래에 진입할 수 있는 신호를 제공하는 추세 지표입니다! 지표는 각 양초를 사용하여 개별적으로 분석합니다. 다른 임펄스를 언급합니다 - 업 또는 다운 임펄스. 통화, 암호화폐, 금속, 주식, 지수 거래의 정확한 진입점! 버전 MT5                   표시기에 대한 전체 설명       표시기   와 함께 사용하는 것이 좋습니다   -   RFI LEVELS 주요 기능: 렌더링 없이 정확한 입력 신호! 신호가 나타나면 관련성은 유지됩니다! 이는 신호를 제공한 후 변경하여 예금 자금 손실을 초래할 수 있는 다시 그리기 지표와의 중요한 차이점입니다. 이제 더 큰 확률과 정확도로 시장에 진입할 수 있습니다. 화살표가 나타난 후 목표에 도달(이익실현)하거나 반전 신호가 나타날 때까지 캔들을 색칠하는 기능도 있습니다. STOP LOSS / TAK
Dynamic Forex28 Navigator - 차세대 외환 거래 도구. 현재 49% 할인. Dynamic Forex28 Navigator는 오랫동안 인기 있는 지표의 진화형으로, 세 가지의 힘을 하나로 결합했습니다. 고급 통화 Strength28 지표(695개 리뷰) + 고급 통화 IMPULSE with ALERT(520개 리뷰) + CS28 콤보 신호(보너스). 지표에 대한 자세한 정보 https://www.mql5.com/en/blogs/post/758844 차세대 Strength 지표는 무엇을 제공합니까?  원래 지표에서 좋아했던 모든 것이 새로운 기능과 더 높은 정확도로 강화되었습니다. 주요 기능: 독점적인 통화 Strength 공식.  모든 시간대에 걸쳐 부드럽고 정확한 강도선. 추세와 정확한 진입을 식별하는 데 이상적입니다. 역동적인 시장 피보나치 수준(시장 피보나치).  이 지표에만 있는 고유한 기능. 가격 차트가 아닌 통화 강도에 피보나치가 적용
Trend Punch
Mohamed Hassan
4.95 (19)
This indicator is unstoppable when combined with our other indicator called  Support & Resistance . After purchase, send us a message and you will get it   for  FREE as a BONUS! Introducing Trend Punch , the revolutionary forex trend indicator that will transform the way you trade! Trend Punch is uniquely designed to provide precise buy and sell arrows during strong market trends, making your trading decisions clearer and more confident. Whether you're trading major currency pairs or exotic sym
Trend Screener
STE S.S.COMPANY
4.8 (87)
트렌드 표시기, 트렌드 트레이딩 및 필터링을 위한 획기적인 고유 솔루션, 하나의 도구 안에 내장된 모든 중요한 트렌드 기능! Forex, 상품, 암호 화폐, 지수 및 주식과 같은 모든 기호/도구에 사용할 수 있는 100% 다시 칠하지 않는 다중 시간 프레임 및 다중 통화 표시기입니다. 기간 한정 특가: 지원 및 저항 스크리너 지표는 단 100달러에 평생 제공됩니다. (원래 가격 50 달러) (제안 연장) Trend Screener는 차트에 점이 있는 화살표 추세 신호를 제공하는 효율적인 지표 추세 추종 지표입니다. 추세 분석기 표시기에서 사용할 수 있는 기능: 1. 트렌드 스캐너. 2. 최대 이익 분석이 있는 추세선. 3. 추세 통화 강도 측정기. 4. 경고가 있는 추세 반전 점. 5. 경고가 있는 강력한 추세 점. 6. 추세 화살표 Trend Screener Indicator가 있는 일일 분석 예, 일일 신호 성능...등은 여기에서 찾을 수 있습니다.   여기를 클릭하십시오.
FX Volume
Daniel Stein
4.58 (33)
모닝 브리핑을 통해 세부 정보와 스크린샷으로 매일 시장 업데이트를 받으세요 여기 mql5 및 텔레그램에서 FX 거래량은 브로커의 관점에서 시장 심리에 대한 실제 통찰력을 제공하는 최초이자 유일한 거래량 지표입니다. 브로커와 같은 기관 시장 참여자가 외환 시장에서 어떤 포지션을 취하고 있는지에 대한 훌륭한 통찰력을 COT 보고서보다 훨씬 빠르게 제공합니다. 차트에서 이 정보를 직접 확인하는 것은 트레이딩의 진정한 판도를 바꾸고 획기적인 솔루션입니다. 다음과 같은 고유한 시장 데이터 인사이트의 이점 비율 는 통화의 매수/매도 포지션 비율을 백분율로 표시 비율 변화 는 선택한 기간 내 매수 비율과 비율 변화를 표시 총 거래량 는 해당 통화의 총 거래량(롱 및 숏)을 로트 단위로 보여줍니다 Volumes Long 는 해당 통화의 모든 롱 포지션의 거래량을 보여줍니다 Volumes Short 는 해당 통화의 모든 숏 포지션의 거래량을 보여줍니다 Net Long 는 순 롱 포지션의 거래량
TPSpro RFI Levels
Roman Podpora
4.82 (22)
지침         러시아   -        영어       표시기와 함께 사용하는 것이 좋습니다   .       -       TPSpro   트렌드 프로 -   MT4 버전         거래에서 핵심 요소는 거래 상품을 매수 또는 매도하기로 결정하는 구역 또는 수준입니다. 주요 업체가 시장에서 자신의 존재를 숨기려는 시도에도 불구하고, 그들은 필연적으로 흔적을 남깁니다. 우리의 과제는 이러한 흔적을 식별하고 올바르게 해석하는 방법을 배우는 것이었습니다. 주요 기능:: 판매자와 구매자를 위한 활성 영역을 표시합니다! 이 지표는 매수 및 매도를 위한 모든 올바른 초기 임펄스 레벨/존을 보여줍니다. 진입점 검색이 시작되는 이러한 레벨/존이 활성화되면 레벨의 색상이 바뀌고 특정 음영으로 채워집니다. 또한 상황을 보다 직관적으로 이해하기 위해 화살표가 나타납니다. 더 높은 시간대의 레벨/존 표시(MTF 모드) 더 높은 시간 간격을 사용하여 레벨/존을 표시하는 기능을 추가했습니다.
FX Power MT4 NG
Daniel Stein
5 (13)
모닝 브리핑 여기 mql5 와 텔레그램에서 FX Power MT4 NG 는 오랫동안 인기 있는 통화 강도 측정기인 FX Power의 차세대 버전입니다. 이 차세대 강도 측정기는 무엇을 제공합니까? 기존 FX Power에서 좋아했던 모든 것 PLUS GOLD/XAU 강도 분석 더욱 정밀한 계산 결과 개별 구성 가능한 분석 기간 더 나은 성능을 위한 사용자 정의 가능한 계산 한도 특별 멀티더 많은 것을보고 싶은 사람들을위한 특별한 다중 인스턴스 설정 모든 차트에서 좋아하는 색상을위한 끝없는 그래픽 설정 수많은 알림 옵션, 중요한 것을 다시는 놓치지 않도록 Windows 11 및 macOS 스타일의 둥근 모서리가 있는 새로운 디자인 마법처럼 움직이는 인디케이터 패널 FX 파워 키 특징 모든 주요 통화의 완전한 강세 이력 모든 시간대에 걸친 통화 강세 이력 모든 브로커 및 차트에서 고유 계산 결과 100% 신뢰할 수있는 실시간100 % 신뢰할 수있는 실시간 계산-> 다시 칠하지 않음
우선적으로, 이 거래 도구는 전문적인 거래에 이상적인 비-다시 그리기 및 지연되지 않는 지표입니다.  온라인 강좌, 사용자 매뉴얼 및 데모. 스마트 가격 액션 컨셉트 인디케이터는 신규 및 경험 많은 트레이더 모두에게 매우 강력한 도구입니다. Inner Circle Trader Analysis 및 Smart Money Concepts Trading Strategies와 같은 고급 거래 아이디어를 결합하여 20가지 이상의 유용한 지표를 하나로 결합합니다. 이 인디케이터는 스마트 머니 컨셉트에 중점을 두어 대형 기관의 거래 방식을 제공하고 이동을 예측하는 데 도움을 줍니다.  특히 유동성 분석에 뛰어나 기관이 어떻게 거래하는지 이해하는 데 도움을 줍니다. 시장 트렌드를 예측하고 가격 변동을 신중하게 분석하는 데 탁월합니다. 귀하의 거래를 기관 전략에 맞추어 시장의 동향에 대해 더 정확한 예측을 할 수 있습니다. 이 인디케이터는 시장 구조를 분석하고 중요한 주문 블록을 식별하고 다양한
MetaTrader 4용 Ultimate Gold Advisor Ultimate Gold Advisor는 MetaTrader 4에서 거래 경험을 최적화하도록 설계된 고급 기술 도구입니다. 경험 많은 거래자의 요구를 충족하기 위해 개발된 이 지표는 정밀성, 정교한 분석 및 다기능성을 결합하여 정보에 입각한 거래 결정을 내리는 데 도움을 줍니다. 금 거래에 이상적이지만 다양한 자산에 적용 가능하며, Ultimate Gold Advisor는 시장 전략을 향상시키는 데 도움을 줄 수 있습니다. Ultimate Gold Advisor가 거래자에게 훌륭한 도구인 이유는 무엇입니까? 고급 성능: 각 거래 결과를 차트에 명확하게 표시하는 지표들의 조합으로 전략 성과를 투명하게 볼 수 있습니다. 이를 통해 접근 방식을 개선하고 더 정보에 입각한 결정을 내릴 수 있습니다. 즉각적이고 시각적인 거래 신호: 차트에 빨간색과 파란색 화살표가 표시되어 매수 및 매도 기회를 신호합니다. 이러한 시각적 신호는
M1 Gold
Abdulkarim Karazon
Stratos Pali
Michela Russo
5 (1)
Stratos Pali Indicator   is a revolutionary tool designed to enhance your trading strategy by accurately identifying market trends. This sophisticated indicator uses a unique algorithm to generate a complete histogram, which records when the trend is Long or Short. When a trend reversal occurs, an arrow appears, indicating the new direction of the trend. Important Information Revealed Leave a review and contact me via mql5 message to receive My Top 5 set files for Stratos Pali at no cost! D
Legacy of Gann
Pavel Zamoshnikov
4.83 (12)
The indicator very accurately determines the levels of the possible end of the trend and profit fixing. The method of determining levels is based on the ideas of W.D.Gann, using an algorithm developed by his follower Kirill Borovsky. Extremely high reliability of reaching levels (according to K. Borovsky  - 80-90%) Indispensable for any trading strategy – every trader needs to determine the exit point from the market! Precisely determines targets on any timeframes and any instruments (forex, met
Gold Channel XAUUSD
Paulo Rocha
5 (2)
Gold Channel is a volatility-based indicator, developed with a specific timing algorithm for the XAUUSD pair, which consists of finding possible corrections in the market. This indicator shows two outer lines, an inner line (retracement line) and an arrow sign, where the theory of the channel is to help identify overbought and oversold conditions in the market. The market price will generally fall between the boundaries of the channel. If prices touch or move outside the channel it is a tra
Currency Strength Wizard
Oleg Rodin
4.93 (44)
통화 강도 마법사는 성공적인 거래를 위한 올인원 솔루션을 제공하는 매우 강력한 지표입니다. 표시기는 여러 시간 프레임의 모든 통화 데이터를 사용하여 이 또는 해당 외환 쌍의 힘을 계산합니다. 이 데이터는 특정 통화의 힘을 확인하는 데 사용할 수 있는 사용하기 쉬운 통화 지수 및 통화 전력선의 형태로 표시됩니다. 필요한 것은 거래하려는 차트에 표시기를 부착하는 것뿐입니다. 표시기는 거래하는 통화의 실제 강세를 보여줍니다. 지표는 또한 추세와 거래할 때 유리하게 사용할 수 있는 구매 및 판매 거래량 압력의 극한값을 보여줍니다. 지표는 또한 피보나치에 기반한 가능한 대상을 보여줍니다. 표시기는 PUSH 알림을 포함한 모든 유형의 알림을 제공합니다. 구매 후 연락주세요. 나는 당신과 거래 팁을 공유하고 당신에게 무료로 훌륭한 보너스 지표를 줄 것입니다! 나는 당신에게 행복하고 유익한 거래를 기원합니다!
GOLD Impulse with Alert
Bernhard Schweigert
4.56 (9)
이 지표는 Advanced Currency IMPULSE with ALERT  +   Currency Strength Exotics  의 2가지 제품의 슈퍼 조합입니다. 그것은 모든 시간 프레임에 대해 작동하며 8개의 주요 통화와 하나의 기호에 대한 강약의 충동을 그래픽으로 보여줍니다! 이 표시기는 금, 이국적인 쌍, 상품, 지수 또는 선물과 같은 기호에 대한 통화 강도 가속을 표시하는 데 특화되어 있습니다. 금, 은, 오일, DAX, US30, MXN, TRY, CNH 등의 진정한 통화 강도 가속(충동 또는 속도)을 표시하기 위해 9번째 줄에 모든 기호를 추가할 수 있습니다. 새로운 기본 알고리즘을 기반으로 구축되어 잠재적인 거래를 훨씬 더 쉽게 식별하고 확인할 수 있습니다. 이는 통화의 강세 또는 약세가 가속되는지 여부를 그래픽으로 표시하고 가속 속도를 측정하기 때문입니다. 자동차의 속도계처럼 생각하면 됩니다. 가속화할 때 Forex 시장에서 동일한 일이 분명히
Scalper Vault
Oleg Rodin
5 (27)
Scalper Vault 는 성공적인 스캘핑에 필요한 모든 것을 제공하는 전문 스캘핑 시스템입니다. 이 표시기는 외환 및 바이너리 옵션 거래자가 사용할 수 있는 완전한 거래 시스템입니다. 권장 시간 프레임은 M5입니다. 시스템은 추세 방향으로 정확한 화살표 신호를 제공합니다. 또한 상단 및 하단 신호와 Gann 시장 수준을 제공합니다.  이 시스템은 사용하기가 매우 쉽습니다. 원하는 시장 지역의 화살표만 따라가면 됩니다. 엑시트는 가격이 적정 수준에 도달하거나 시장의 고점 또는 저점 신호가 나타날 때 수행됩니다.  표시기는 PUSH 알림을 포함한 모든 유형의 경고를 제공합니다. 인디케이터 구매 후 연락주세요. 내 개인 거래 권장 사항과 훌륭한 보너스 지표를 무료로 공유합니다! 나는 당신에게 행복하고 유익한 거래를 기원합니다!
Market Structure
Reza Aghajanpour
4.85 (26)
** All Symbols x All Timeframes scan just by pressing scanner button ** *** Contact me  to send you instruction and add you in "Market Structure group" for sharing or seeing experiences with other users. Introduction: Market structure is important for both new and professional traders since it can influence the liquidity and price action of a market (Breakout and Retest). It’s also one of the most commonly used techniques to understand trends, identify potential reversal points, and get a feel f
Matrix Arrow Indicator MT4
Juvenille Emperor Limited
5 (3)
매트릭스 화살표 표시기 MT4 는 외환, 상품, 암호 화폐, 지수, 주식과 같은 모든 기호/도구에 사용할 수 있는 100% 다시 칠하지 않는 다중 기간 표시기를 따르는 고유한 10 in 1 추세입니다.  Matrix Arrow Indicator MT4 는 다음과 같은 최대 10개의 표준 지표에서 정보와 데이터를 수집하여 초기 단계에서 현재 추세를 결정합니다. 평균 방향 이동 지수(ADX) 상품 채널 지수(CCI) 클래식 하이켄 아시 캔들 이동 평균 이동 평균 수렴 발산(MACD) 상대 활력 지수(RVI) 상대 강도 지수(RSI) 포물선 SAR 스토캐스틱 오실레이터 윌리엄스의 백분율 범위 모든 지표가 유효한 매수 또는 매도 신호를 제공하면 강력한 상승/하락 추세를 나타내는 다음 캔들/막대가 시작될 때 해당 화살표가 차트에 인쇄됩니다. 사용자는 사용할 표시기를 선택하고 각 표시기의 매개변수를 개별적으로 조정할 수 있습니다. 매트릭스 화살표 표시기 MT4는 선택한 표시기에서만 정보를 수
IX Power MT4
Daniel Stein
5 (5)
IX Power는 마침내 FX Power의 탁월한 정밀도를 외환이 아닌 기호에도 적용했습니다. 좋아하는 지수, 주식, 원자재, ETF, 심지어 암호화폐까지 단기, 중기, 장기 추세의 강도를 정확하게 파악할 수 있습니다. 단말기가 제공하는 모든 것을 분석할 수 있습니다. 사용해 보고 트레이딩 타이밍이 크게 향상되는 것을 경험해 보세요. IX Power 주요 특징 단말기에서 사용 가능한 모든 거래 심볼에 대해 100% 정확한 비재도장 계산 결과 제공 사전 구성 및 추가적으로 개별 구성 가능한 강도 분석 기간의 드롭다운 선택 가능 이메일, 메시지, 모바일 알림을 통한 다양한 알림 옵션 제공 EA 요청을 위한 액세스 가능한 버퍼 더 나은 성능을 위한 사용자 지정 가능한 계산 한도 더 많은 것을 보고 싶은 사용자를 위한 특별 다중 인스턴스 설정 모든 차트에서 좋아하는 색상을 위한 무한한 그래픽 설정 가능 Windows 11 및 macOS 스타일의 둥근 모서리를 가
Advanced Currency IMPULSE with ALERT
Bernhard Schweigert
4.9 (481)
현재 31% 할인!! 초보자 또는 전문가 트레이더를 위한 최고의 솔루션! 이 지표는 우리가 독점 기능과 비밀 공식을 통합했기 때문에 독특하고 고품질이며 저렴한 거래 도구입니다. 단 하나의 차트로 28개 통화 쌍 모두에 대한 경고를 제공합니다. 새로운 추세 또는 스캘핑 기회의 정확한 트리거 포인트를 정확히 찾아낼 수 있기 때문에 거래가 어떻게 개선될지 상상해 보십시오! 새로운 기본 알고리즘을 기반으로 구축되어 잠재적인 거래를 훨씬 더 쉽게 식별하고 확인할 수 있습니다. 이는 통화의 강세 또는 약세가 가속되는지 여부를 그래픽으로 표시하고 가속 속도를 측정하기 때문입니다. 자동차의 속도계처럼 생각하면 됩니다. 가속화할 때 Forex 시장에서 동일한 일이 분명히 더 빠르게 발생합니다. 즉, 반대 방향으로 가속화되는 통화를 페어링하면 잠재적으로 수익성 있는 거래를 식별한 것입니다. 통화 모멘텀의 수직선과 화살표가 거래를 안내합니다! 역동적인 Market Fibonacci 23
Chart Patterns All in One
Davit Beridze
4.25 (8)
구매 후 댓글을 남기시면 고품질의 인디케이터 4개를 보너스로 받으실 수 있습니다. Chart Patterns All-in-One 지표는 트레이더가 기술 분석에서 흔히 사용되는 다양한 차트 패턴을 시각화하는 데 도움을 줍니다. 이 지표는 잠재적인 시장 움직임을 식별하는 데 도움이 되지만, 수익성을 보장하지는 않습니다. 구매 전에 데모 모드에서 지표를 테스트하는 것이 좋습니다. 현재 할인 : "Chart Patterns All in One" 지표 50% 할인 중. 포함된 패턴 : 1-2-3 패턴 : 세 가지 주요 지점(고점 또는 저점)을 사용하여 시장 반전을 감지합니다. 매수 : 연속된 두 저점 이후, 이전 고점보다 낮은 고점이 발생할 때. 매도 : 연속된 두 고점 이후, 이전 저점보다 높은 저점이 발생할 때. 시각화 : 선과 화살표가 감지된 지점을 연결합니다. 더블 탑과 더블 바텀 : 가격이 두 개의 연속된 고점(더블 탑) 또는 저점(더블 바텀)을 형성할 때, 반전의 가능성을 나타냅니
Market Reversal Alerts
LEE SAMSON
4.19 (113)
가격이 역전되고 후퇴함에 따라 시장 구조가 변경됩니다. 시장 구조 반전 경고 표시기는 추세 또는 가격 움직임이 고갈에 가까워지고 반전할 준비가 되었음을 식별합니다. 일반적으로 반전이나 큰 하락이 일어나려고 할 때 발생하는 시장 구조의 변화를 알려줍니다. 지표는 가능한 고갈 지점 근처에서 새로운 고점 또는 저점이 형성될 때마다 초기에 돌파와 가격 모멘텀을 식별합니다. 표시기는 반대쪽에 있는 마지막 촛불에 직사각형을 그립니다. 그런 다음 현재의 단기 추세에서 계속 움직이기 때문에 가격과 함께 직사각형을 따라갈 것입니다. 가격이 사각형 위나 아래로 다시 닫힐 정도로 약해지면 시장 구조에 잠재적인 변화가 일어나고 있음을 나타냅니다. 그런 다음 표시기는 방향의 잠재적인 이동과 추세 또는 주요 하락의 가능한 반전 시작에 대해 경고합니다. 작동 방식을 보려면 아래의 작동 표시기를 참조하십시오! 여기에서 모든 쌍 및 기간을 모니터링하기 위한 선택적 대시보드 추가 기능: https://
Blahtech Supply Demand
Blahtech Limited
4.61 (33)
Was: $299  Now: $99   Supply Demand uses previous price action to identify potential imbalances between buyers and sellers. The key is to identify the better odds zones, not just the untouched ones. Blahtech Supply Demand indicator delivers functionality previously unavailable on any trading platform. This 4-in-1 indicator not only highlights the higher probability zones using a multi-criteria strength engine, but also combines it with multi-timeframe trend analysis, previously confirmed swings
제작자의 제품 더 보기
VWAP Intraday Free
Joaquin Nicolas Metayer
4.75 (4)
The volume weighted average price (VWAP) is a trading benchmark used by traders that gives the average price a security has traded at throughout the day, based on both volume and price. VWAP is calculated by adding up the dollars traded for every transaction (price multiplied by the number of shares traded) and then dividing by the total shares traded. You can see more of my publications here: https://www.mql5.com/en/users/joaquinmetayer/seller
FREE
Auto Stop Trail And Profit
Joaquin Nicolas Metayer
5 (1)
Auto Stop Trail And Profit is an expert advisor that monitors orders, when it detects that one has been placed, on the same chart that has been activated or on all assets, depending on its configuration, it will place its respective stop loss, take profit and perform trail stop loss (in a classic way, keeping a distance or "step by step"). You can see more of my products here: www.mql5.com/en/users/joaquinmetayer/seller
FREE
StochRSI
Joaquin Nicolas Metayer
5 (1)
The   Stochastic RSI   indicator (StochRSI) is essentially an indicator of an indicator. It is used in technical analysis to provide a stochastic calculation to the RSI indicator. This means that it is a measure of RSI relative to its own high/low range over a user defined period of time. The Stochastic RSI is an oscillator that calculates a value between 0 and 1 which is then plotted as a line. This indicator is primarily used for identifying overbought and oversold conditions.
FREE
Stop and Reverse Martingale EA
Joaquin Nicolas Metayer
4 (1)
Stop and Reverse Martingale EA is an expert advisor that integrates the following inputs within it: Start lot size Lot multiplier Take profit distance in points Take profit distance in points *this input is a stop loss, is misspelled within the code of the EA Magic number A and B Start cycle with round number The distance of round number  Daily maximum orders per cycle and close all Daily loss (maximum orders per cycle when this last order hit the stop loss the EA close all orders in the same m
FREE
Nermal Round Levels
Joaquin Nicolas Metayer
5 (2)
Nermal Round Levels is an indicator of round numbers in the form of a grid drawing horizontal lines. You can use it in many ways ... as it could be activating for an expert advisor to enter the market, confirmation of entry for your strategy, entrance area, mark areas of important levels, possible rebounds and others. Place it in your chart and verify as the price respects those round levels. Inputs GridSpace linecolor lineStyle
FREE
Reverse Buttoms
Joaquin Nicolas Metayer
Tired of losing and never winning? It has never crossed your mind that if you did everything backwards you would always win, but when you see the orders, or accept that "you put an operation on the contrary" you can't do it right? Here is the solution if you are an expert in losing like me. A panel of buttons... when you press buy it opens a sell and when you press sell it opens a buy. Clever right? Let's see if that's how we become profitable! You can download more of my products here:
FREE
Recovery Zone Assistance, as its name says ... It is an assistant, an expert advisor that monitors all the orders for the asset in which it has been placed, no matter if that order was by some other expert advisor or by the trader placed on the Manually, he will start his work after each order that is negative. This Expert Advisor is based on this sistem on video "Recovery Zone" on https://www.youtube.com/watch?v=DJz4E7VyeSw. See more products on:  https://www.mql5.com/en/users/joaquinmetayer
FREE
One Click Close All is a script that when thrown on any chart will automatically close all orders regardless of the asset or what type of orders they are, it will close everything much faster than a human could. You will find paid versions of the same style of this script, but read carefully and you will see that it performs the same function ... here you have it for free, enjoy it.
FREE
Odie Trade Manager
Joaquin Nicolas Metayer
Odie Trade Manager EA is a simple semi-automatic (two in one) assistant for a manual trader, when having a losing trade the EA begins its work in the form of a martingale or hedging (recovery zone) to leave it in breakeven or positive, it depends on its configuration. For professional traders and gamblers . Adapt it to your strategy, MANAGE YOUR RISK CORRECTLY  and all your operations will be positive. TEST ON STRATEGY TESTER WITH YOU STRATEGY AND CREATE YOUR SET FILE AND...  GOODBYE LOSS
FREE
Martingale Assistance
Joaquin Nicolas Metayer
3 (1)
Martingala Assistance, as its name says ... It is an assistant, an expert advisor that monitors all the orders for the asset in which it has been placed, no matter if that order was by some other expert advisor or by the trader placed on the Manually, he will start his work after each order that is negative. See more products on:  https://www.mql5.com/en/users/joaquinmetayer/seller .
FREE
Show the account information on the chart, change the color automatically depending on the background, it adjusts to each chart and is updated every time the price moves a tick, that's why it is an expert advisor even if it is used as an indicator. Cannot change size. You can see my other products here: https://www.mql5.com/en/users/joaquinmetayer/seller
FREE
Retxed EA
Joaquin Nicolas Metayer
This expert advisor is a reverse version of the operation of "Dexter EA" ( https://www.mql5.com/en/market/product/67307 ) which works with the martingale method ... therefore it works in the opposite way. For each positive order, it will open one in the same direction with its respective increase in volume if the trader so wishes, on the side of negative orders, its lot will not increase. Inputs Lot size Multiplier  First order stop loss Profit distance to place a stop limit order  Revert ave
FREE
Simple Strategy Checklist Panel
Joaquin Nicolas Metayer
4 (1)
Simple Strategy Checklist Panel, as its name suggests, is a panel that works as a checklist, and can place up to twenty lines of text. This was created for traders who want to have their trading plan or to-do list at hand, a simple but useful product for many. I will write this pointless paragraph since Metatrader asks me to put a minimum of 6300 characters, so I also explain that the list can also be used to make purchases from the supermarket! Example bread, milk, flour and much more... Enj
FREE
Reverse Hedging EA
Joaquin Nicolas Metayer
This EA is literally a reverse of Recovery Zone Assistance, as its name says ... It is an assistant, an expert advisor that monitors all the orders for the asset in which it has been placed, no matter if that order was by some other expert advisor or by the trader placed on the Manually, he will start his work after each order that is negative. Find  Recovery Zone Assistance on  https://www.mql5.com/en/market/product/68909 This Expert Advisor is based on this sistem on video "Recovery Zone" on
FREE
Minimal MT5 to Discord
Joaquin Nicolas Metayer
Send signals to your Discord channel in a simple way. Enjoy. All instructions on YouTube video, this don't need a large description. I add unnecessary text that Metatrader asks me for: Once upon a time, in a quaint little village, there lived a curious and adventurous young girl named Lily. Lily had big, bright eyes that sparkled with excitement, and she loved exploring the enchanted forest that bordered her home. One sunny morning, Lily decided to embark on a special advent
FREE
Close All Pendings
Joaquin Nicolas Metayer
Close All Pendings is a simple script that, when thrown on the graph, closes all pending orders that are open, ONLY pending orders, orders already open will not be closed, no matter in which pair it is thrown ... it will close all. It has no inputs, just throw it on the chart and it will run. You can see more of my products here: https://www.mql5.com/en/users/joaquinmetayer/seller
FREE
Patrick Loquema EA
Joaquin Nicolas Metayer
Patrick Loquema is a fully automatic robot, entering the market randomly will always remain with a sell order and another open buy order ... he uses a system similar to martingale, only without keeping open orders, but increasing the volume by multiplying by 1.5 for each new losing order until it closes positively. The only parameters to be changed by the user is the initial lot, of course ... and “Stopp Distance”. Now you ask yourself, and take profit? double the stop ... And what is the multi
FREE
Simply Trailing Stop EA
Joaquin Nicolas Metayer
Simply Trailing Stop is a simple Expert Advisor that automatically trails stop on the chart that has been activated. It can be used as a complement to orders placed manually or through another expert advisor that does not perform a trailing stop, you only have to activate it in a new chart, not in the same one in which you already have your expert advisor but it will not work. You can see more of my products here: www.mql5.com/en/users/joaquinmetayer/seller
FREE
PBE and Flash
Joaquin Nicolas Metayer
This is an expert advisor that works more like an indicator. Its functions are the following: - Print the balance and equity in Arial font size 40 (cannot be changed) - Change chart background and candle colors depending on the close of the previous candle and the current price level. Now... what is this for or what can I use it for? Good. Personally I use it to put it as the main chart while in other charts I leave other expert advisors working, what I care to see is the balance and equity
FREE
Minutes 51
Joaquin Nicolas Metayer
On the other hand, we denounce with righteous indignation and dislike men who are so beguiled and demoralized by the charms of pleasure of the moment, so blinded by desire, that they cannot foresee the pain and trouble that are bound to ensue; and equal blame belongs to those who fail in their duty through weakness of will, which is the same as saying through shrinking from toil and pain. These cases are perfectly simple and easy to distinguish. In a free hour, when our power of choice is untram
FREE
Dexter EA
Joaquin Nicolas Metayer
1 (1)
Dexter EA is a 100% automatic robot that executes random orders of simultaneous buys and sells. For each losing operation, a management with an increase in the lot will begin, better known as “martingale” that will cause the price to fall back to the area where it was established. the profit the robot closes in profit or breakeven, depends on its configuration. I catalog it as a utility even though it works totally automatic because EVERY TRADER'S WORK IS NEEDED to be able to make it work corre
FREE
Simply Parabolic SAR EA
Joaquin Nicolas Metayer
Simply Parabolic SAR EA is an expert advisor that places orders in favor of the trend changes of the "Parabolic Stop And Reverse" indicator, placing its take profit, stop loss and trailing stop. You can see more of my products here: https://www.mql5.com/en/users/joaquinmetayer/seller Inputs: Lots TakeProfit in points StopLoss in points TrailingStop distance in points Step PSAR Max PSAR
FREE
Garfield Equity Loss Closer is an expert advisor who will stay in control of the equity / float of the account, when the negative float reaches the amount defined from the inputs, he will close all existing orders. Only one input, it is the negative amount in the currency of your account that you must reach to start closing all positions. Its use is recommended for those expert advisors who use a volume increase system, either hedging (recovery zone) or martingale since sometimes without re
FREE
Arlene Sessions Backgrounds
Joaquin Nicolas Metayer
Arlene Sessions Background is an indicator that draws colored rectangles on the chart depending on your session, within the price range that has moved and when the sessions overlap, it will be painted in a color that will be the mixture of the colors of the respective sessions. You can see the version 2 here:  https://www.mql5.com/en/market/product/68934 Inputs NumberOfDays AsiaBegin AsiaEnd AsiaColor EurBegin EurEnd EurColor USABegin USAEnd USAColor If you only want to paint a session on yo
FREE
Server Time On Chart
Joaquin Nicolas Metayer
Server Time On Chart is a simple indicator that shows the time of the broker's server with hours, minutes and seconds in the lower left corner of the chart's. Within the inputs you can only change the size of the font and the color you want depending on your taste. You can see more of my publications here: https://www.mql5.com/en/users/joaquinmetayer/seller
FREE
필터:
리뷰 없음
리뷰 답변