• 미리보기
  • 리뷰 (3)
  • 코멘트 (5)
  • 새 소식

Abiroid Support Resistance Scanner

5
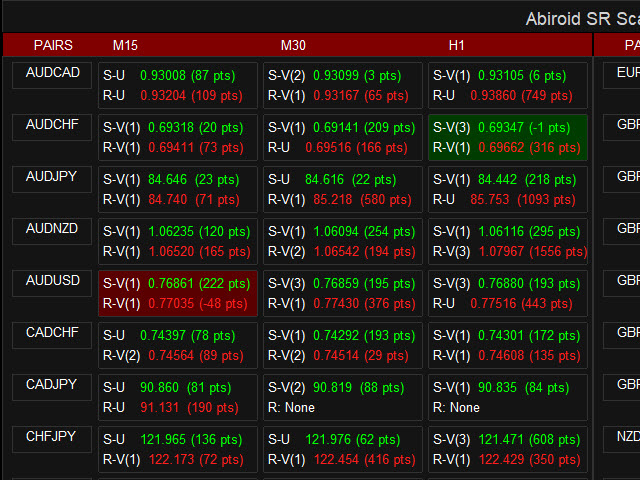
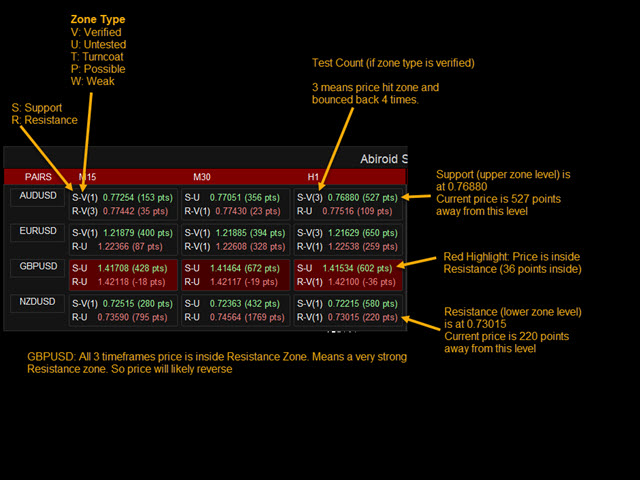
This is a Multi-currency multi-timeframe Support/Resistance Scanner Dashboard for Metatrader 4 (MT4) platform.


Get all extras and download free demo here:

https://abiroid.com/product/abiroid-support-resistance-scanner

Read detailed description in post above.


Features:

  • Scan Support/Resistance zones (also called Supply/Demand zones)
  • Show alert when price is inside these zones and highlights the pair/timeframe
  • Show or hide SR zones price nearest to current price (Price_Close)
  • Show or hide current price (Price_Close) distance in points from SR zones
  • Merge and Extend Zones Option
  • MA Filtering Alerts


리뷰 3
Tim Eubanks
5762
Tim Eubanks 2024.05.19 19:54 
 

Solid work, solid indicator!

Suvashish Halder
32754
Suvashish Halder 2021.11.08 08:23 
 

Very Good and Reliable Scanner. Thank you, Abir 😎

Hrishikesh Bhalchandra Kinikar
485
Hrishikesh Bhalchandra Kinikar 2021.06.25 20:15 
 

Exceptional scanner to find the best opportunities in the market. Support and Resistance is the main core of the market, this scanner finds correct zones without fail. Developer has done a wonderful job to make this difficult yet very important scanner work perfectly exceeding all exceptions........

추천 제품
Pivot Points MT4
KEENBASE SOFTWARE SOLUTIONS
KT Pivot Points automatically plots the daily, weekly, and monthly pivot levels on a chart with the precise calculation based on the latest data. Pivot points is a widely used indicator in technical analysis, particularly in the Forex market. Features Send alerts when the price touches the pivot level.  It offers complete customization for each kind of pivot level.   Shows daily, weekly, and monthly pivot levels without any fuss. It uses minimum CPU resources for faster calculation. Compati
VR Pivot
Vladimir Pastushak
VR Pivot is an indicator of key pivot points. Pivot points are a special type of support and resistance levels that are used to determine the strongest price zones. Professional traders use pivot levels to determine prices at which there is a high probability of a price reversal. The levels are calculated using special mathematical formulas, which include the closing, opening, high, and low prices of the previous time period. The most effective is the daily period. It is important to note that a
DashBoard Multi TimeFrame
Harikrishna Darapaneni
This indicator ( dashboard) provides trend for multi currency on multi timeframe Charts. It gives entries and Stoploss on the chart itself  if the currency pair is uptrend then the cell color is displayed as Green and if its downtrend the cell displays the color as Red Alerts are generated whenever the trend changes on that particular timeframe. can customize the time frames as desired
Indicator Support and Resistence plain in your chart seven lines; Red line=Resistence 3. Red line=Resistence 2. Red line=Resistence 1. Yellow line= Pivot. Green line= Support 1. Green line= Support 2. Green line= Support 3. adattable in all timeframe (minute 1, minute   5, minute   15, minute   30, Hour 1, Hour 4,Day 1,Week 1,Mounth 1); Buy under support and sell over the resistence;
The indicator allows to find consolidations. It is meant for channel breakthrough. Easy to use, it has only three parameters: Minimum number of bars to analyze Consolidation tunnel Indicator color It works on all timeframes . Approximate settings are adjusted for H1 by default. Works on all currency pairs. This indicator does not repaint and is not recalculated. All screenshots are real!
Pivot Pro
Igor Semyonov
Description Pivot Pro  is a universal color indicator of the  Pivot Points  levels systems. You can select one of its three versions:  Standard   Old , Standard New  and  Fibo . The system will automatically calculate the  Pivot Point  on the basis of market data for the previous day ( PERIOD_D1 ) and the system of support and resistance levels, three in each. It can also display price tags for each level. You can color the indicator lines. Only a method of calculation of the third level of supp
Support Resistance Tracking Indicator The Support Resistance Tracking Indicator is a technical analysis tool that helps traders identify and track support and resistance levels. It is a valuable tool for traders of all levels, from beginners to experienced professionals. How it works The Support Resistance Tracking Indicator uses a variety of methods to identify support and resistance levels. These methods include: Historical price action:   The indicator looks for price levels where the market
Diamond Trend
Segundo Calvo Munoz
Indicator which identifies Trend and also buy/sell opportunities. Use for entries aligned to the Trend.  Although Diamond Trend is very accurate identifying entry points, it is always recommended to use a support indicator in order to reconfirm the operation. Remind to look for those Assets and Timeframes which best fit to your trader behavior/need... Valid for Scalping and Long Term operations. Please, set up a Bars Chart to be able to visualize the indicator properly...  ...And remind to give
FiboZag
Andriy Sydoruk
Indicator FiboZag - transfer the indicator to the chart and the Fibonacci levels will be built automatically on the last ZigZag turn. The main advantage lies in the correct construction of Fibonacci levels and markup of price levels. Simple, visual and effective use. The indicator is not redrawn and does not lag. Works on all currency pairs and on all timeframes.
SR levels true mql4
Egidijus Bikulcius
5 (1)
Indicator SR levels true in small time frames is very useful for scalping while in bigger ones it is good for day or position trading. SR levels true can draw 4 support/resistance levels based on defined maximum rebouds from price level. Indicator scans  defined number of bars in time axis and defined number of pips in price axis (both sides - up and down) and calculates how much times price was rejected from scanned price levels. At the price levels where maximum rebounds are counted, support
FREE
F ully automated Expert Advisor using the  advanced   algorithm for trading the EURUSD Designed for profit in a short period of time and big profit in a long run. Prefers EURUSD 1H. Principle of operation The SELL and BUY orders are opened (depending on the parameters set), guided by signals and the market situation.     Recommended parameter: Use an ECN broker account. minimum deposit of 100$ USD. use it in H1 time frame recommended symbol is EURUSD input parameter: TrendType               
M W Pattern Pro
Noiros Tech
4.14 (7)
M & W Pattern Pro is an advanced scanner for M and W patters , it uses extra filters to ensure scanned patterns are profitable. The indicator can be used with all symbols and time frames. The indicator is a non repaint indicator with accurate statistics calculations. To use , simply scan the most profitable pair using the statistics dashboard accuracy , then enter trades on signal arrow and exit at the TP and SL levels. STATISTICS : Accuracy 1 : This is the percentage of the times price hit
KT Horizontal Lines MT4
KEENBASE SOFTWARE SOLUTIONS
In MetaTrader, plotting multiple   horizontal lines   and then tracking their respective price levels can be a hassle. This indicator automatically plots multiple horizontal lines at equal intervals for setting price alerts, plotting support and resistance levels, and other manual purposes. This indicator is suitable for Forex traders who are new and looking for chances to make quick profits from buying and selling. Horizontal lines can help traders find possible areas to start trading when the
Key level wedge pro
Presley Annais Tatenda Meck
5 (1)
We have combined all of our beloved indicators the likes of: Key level order block , Key level supply and demand , Key level liquidity grab and Key level wedge into one single indicator and dashboard. Whats new Dashboard : There is an easy access dashboard for all your needs. Multi-timeframe button : There is now a multi-timeframe option for Order Blocks and Supply and demand zones, making it easy to see higher timeframe zones easily on the current timeframe by just clicking the desired timefr
FxBears Super
Rachid Lafhil
The trading indicator FxBears Super That Conquers the Impossible     See last signals from FxBears Super indicator in the comments ==>    !!New Update at 25/08/2024:  Higher success rate, more than 98%. It gives the signal from the highest high in the wave, or from the lowest low in the wave.       The best of Forex Bears Company's products over the past 15 years.We aspire to perfection, and to reach a success rate of nearly 100% in the next update.
Provides instant signals on the chart in panel form. Equipped with signal description and trading analysis tools such as drawing auto trendlines, support/resistance area, regression channel, Fibonacci levels, Pivot levels and current signal price, signal time, signal expiry and stoploss recommendation. Also sending alert messages to all available mt4 alert tool. A detailed description panel provides information about where the signal comes from and what indicators are behind the signal. Includin
This indicator is designed based on Mr.   WD   Gann's square of nine methods. Using this indicator, we can enter the desired   pivot   price and, based on the coefficient we assign to it, extract 8   support and resistance   numbers with 8 angles of 45, 90, 135, 180, 225, 270, 315, and 360. Calculates 8   support and resistance   points and draws   support and resistance   lines. The coefficient is to triple the number of executions. To select   pivot points   in which a price is a lar
Trend Ray
Andriy Sydoruk
The indicator shows the potential trend direction by cyclical-wave dependence. Thus, all the rays of the intersection will be optimal rays, in the direction of which the price is expected to move, taking into account the indicator period. Rays can be used as a direction for potential market movement. But we must not forget that the approach must be comprehensive, the indicator signals require additional information to enter the market.
Angle Dashboard
Taras Slobodyanik
5 (1)
This is a multicurrency and multitimeframe indicator that calculates the angle between two points. Points for measuring the angle can be taken from the ZigZag (the last two points), or from the Moving Average (between two given bars), or it can be the closing prices of bars. Angle measurement is possible in degrees or in radians. You can select the scale for the calculation. For a better understanding of the indicator, you can study the free Angle High Low indicator. In the parameters you can
Fibonacci Magic Pivot Levels
Savia Forex Software Solutions
Fibonacci Magic Pivot Levels The  Fibonacci Magic Pivot Levels  is a  powerful yet easy to use indicator . It   continuously monitor s intra-day  price action  and uses complex algorithms to calculate and detect key support, resistance and pivot levels, using the D1 timeframe as a filter.  The    Fibonacci Magic Pivot Levels is optimized for H4, H1, M30, M15, M5 & M1 timeframes and  can be used on ALL Currencies, Indices, Commodities, and Cryptocurrency pairs . Trade with improved confidence an
Magic Pivot
Evgeny Belyaev
Magic Pivot is a professional indicator for finding the support and resistance lines; it has been developed by a group of professional traders. The indicator plots three support lines and three resistance lines, where a price reversal is highly probable. Magic Pivot is an excellent tool for scalping and intraday trading.   Advantages High accuracy of signals. Suitable for scalping and intraday trading. The indicator does not redraw. Simple indicator setup, minimum parameters. Works on any finan
MQLTA Support Resistance Lines is an indicator that calculates the historical levels of Support and Resistance and display them as Lines on chart. It will also Alert you if the price is in a Safe or Dangerous zone to trade and show you the distance to the next level. The indicator is ideal to be used in other Expert Advisor through the iCustom function. This DEMO only works with AUDNZD, the full product can be found at https://www.mql5.com/en/market/product/26328 How does it work? The indicato
FREE
VR Cub
Vladimir Pastushak
VR Cub 은 고품질 진입점을 얻는 지표입니다. 이 지표는 수학적 계산을 용이하게 하고 포지션 진입점 검색을 단순화하기 위해 개발되었습니다. 지표가 작성된 거래 전략은 수년 동안 그 효율성을 입증해 왔습니다. 거래 전략의 단순성은 초보 거래자라도 성공적으로 거래할 수 있다는 큰 장점입니다. VR Cub은 포지션 개시 지점과 이익 실현 및 손절매 목표 수준을 계산하여 효율성과 사용 편의성을 크게 높입니다. 간단한 거래 규칙을 이해하려면 아래 전략을 사용한 거래 스크린샷을 살펴보세요. 설정, 세트 파일, 데모 버전, 지침, 문제 해결 등은 다음에서 얻을 수 있습니다. [블로그] 다음에서 리뷰를 읽거나 작성할 수 있습니다. [링크] 버전 [MetaTrader 5] 진입점 계산 규칙 포지션 개설 진입점을 계산하려면 VR Cub 도구를 마지막 최고점에서 마지막 최저점까지 늘려야 합니다. 첫 번째 지점이 두 번째 지점보다 빠른 경우, 거래자는 막대가 중간선 위에서 마감될 때까지 기다립
Classical Divergence , Hidden Divergence both available . Enter a trade with the arrow on lower indicator. Nexus Divergence Pro is the best Divergence tool one can imagine with trade signals you will experience the super functionality. Needless to say how accurate divergence trading can be . Do your research on google you will understand its a standalone super accurate strategy.
Indicator can drawing Support Level (Lowest price of choosed Time Frame) and Resistance Level (Highest price of choosed Time Frame), and this indicator can drawing last of Pivot Level from the Last of Support Resistance Level. Support and Resistance based Highest and Lowest at choosed Time Frame can be your next good experience for your forex trade to maximize your trade win and lost ratio. Parameter : _S_and_R__Setup_ ,          Default is   # SUPPORT AND RESISTANT # , No Need To Change Drawi
An extended version of the indicator for visualizing the time ranges of key trading sessions: Asian, European and American. The main advantage of this indicator is the automatic construction of a price profile for a trading session. The indicator has the functionality to set the start and end time of each trading session, as well as automatically determine the time zone of the trading server. The indicators include the ability to work with minimal CPU usage and save RAM. In addition, the option
Resistance and support zones indicator
Jose Daniel Stromberg Martinez
This is a very complex indicator that calculates resistance and supportlevels. When the calculation is done, it merges levels that are close to eachother. It support different timeframes, simply by changing timeframe. Features: See support and resistance levels Alarm can be set off when price enters a support/resistance zone Different timeframes See screenshots for visual.
This is a new strategy for SUPPLY DEMAND areas It is based on a calculation using the tick volume to detect the big price action in market for both bear /bull actions this smart volume action candles are used to determine the supply and demand areas prices in between main supply and demand lines indicate sideway market  up arrows will be shown when prices moves above the main supply and the secondary supply lines Down arrows will be shown when prices moves below the main demand and the secondary
This is a Multi-Time-Frame Zigzag indicator You can change parameters of Zigzag, include Zigzag Depth, Zigzag Deviation, Zigzag Backstep. You can choose which Time Frame to display Zigzag by turn ShowXXX to true or false (ShowXXX = ShowM1, ShowM5, ShowM15...). Noted: Lower Time Frame Zigzag will not display on Higher Time Frame. Example: Your current Time Frame is H1, you can not see Zigzag of M1 to M30 even you turn them on.
This indicator is another variant of the famous powerful indicator Fibonacci-SS https://www.mql5.com/en/market/product/10136 but has different behaviour in placing Pending Order and TP Line. Automatically places Fibonacci retracement lines from the last highest and lowest visible bars on the chart with: An auto Pending Order (Buy/Sell). Taking Profit 1, Taking Profit 2 is pivot point and Taking Profit 3 for extended reward opportunity. The best risk and reward ratio. Simple and powerful indica
이 제품의 구매자들이 또한 구매함
Gann Made Easy
Oleg Rodin
4.85 (82)
Gann Made Easy 는 mr.의 이론을 사용하여 최고의 거래 원칙을 기반으로 하는 전문적이고 사용하기 쉬운 Forex 거래 시스템입니다. W.D. 간. 이 표시기는 Stop Loss 및 Take Profit Levels를 포함하여 정확한 BUY 및 SELL 신호를 제공합니다. PUSH 알림을 사용하여 이동 중에도 거래할 수 있습니다. 구매 후 연락주세요! 내 거래 팁과 훌륭한 보너스 지표를 무료로 공유하겠습니다! 아마도 Gann 거래 방법에 대해 이미 여러 번 들었을 것입니다. 일반적으로 Gann의 이론은 초보자 거래자뿐만 아니라 이미 거래 경험이 있는 사람들에게도 매우 복잡한 것입니다. Gann의 거래 방식은 이론적으로 적용하기 쉽지 않기 때문입니다. 나는 그 지식을 연마하고 Forex 지표에 최고의 원칙을 적용하기 위해 몇 년을 보냈습니다. 표시기는 적용하기가 매우 쉽습니다. 차트에 첨부하고 간단한 거래 권장 사항을 따르기만 하면 됩니다. 지표는 지속적으로 시장 분석 작업
- Real price is 80$ - 40% Discount ( It is 49$ now ) Contact me for instruction, add group and any questions! Related Product:  Bitcoin Expert , Gold Expert Introduction The breakout and retest strategy is traded support and resistance levels. it involves price breaking through a previous level.  The break and retest strategy is designed to help traders do two main things, the first is to avoid false breakouts. Many false breakouts start with a candlestick that breaks out of a level but ends wi
FX Volume
Daniel Stein
4.58 (33)
모닝 브리핑을 통해 세부 정보와 스크린샷으로 매일 시장 업데이트를 받으세요 여기 mql5 및 텔레그램에서 FX 거래량은 브로커의 관점에서 시장 심리에 대한 실제 통찰력을 제공하는 최초이자 유일한 거래량 지표입니다. 브로커와 같은 기관 시장 참여자가 외환 시장에서 어떤 포지션을 취하고 있는지에 대한 훌륭한 통찰력을 COT 보고서보다 훨씬 빠르게 제공합니다. 차트에서 이 정보를 직접 확인하는 것은 트레이딩의 진정한 판도를 바꾸고 획기적인 솔루션입니다. 다음과 같은 고유한 시장 데이터 인사이트의 이점 비율 는 통화의 매수/매도 포지션 비율을 백분율로 표시 비율 변화 는 선택한 기간 내 매수 비율과 비율 변화를 표시 총 거래량 는 해당 통화의 총 거래량(롱 및 숏)을 로트 단위로 보여줍니다 Volumes Long 는 해당 통화의 모든 롱 포지션의 거래량을 보여줍니다 Volumes Short 는 해당 통화의 모든 숏 포지션의 거래량을 보여줍니다 Net Long 는 순 롱 포지션의 거래량
Gold Stuff
Vasiliy Strukov
4.89 (239)
Gold Stuff는 금을 위해 특별히 설계된 추세 지표이며 모든 금융 상품에서도 사용할 수 있습니다. 표시기가 다시 그려지지 않고 지연되지 않습니다. 권장 기간 H1. 표시기에서 완전 자동 Expert Advisor EA Gold Stuff를 작동합니다. 내 프로필에서 찾을 수 있습니다. 설정 및 개인 보너스를 받으려면 구매 후 즉시 저에게 연락하십시오!   강력한 지원 및 트렌드 스캐너 표시기의 무료 사본을 받으실 수 있습니다. 메시지를 보내주세요. 나!   설정 화살표 그리기 - 켜기 끄기. 차트에 화살표 그리기. 경고 - 가청 경고를 끕니다. 이메일 알림 - 켜기 끄기. 이메일 알림. Puch-notification - 켜기 끄기. 푸시 알림. 다음으로 색 영역을 조정합니다. Gold Stuff는 금을 위해 특별히 설계된 추세 지표이며 모든 금융 상품에서도 사용할 수 있습니다. 표시기가 다시 그려지지 않고 지연되지 않습니다. 권장 기간 H1. 표시기에서 완
TPSproTREND PrO
Roman Podpora
4.79 (19)
TPSpro TREND PRO는   시장을 자동으로 분석하여 추세와 각 변화에 대한 정보를 제공할 뿐만 아니라 다시 그리지 않고도 거래에 진입할 수 있는 신호를 제공하는 추세 지표입니다! 지표는 각 양초를 사용하여 개별적으로 분석합니다. 다른 임펄스를 언급합니다 - 업 또는 다운 임펄스. 통화, 암호화폐, 금속, 주식, 지수 거래의 정확한 진입점! 버전 MT5                   표시기에 대한 전체 설명       표시기   와 함께 사용하는 것이 좋습니다   -   RFI LEVELS 주요 기능: 렌더링 없이 정확한 입력 신호! 신호가 나타나면 관련성은 유지됩니다! 이는 신호를 제공한 후 변경하여 예금 자금 손실을 초래할 수 있는 다시 그리기 지표와의 중요한 차이점입니다. 이제 더 큰 확률과 정확도로 시장에 진입할 수 있습니다. 화살표가 나타난 후 목표에 도달(이익실현)하거나 반전 신호가 나타날 때까지 캔들을 색칠하는 기능도 있습니다. STOP LOSS / TAK
Scalper Inside PRO
Alexey Minkov
4.73 (56)
An exclusive indicator that utilizes an innovative algorithm to swiftly and accurately determine the market trend. The indicator automatically calculates opening, closing, and profit levels, providing detailed trading statistics. With these features, you can choose the most appropriate trading instrument for the current market conditions. Additionally, you can easily integrate your own arrow indicators into Scalper Inside Pro to quickly evaluate their statistics and profitability. Scalper Inside
현재 20% 할인 ! 초보자 또는 전문가 트레이더를 위한 최고의 솔루션! 이 대시보드 소프트웨어는 28개의 통화 쌍에서 작동합니다. 2가지 주요 지표(Advanced Currency Strength 28 및 Advanced Currency Impulse)를 기반으로 합니다. 전체 Forex 시장에 대한 훌륭한 개요를 제공합니다. 고급 통화 강도 값, 통화 이동 속도 및 모든(9) 시간대의 28 Forex 쌍에 대한 신호를 보여줍니다. 추세 및/또는 스캘핑 기회를 정확히 파악하기 위해 차트의 단일 지표를 사용하여 전체 시장을 볼 수 있을 때 거래가 어떻게 개선될지 상상해 보십시오! 잠재적인 거래를 식별하고 확인하면서 강력한 통화와 약한 통화를 더욱 쉽게 식별할 수 있도록 이 지표에 기능을 내장했습니다. 이 표시기는 통화의 강세 또는 약세가 증가 또는 감소하는지 여부와 모든 시간대에서 수행되는 방식을 그래픽으로 보여줍니다. 추가된 새로운 기능은 현재 시장 조건 변화에 적
Trend Punch
Mohamed Hassan
4.95 (19)
This indicator is unstoppable when combined with our other indicator called  Support & Resistance . After purchase, send us a message and you will get it   for  FREE as a BONUS! Introducing Trend Punch , the revolutionary forex trend indicator that will transform the way you trade! Trend Punch is uniquely designed to provide precise buy and sell arrows during strong market trends, making your trading decisions clearer and more confident. Whether you're trading major currency pairs or exotic sym
Atomic Analyst
Issam Kassas
5 (2)
우선적으로 언급할 점은이 거래 지표가 다시 그리지 않고 지연되지 않으며 이를 통해 수동 및 로봇 거래 모두에 이상적이라는 점입니다. 사용자 매뉴얼: 설정, 입력 및 전략. Atomic Analyst는 가격의 강도와 모멘텀을 활용하여 시장에서 더 나은 이점을 찾는 PA Price Action Indicator입니다. 고급 필터를 장착하여 잡음과 거짓 신호를 제거하고 거래 잠재력을 높이는 데 도움이 됩니다. 복잡한 지표의 다중 레이어를 사용하여 Atomic Analyst는 차트를 스캔하고 복잡한 수학적 계산을 간단한 신호와 색상으로 변환하여 초보 트레이더가 이해하고 일관된 거래 결정을 내릴 수 있도록합니다. "Atomic Analyst"는 새로운 및 경험이 풍부한 트레이더를위한 종합적인 거래 솔루션입니다. 프리미엄 지표와 최고 수준의 기능을 하나의 거래 전략에 결합하여 모든 종류의 트레이더에 대한 다재다능한 선택지가되었습니다. 인트라데이 거래 및 스캘핑 전략 : 빠르고 정확한
FX Power MT4 NG
Daniel Stein
5 (13)
모닝 브리핑 여기 mql5 와 텔레그램에서 FX Power MT4 NG 는 오랫동안 인기 있는 통화 강도 측정기인 FX Power의 차세대 버전입니다. 이 차세대 강도 측정기는 무엇을 제공합니까? 기존 FX Power에서 좋아했던 모든 것 PLUS GOLD/XAU 강도 분석 더욱 정밀한 계산 결과 개별 구성 가능한 분석 기간 더 나은 성능을 위한 사용자 정의 가능한 계산 한도 특별 멀티더 많은 것을보고 싶은 사람들을위한 특별한 다중 인스턴스 설정 모든 차트에서 좋아하는 색상을위한 끝없는 그래픽 설정 수많은 알림 옵션, 중요한 것을 다시는 놓치지 않도록 Windows 11 및 macOS 스타일의 둥근 모서리가 있는 새로운 디자인 마법처럼 움직이는 인디케이터 패널 FX 파워 키 특징 모든 주요 통화의 완전한 강세 이력 모든 시간대에 걸친 통화 강세 이력 모든 브로커 및 차트에서 고유 계산 결과 100% 신뢰할 수있는 실시간100 % 신뢰할 수있는 실시간 계산-> 다시 칠하지 않음
Apollo Pips PLUS SP
Oleg Rodin
5 (4)
제품을 구매하기 전에 아래 정보를 읽어보세요! Apollo Pips PLUS SP는 독특한 제품입니다! 모든 거래 지표에 액세스할 수 있는 새로운 "APOLLO PIPS" 지표와 "슈퍼 팩" 보너스를 받고 싶은 분들을 위한 것입니다! Apollo Pips PLUS SP 제품을 구매하면 실제로 Apollo Pips 표시기의 완전히 새로운 버전을 구매하게 됩니다. 이 버전의 지표에는 개선된 알고리즘과 사용하기 쉬운 매개변수가 있어 모든 시장 및 거래 스타일에서 지표를 사용할 수 있는 기회를 제공합니다. 이 제품의 구매자는 슈퍼 보너스로 다른 모든 표시기에 무료로 액세스할 수 있습니다! 내 모든 거래 도구에 액세스하고 싶었다면 이 제품이 당신에게 딱 맞습니다! :) 하지만 이것이 전부는 아닙니다! :) 이 제품의 모든 구매자는 또한 내 새로운 지표를 무료로 받을 자격이 있습니다! :) 새로운 거래 지표를 사용할 수 있게 되었는데, 귀하는 저의 특별한 "SUPER PACK" 평생 보너스
Trend Screener
STE S.S.COMPANY
4.8 (87)
트렌드 표시기, 트렌드 트레이딩 및 필터링을 위한 획기적인 고유 솔루션, 하나의 도구 안에 내장된 모든 중요한 트렌드 기능! Forex, 상품, 암호 화폐, 지수 및 주식과 같은 모든 기호/도구에 사용할 수 있는 100% 다시 칠하지 않는 다중 시간 프레임 및 다중 통화 표시기입니다. 기간 한정 특가: 지원 및 저항 스크리너 지표는 단 100달러에 평생 제공됩니다. (원래 가격 50 달러) (제안 연장) Trend Screener는 차트에 점이 있는 화살표 추세 신호를 제공하는 효율적인 지표 추세 추종 지표입니다. 추세 분석기 표시기에서 사용할 수 있는 기능: 1. 트렌드 스캐너. 2. 최대 이익 분석이 있는 추세선. 3. 추세 통화 강도 측정기. 4. 경고가 있는 추세 반전 점. 5. 경고가 있는 강력한 추세 점. 6. 추세 화살표 Trend Screener Indicator가 있는 일일 분석 예, 일일 신호 성능...등은 여기에서 찾을 수 있습니다.   여기를 클릭하십시오.
TPSpro RFI Levels
Roman Podpora
4.82 (22)
지침         러시아   -        영어       표시기와 함께 사용하는 것이 좋습니다   .       -       TPSpro   트렌드 프로 -   MT4 버전         거래에서 핵심 요소는 거래 상품을 매수 또는 매도하기로 결정하는 구역 또는 수준입니다. 주요 업체가 시장에서 자신의 존재를 숨기려는 시도에도 불구하고, 그들은 필연적으로 흔적을 남깁니다. 우리의 과제는 이러한 흔적을 식별하고 올바르게 해석하는 방법을 배우는 것이었습니다. 주요 기능:: 판매자와 구매자를 위한 활성 영역을 표시합니다! 이 지표는 매수 및 매도를 위한 모든 올바른 초기 임펄스 레벨/존을 보여줍니다. 진입점 검색이 시작되는 이러한 레벨/존이 활성화되면 레벨의 색상이 바뀌고 특정 음영으로 채워집니다. 또한 상황을 보다 직관적으로 이해하기 위해 화살표가 나타납니다. 더 높은 시간대의 레벨/존 표시(MTF 모드) 더 높은 시간 간격을 사용하여 레벨/존을 표시하는 기능을 추가했습니다.
Dynamic Forex28 Navigator - 차세대 외환 거래 도구. 현재 49% 할인. Dynamic Forex28 Navigator는 오랫동안 인기 있는 지표의 진화형으로, 세 가지의 힘을 하나로 결합했습니다. 고급 통화 Strength28 지표(695개 리뷰) + 고급 통화 IMPULSE with ALERT(520개 리뷰) + CS28 콤보 신호(보너스). 지표에 대한 자세한 정보 https://www.mql5.com/en/blogs/post/758844 차세대 Strength 지표는 무엇을 제공합니까?  원래 지표에서 좋아했던 모든 것이 새로운 기능과 더 높은 정확도로 강화되었습니다. 주요 기능: 독점적인 통화 Strength 공식.  모든 시간대에 걸쳐 부드럽고 정확한 강도선. 추세와 정확한 진입을 식별하는 데 이상적입니다. 역동적인 시장 피보나치 수준(시장 피보나치).  이 지표에만 있는 고유한 기능. 가격 차트가 아닌 통화 강도에 피보나치가 적용
우선적으로, 이 거래 도구는 전문적인 거래에 이상적인 비-다시 그리기 및 지연되지 않는 지표입니다.  온라인 강좌, 사용자 매뉴얼 및 데모. 스마트 가격 액션 컨셉트 인디케이터는 신규 및 경험 많은 트레이더 모두에게 매우 강력한 도구입니다. Inner Circle Trader Analysis 및 Smart Money Concepts Trading Strategies와 같은 고급 거래 아이디어를 결합하여 20가지 이상의 유용한 지표를 하나로 결합합니다. 이 인디케이터는 스마트 머니 컨셉트에 중점을 두어 대형 기관의 거래 방식을 제공하고 이동을 예측하는 데 도움을 줍니다.  특히 유동성 분석에 뛰어나 기관이 어떻게 거래하는지 이해하는 데 도움을 줍니다. 시장 트렌드를 예측하고 가격 변동을 신중하게 분석하는 데 탁월합니다. 귀하의 거래를 기관 전략에 맞추어 시장의 동향에 대해 더 정확한 예측을 할 수 있습니다. 이 인디케이터는 시장 구조를 분석하고 중요한 주문 블록을 식별하고 다양한
Enigmera
Ivan Stefanov
5 (3)
에니메라: 시장의 핵심 https://www.enigmera.com 소개 이 지표 및 트레이딩 시스템은 금융 시장에 대한 놀라운 접근 방식입니다. 에니메라는 프랙탈 주기를 사용하여 지지선과 저항선을 정확하게 계산합니다. 진정한 축적 단계를 보여주고 방향과 목표를 제시합니다.  추세에 있든 조정에 있든 작동하는 시스템입니다.  어떻게 작동하나요? 에니메라는 지지선/저항선, 목표선, 편차선의 세 가지 라인으로 구성됩니다. 이 시스템은 과거 데이터를 현재와 미래로 추정하는 일반적인 시장 지표와 달리 현재에 대한 완전한 그림을 제공합니다. 지지선 위에 있으면 실제 지지를 의미하고 저항선 위에 있으면 실제 저항을 의미합니다. 레벨이 깨지면 추세의 변화를 나타냅니다. 다시 그리지 않습니다. 시장이 지속적으로 진화함에 따라 에니메라는 평가 도구를 조정하여 전략을 정기적으로 수정합니다.   이를 통해 모든 시나리오를 철저히 평가할 수 있습니다. 이 시장 지표의 고유성은 분명하며 그 기
M1 Gold
Abdulkarim Karazon
Stratos Pali
Michela Russo
5 (1)
Stratos Pali Indicator   is a revolutionary tool designed to enhance your trading strategy by accurately identifying market trends. This sophisticated indicator uses a unique algorithm to generate a complete histogram, which records when the trend is Long or Short. When a trend reversal occurs, an arrow appears, indicating the new direction of the trend. Important Information Revealed Leave a review and contact me via mql5 message to receive My Top 5 set files for Stratos Pali at no cost! D
Market Reversal Alerts
LEE SAMSON
4.19 (113)
가격이 역전되고 후퇴함에 따라 시장 구조가 변경됩니다. 시장 구조 반전 경고 표시기는 추세 또는 가격 움직임이 고갈에 가까워지고 반전할 준비가 되었음을 식별합니다. 일반적으로 반전이나 큰 하락이 일어나려고 할 때 발생하는 시장 구조의 변화를 알려줍니다. 지표는 가능한 고갈 지점 근처에서 새로운 고점 또는 저점이 형성될 때마다 초기에 돌파와 가격 모멘텀을 식별합니다. 표시기는 반대쪽에 있는 마지막 촛불에 직사각형을 그립니다. 그런 다음 현재의 단기 추세에서 계속 움직이기 때문에 가격과 함께 직사각형을 따라갈 것입니다. 가격이 사각형 위나 아래로 다시 닫힐 정도로 약해지면 시장 구조에 잠재적인 변화가 일어나고 있음을 나타냅니다. 그런 다음 표시기는 방향의 잠재적인 이동과 추세 또는 주요 하락의 가능한 반전 시작에 대해 경고합니다. 작동 방식을 보려면 아래의 작동 표시기를 참조하십시오! 여기에서 모든 쌍 및 기간을 모니터링하기 위한 선택적 대시보드 추가 기능: https://
MetaBands M4
Vahidreza Heidar Gholami
5 (2)
MetaBands uses powerful and unique algorithms to draw channels and detect trends so that it can provide traders with potential points for entering and exiting trades. It’s a channel indicator plus a powerful trend indicator. It includes different types of channels which can be merged to create new channels simply by using the input parameters. MetaBands uses all types of alerts to notify users about market events. Features Supports most of the channel algorithms Powerful trend detection algorith
PRO Renko System
Oleg Rodin
5 (25)
PRO Renko System 은 RENKO 차트 거래를 위해 특별히 고안된 매우 정확한 거래 시스템입니다. 이것은 다양한 거래 상품에 적용될 수있는 보편적 인 시스템입니다. 체계는 효과적으로 당신에게 정확한 반전 신호에 접근을 주는 소위 시장 소음을 중화합니다. 이 표시기는 사용하기가 매우 쉽고 신호 생성을 담당하는 매개 변수가 하나만 있습니다. 당신은 쉽게 당신의 선택의 어떤 무역 계기에 공구를 적응시킬 수 있고 renko 막대기의 크기. 나는 항상 당신이 내 소프트웨어로 수익성있게 거래 할 수 있도록 추가 지원을 제공 할 준비가되어 있습니다! 나는 당신에게 행복하고 수익성있는 거래를 기원합니다! 구매 후 저에게 연락하십시오! 내 렌코 차트 생성기를 보내드립니다. 또한 내 개인 권장 사항 및 시스템의 다른 모듈을 무료로 공유 할 것입니다!
Legacy of Gann
Pavel Zamoshnikov
4.83 (12)
The indicator very accurately determines the levels of the possible end of the trend and profit fixing. The method of determining levels is based on the ideas of W.D.Gann, using an algorithm developed by his follower Kirill Borovsky. Extremely high reliability of reaching levels (according to K. Borovsky  - 80-90%) Indispensable for any trading strategy – every trader needs to determine the exit point from the market! Precisely determines targets on any timeframes and any instruments (forex, met
Shepherd Harmonic Pattern
Abdullah Alrai
4.65 (49)
이 지표는 수동 및 자동 방법으로 차트에 그려진 고조파 패턴을 감지합니다. 사용자 매뉴얼은 다음 링크에서 확인할 수 있습니다. 리뷰를 작성하고 문의하면 무료 버전으로 MT4에서 제품을 시도할 수 있습니다. Gartley 및 Nenstar 패턴을 감지하는 데 사용할 수 있습니다. https://www.mql5.com/en/market/product/30181 전체 MT4 버전을 구입하려면 다음에서 구입할 수 있습니다. https://www.mql5.com/en/market/product/15212 참고 사항 지표에는 제어 패널이 있으며 모든 (차트 및 시간대) 설정을 저장합니다. 차트에서 더 많은 공간을 확보하려면 최소화할 수 있으며, 다른 분석 도구로 작업하는 것이 선호되는 경우 모든 지표 데이터를 숨기려면 닫기 버튼을 누를 수 있습니다. 이 지표를 사용하고 설정을 변경하면 이동 평균 또는 볼린저 밴드와 같은 지표를 추가하면 자동으로 템플릿을 저장하고 필요할 때 언제든지 로드할 수
이 대시보드는 시장 구조 반전 지표와 함께 사용하기 위한 경고 도구입니다. 주요 목적은 특정 시간 프레임에 반전 기회를 알리고 지표가 하는 대로 경고의 재테스트(확인)를 알리는 것입니다. 대시보드는 자체적으로 차트에 배치되고 백그라운드에서 작동하여 선택한 쌍 및 기간에 대한 알림을 보내도록 설계되었습니다. 많은 사람들이 하나의 MT4에서 여러 차트에서 시장 반전 표시기를 실행하는 대신 여러 쌍과 시간 프레임을 한 번에 모니터링하기 위해 대시를 요청한 후 개발되었습니다. M5, M15, M30, H1, H4 및 D1 시간대에 경고합니다. 더 높은 기간은 물론 모든 거래와 마찬가지로 가장 잘 작동합니다. 이 대시보드는 시장 구조 반전 지표용 애드온으로 설계되었습니다. 독립적으로 작동하며 시장 역전 경고 표시기가 제공하는 패턴 및 신호에 대해 경고합니다. 여기에서 시장 반전 경고 표시기를 얻으십시오: https://www.mql5.com/en/market/product/46295
SSM ZakopiecFX Follow The Trend
ROBERT URBANSKI
4.81 (21)
맞춤형 MT4 지표로 성공적인 외환 거래에 대한 비밀을 발견하십시오! 외환 시장에서 성공을 달성하고 위험을 최소화하면서 일관되게 이익을 얻는 방법을 궁금해 한 적이 있습니까? 여기에 당신이 찾고 있던 답이 있습니다! 거래에 대한 귀하의 접근 방식을 혁신 할 독점적 MT4 지표를 소개 할 수 있습니다. 독특한 다양성 우리의 지표는 Renko 및 Rangebar Candle Formations를 선호하는 사용자를 위해 특별히 설계되었습니다. 우리는 이러한 차트 유형이 많은 숙련 된 거래자들이 선호한다는 것을 이해하기 때문에 우리의 지표가 그들과 완벽하게 통합되어 비교할 수없는 시장 분석을 제공합니다. 명확한 추세 신호 복잡한 분석을 잊어 버리십시오! 우리의 지표는 생생한 색상과 명확한 점 구조를 사용하여 시장 동향을 명확하게 나타냅니다. 빨간색과 파란색 점은 가격 이동 방향에 대해 의심의 여지가 없어 거래에서 빠른 의사 결정을 할 수 있습니다. HH/HL HL/LL
Gold Channel XAUUSD
Paulo Rocha
5 (2)
Gold Channel is a volatility-based indicator, developed with a specific timing algorithm for the XAUUSD pair, which consists of finding possible corrections in the market. This indicator shows two outer lines, an inner line (retracement line) and an arrow sign, where the theory of the channel is to help identify overbought and oversold conditions in the market. The market price will generally fall between the boundaries of the channel. If prices touch or move outside the channel it is a tra
Currency Strength Wizard
Oleg Rodin
4.93 (44)
통화 강도 마법사는 성공적인 거래를 위한 올인원 솔루션을 제공하는 매우 강력한 지표입니다. 표시기는 여러 시간 프레임의 모든 통화 데이터를 사용하여 이 또는 해당 외환 쌍의 힘을 계산합니다. 이 데이터는 특정 통화의 힘을 확인하는 데 사용할 수 있는 사용하기 쉬운 통화 지수 및 통화 전력선의 형태로 표시됩니다. 필요한 것은 거래하려는 차트에 표시기를 부착하는 것뿐입니다. 표시기는 거래하는 통화의 실제 강세를 보여줍니다. 지표는 또한 추세와 거래할 때 유리하게 사용할 수 있는 구매 및 판매 거래량 압력의 극한값을 보여줍니다. 지표는 또한 피보나치에 기반한 가능한 대상을 보여줍니다. 표시기는 PUSH 알림을 포함한 모든 유형의 알림을 제공합니다. 구매 후 연락주세요. 나는 당신과 거래 팁을 공유하고 당신에게 무료로 훌륭한 보너스 지표를 줄 것입니다! 나는 당신에게 행복하고 유익한 거래를 기원합니다!
Scalper Vault
Oleg Rodin
5 (27)
Scalper Vault 는 성공적인 스캘핑에 필요한 모든 것을 제공하는 전문 스캘핑 시스템입니다. 이 표시기는 외환 및 바이너리 옵션 거래자가 사용할 수 있는 완전한 거래 시스템입니다. 권장 시간 프레임은 M5입니다. 시스템은 추세 방향으로 정확한 화살표 신호를 제공합니다. 또한 상단 및 하단 신호와 Gann 시장 수준을 제공합니다.  이 시스템은 사용하기가 매우 쉽습니다. 원하는 시장 지역의 화살표만 따라가면 됩니다. 엑시트는 가격이 적정 수준에 도달하거나 시장의 고점 또는 저점 신호가 나타날 때 수행됩니다.  표시기는 PUSH 알림을 포함한 모든 유형의 경고를 제공합니다. 인디케이터 구매 후 연락주세요. 내 개인 거래 권장 사항과 훌륭한 보너스 지표를 무료로 공유합니다! 나는 당신에게 행복하고 유익한 거래를 기원합니다!
Apollo BuySell Predictor 는 여러 거래 모듈을 포함하는 전문 거래 시스템입니다. 트레이더에게 고유한 브레이크아웃 영역, 피보나치 기반 지원 및 저항 수준, 피벗 추세선, 풀백 볼륨 신호 및 모든 트레이더가 매일 필요로 하는 기타 유용한 기능을 제공합니다. 시스템은 모든 쌍과 함께 작동합니다. 권장 시간 프레임은 M30, H1, H4입니다. 지표는 H4보다 높은 시간 프레임을 제외하고 다른 시간 프레임에서도 작동할 수 있습니다. 이 시스템은 모든 트레이더가 성공적인 거래에 필요한 모든 것을 제공하므로 보편적입니다. 이 시스템은 여러 가지 방법으로 사용할 수 있습니다. 데이 트레이딩, 스윙 트레이딩, 심지어 스캘핑까지 사용할 수 있습니다. 귀하가 선호하는 거래 스타일에 관계없이 시스템은 귀하가 시장을 실제 모습으로 볼 수 있도록 도와줄 것입니다. 모든 신호는 다시 칠하지 않고 지체하지 마십시오! 거래 기본 설정 및 작업에 따라 시스템의 다른 모듈을 켜거나 끌 수 있습
Currency Strength Exotics
Bernhard Schweigert
4.87 (30)
현재 20% 할인! 초보자 또는 전문가 트레이더를 위한 최고의 솔루션! 이 표시기는 Exotic Pairs Commodities, Indexes 또는 Futures와 같은 기호에 대한 통화 강도를 표시하는 데 특화되어 있습니다. 금, 은, 석유, DAX, US30, MXN, TRY, CNH 등의 진정한 통화 강도를 보여주기 위해 9번째 줄에 모든 기호를 추가할 수 있습니다. 이것은 독특하고 고품질이며 저렴한 거래 도구입니다. 우리는 많은 독점 기능과 새로운 공식을 통합했습니다. 새로운 추세 또는 스캘핑 기회의 정확한 트리거 포인트를 정확히 찾아낼 수 있기 때문에 거래가 어떻게 개선될지 상상해 보십시오. 사용 설명서: 여기를 클릭 https://www.mql5.com/en/blogs/post/708876 모든 시간대에 작동합니다. TREND를 빠르게 확인할 수 있습니다! 새로운 기본 알고리즘을 기반으로 설계되어 잠재적인 거래를 더욱 쉽게 식별하고 확인할 수 있습니다.
제작자의 제품 더 보기
Ichimoku Scanner Dashboard
Abir Pathak
4.76 (17)
Dashboard uses Ichimoku Strategy to find best trades. Get extra Indicators/Template: And read more about detailed Product Description and usage here: https://www.mql5.com/en/blogs/post/747457 Please note: I won’t be able to add new settings. It already has 72 settings  :) Some people are using it with their EAs. And iCustom function can only take Max 64 settings. So, I cannot let it grow any further. I’ll definitely be maintaining the code and solving issues. Don’t worry. Please check all
Read detailed description and extra indicators: https://www.mql5.com/en/blogs/post/758622 This Supertrend dashboard is a multi-currency and multi-timeframe dash which gives signals whenever supertrend changes it's trend direction. Please note, that this is not a full trading system. It will help you get initial Supertrend signals and higher timeframe trend alignments. And it’s to be used with your own Supertrend Strategies. Features: 1- Select one of In-Built Supertrend Indicators: xSupertr
TDI Multi Timeframe Scanner: This Dashboard indicator uses the TDI (Trader's Dynamic Index) Indicator to find best trades. Read detailed How to Use Guide: https://www.mql5.com/en/blogs/post/758252 Extra indicators also available in above post. Checks for: - SharkFin Pattern Free indicator for SharkFin: https://www.mql5.com/en/market/product/42405/ - TDI Trend: Strong/Weak Trend Up/Down - TDI Signal: Strong/Medium/Weak Signal for Buy/Sell - Consolidation - Overbought/Oversold - Volatilit
How To Use Check out this post for detailed description on  All Indicator extras and template: https://www.mql5.com/en/blogs/post/758259 The Best Heiken Ashi System is a simple trading system for trading based only two indicators for generate signals: Heiken ashi smoothed and Vqzz indicator multi-timeframe. The system was created for scalping and day trading but can also be configured for higher time frames. As mentioned, the trading system is simple, you get into position when the two ind
FREE
About: A Fibonacci indicator is best used with other indicators like Pivots, Support/Resistance etc. Price tends to use Fibo levels as Support or Resistance lines. So, this indicator is very useful to know when price might reverse or if a level is crossed, price might continue the trend. Also, to find the best Take Profit and StopLoss lines. Don't use Fibo Indicator alone for trading as it might not always be accurate. Use it to make your strategies better as a supporting indicator. Settings:
FREE
This is a Sharkfin Arrows Indicator. Detailed explanation and TDI extras: https://www.mql5.com/en/blogs/post/759138 This indicator will show only Arrows. It does not have TDI symbols on chart. Please get the extras from links above for TDI indicators. Sharkfin Scanner (paid): https://www.mql5.com/en/market/product/123566 TDI Scanner Dash (paid): https://www.mql5.com/en/market/product/41826 About: This Indicator finds the Shark Fin Pattern. It will show an arrow in the current bar if R
FREE
Features: 1- Get OB/OS Levels from Golden MA Levels 2- Wait for Buy/Sell Start Level Cross 3- Optional: Should price cross Mid Level in earlier bars 4- Optional: Crossing bar High/Medium Volume 5- Optional: MA Stacked to check up/down trend for current TF 6- Optional: NRTR higher timeframes aligned Check Detailed blog post explained: https://www.mql5.com/en/blogs/post/758457 Levels with Buffers available here: Golden MA Levels Indicator: https://www.mql5.com/en/market/product/119515
FREE
This indicator is based on Guppy's GMMA Strategy. And shows arrows when GMMA lines cross up or down. To have this indicator and get alerts for Multiple Timeframes and multiple Pairs you can check out the demo of this GMMA Trend Scanner indicator: https://www.mql5.com/en/market/product/38747 About GMMA In Brief: GMMA attempts to identify trends by combining two groups of moving averages with differing time periods: The long-term EMAs (30, 35, 40, 45, 50, and 60) the behaviors of investors that
FREE
Read detailed description and Get Free Demo and extra indicators: https://www.mql5.com/en/blogs/post/758610 Features: Halftrend Arrow Scan: Scan Max Past Bars for Halftrend arrows. Show how many bars back the arrow occurred in a bracket Past Bars Back Alerts: Num of bars back for which scanner will send alerts Halftrend HTF Align: Scan Higher timeframes for Trend Direction of Halftrend Indicator and if trends align show a slanting Green/Red Arrow for Up/Down trend Semafor 3 Check: Few bars
EMA Multi meter
Abir Pathak
4.92 (12)
How the Indicator Works: This is a Multi-timeframe MA multimeter indicator which studies if price is above or below a particular EMA range and shows Red/Green/Yellow signals. Red: Price Below EMA range Green: Price above range Yellow: Price within range Indicator Properties: EMA Settings: - Default Period is 200. You can change all MA Settings like Period, MA Method (SMA, EMA, etc) or MA Applied Price (Close, Open, etc). - EMA Range list is a comma separated value list for different timefr
FREE
3 Level ZZ Semafor Scanner: This is a Dashboard indicator which uses 3LZZ Indicator in the background to find semafors. It will give priority to the semafors3 because they specify a strong signal. So, even if there is a sem1 or 2 on current bar, and if Sem3 was within "Check Previous Bars for Sem 3". Then it will show Sem3 instead. Read about this in detailed post: https://www.mql5.com/en/blogs/post/758250 And get all extra Indicators/Template from above link. Please note: Number of setti
Scanner Dashboard for Best Heiken Ashi VQZZ Arrows Indicator here: https://www.mql5.com/en/market/product/45900 Check out this post for detailed description on How To Use All Indicator extras and template: https://www.mql5.com/en/blogs/post/758259 Please note that if you are using too many pairs/timeframes, then VQZZ calculations might slow down the dashboard. So be careful not to use too many VQZZ Higher timeframes if you are using too many pairs. Also, VQZZ is based on higher timeframes. e
This strategy is best used for Scalping and Binary Options. Strategy: There are 3 EMAs: Faster, Medium and Slower. When Price is Trending, wait for Price to bounce an EMA and scalp at each bounce. Features: - Check if 3 MAs are Stacked - Check Price Bounce Off MAs (Faster, Medium, Slower) - Min Distance Between Faster and Medium MA Filter - Max Distance Between Entry Price and Faster MA Filter - High Volume Check - Heiken Trend Check - Volatility Check - Higher/Lower Timeframes MA Stacked check
Abiroid Slope MA
Abir Pathak
4.5 (2)
Features: - Moving Average Slope for Max Past Bars - Slope Period - Slope Thresholds - Multiple Slope Type options - See slope visually as a histogram - Info Panel Show/Hide Slope Calculations and Types: The slope value is calculated using the Slope Period. Suppose Period is 5, it will check the MA value for bar (x) and bar (x+5). And find the slope angle between them. Read detailed description about Slope Types and Settings here: https://www.mql5.com/en/blogs/post/747651
FREE
Abiroid MA Stack
Abir Pathak
4.33 (3)
Moving Average Rainbow Stack: Free: Single Currency & Single Timeframe MA Stack Very useful for finding current and higher timeframe trends. Best suited for long term trend based trading. Use fewer MAs for quick scalping. And not suitable during low volatility. Only use during high volatility and steady trending markets. Use this to enhance your existing Trend based strategies to find best trends. Read detailed description https://abiroid.com/product/abiroid-ma-stack Available MTF and Scanner
FREE
Abiroid Multi Slope indicator allows you to calculate a Slope Histogram for any line of any indicator . Histogram is for 1 slope line only, but slope values can be calculated for 3 lines total. To have multiple histograms, add as many Slope indicators for custom indicators as you like on chart. You just need to provide the Indicator name, buffer value, slope's period and max number of bars back. By default it has slope calculation for TDI_v4.ex4 indicator. There is no way to specify parameters f
FREE
Description This scanner uses 3LZZ TRO ex4 and scans for Semafors at given “Shift” bar. Scanner Detailed Settings: https://www.mql5.com/en/blogs/post/747456 Other Settings: Set Periods for Semafor 1,2,3 Set alerts on/off for Semafor 1,2,3 Shift bar (Bar on which semafor is scanned) Refresh After Ticks (Number of ticks when dash is refreshed) This scanner is pretty simplistic version. And a more detailed version with a different strategy is available here: https://www.mql5.com/en/market/produ
FREE
Features: - Current TF GMMA Cross and Trend (Mandatory Check.. G-Up/G-Down) - HTF GMMA Trend Check (Optional.. slanting arrow) - TDI or NRTR Trend Check (Optional.. diamond) Read post for detailed description and downloading extra indicators: https://www.mql5.com/en/blogs/post/758264 Scanner: This is a Dashboard Scanner for finding good trades using the GMMA method as base and TDI method for trend verification. All buttons for all Pairs and Timeframes are clickable and will change the ch
Extreme TMA System with Arrows Indicator And Buy/Sell Boxes with Take Profit & Stop Loss This is a Non-Repainting Arrows Indicator based on the Extreme TMA System. It shows TMA cross signals and the best BUY/SELL signals. Along with the most predicted TakeProfit. And StopLoss based on TakeProfit ratio. Please note: This is an Arrows only Indicator. Dashboard is sold separately here: https://www.mql5.com/en/market/product/44825 About Indicator: This indicator shows BUY/SELL Signal Arrows a
This Scanner Dashboard uses the Extreme TMA System Arrows Indicator to show good BUY/SELL signals. This Product contains dashboard only. It does not contain the Abiroid_Arrow_Extreme_TMA.ex4 indicator. Arrows indicator is not necessary for dashboard to work.  To see arrows, you can buy the arrows indicator separately if you like: https://www.mql5.com/en/market/product/44822 Dash shows Slopes for current and Higher Timeframes. - 1st diamond is current TF. Next diamonds are higher TFs (Please N
Abiroid Profit Percent Series 1: Arrows Indicator Stochastic Ichimoku with ATR Get the Scanner for free. For getting Profit Percentages for Multiple Timeframes and Multiple Pairs. And read detailed description about this indicator and all the settings here. And get extra Indicators, Templates and settings for download: https://abiroid.com/product/profit-percent-stoch-ichimoku-with-atr Watch the tutorial video here: https://youtu.be/C45-9kWPE2Q About The Strategy: This strategy has 3 main
Profit Percent Series 2 The scanner dashboard available here (for  Free) : https://abiroid.com/product/profitpercent-arrows-ma-confluence Read detailed information about MA Confluence here: https://www.mql5.com/en/blogs/post/747474 Here's a post about Common Settings for all Profit Percent Series Indicators: https://www.mql5.com/en/blogs/post/747456 Strategy: Main Signal Indicators (Any One): MA Cross (In-built) or Hull, OBV Cross, Heiken Ashi Cross Validation Indicators (Preferably l
This is a slope indicator for COG (Center of Gravity) indicator.   Download extra COG Indicators and read detailed description and strategy here: https://www.mql5.com/en/blogs/post/759120 Description: You can set the Slope Threshold for indicating Buy/Sell heightened levels. In the above Image the Threshold is set to 0, because of that all Bullish slope is Green and Bearish is Red. Suppose we set Threshold to -10 and 10, then this is what we get: And also set Slope Period. Default is 5, whi
This Indicator uses Center of Gravity (COG) Indicator to find you the best trades. It is a reversal based Swing Indicator which contains an  Arrows Indicator. That you can buy here from Metatrader Market. Check out this blog post for detailed How to Use Guide and links to free scanner: https://www.mql5.com/en/blogs/post/758262 Scanner needs this arrows indicator in same directory to run Copy scanner ex4 in same folder as your Arrows Indicator: MQL4/Indicators/Market/ All extra indicators
This strategy is best used for Trend based trading. While market is trending, price still makes smaller ranges. Darvas boxes show breakouts from these small ranges, while still following the original market trend. Detailed Description: https://www.mql5.com/en/blogs/post/747919 Features: Darvas - Check Darvas Box Breakout -   Check Price Above/Below MA or Darvas Box has crossed MA -   Min, Max Box Height -   Max Distance Between Entry Price and Darvas Box Other Indicators: - NRTR Tren
Free scanner available here: https://abiroid.com/product/abiroid-ema-scalper Basic Strategy: 1: MA Crossover Up/Down Arrow (Mandatory Check) Optional Checks: 2: If NRTR Check On (Optional): For BUY: Check if NRTR blue and For SELL: NRTR Red If NRTR Shadow Distance On (Optional): Check price for 'x' bars back: at Shadow distance (ATR Multiplier distance) from NRTR line. 3: If High Volume bar On: Check if High Volume or if Medium (if on) Volume bar 'x' bars back 4: If HTF Trend Align On (Option
This strategy is useful for small timeframe scalping and binary options. Best timeframes: M5,M15,M30 M1 timeframe is too unpredictable. So be careful with that. Read Detailed Description and Get All: - Free Demo - Free Scanner - Extra Indicators ex4 files from https://abiroid.com/product/abiroid-donchian-scanner-and-arrows Arrows Demo only works in strategy tester. So, Arrows Demo won't work with the free scanner. Scanner needs "Abiroid Donchian Arrow.ex4" to work. So make sure both arrows a
About: Get Free Scanner and example Strategies And understand detailed description here: https://www.mql5.com/en/blogs/post/759237 And also get example wrappers from above post. You can make your own wrappers if your indicators have complex conditions or for In-Built MT4 indicators. Features: - Specify your own Custom Indicator - Specify Buffer values and create Variables - Use those Variables to create your own Buy/Sell Conditions - Get Arrows Up/Down Signals - See Arrows Signals in Sc
This is a multi-timeframe multi-currency Fibo (Fibonacci levels) and Pivots scanner which also shows Missed Pivot count and Fibo Golden Ratio Zones. Features Select separate Pivot Timeframes for each Dashboard Timeframe Check when price is near a Pivot point Check for Price Crossing Pivot Point Use Mid Pivots (Optional) Show Missed Pivots (Optional) Show High Volume Bar Use Fibo (Optional) Use Fibo Golden Ratio (Optional) Set your preferred Timeframe for Fibo or Pivots Detailed blog post: http
Bollinger Bands Breakout Strategy has an Arrows and Scanner Dashboard indicator set. It is for MT4 (Metatrader 4) platform. When price breaks out of a Bollinger Outer Band in a powerful way, it becomes a great position for scalping. Because the next few bars will most likely keep going in the same direction. Especially if Middle band is also sloping towards that breakout. It's also great for Binary options when using 2-3 next few bars. Strategy: BUY  Bollinger Bands: - Price breaks out of
필터:
Tim Eubanks
5762
Tim Eubanks 2024.05.19 19:54 
 

Solid work, solid indicator!

Abir Pathak
44545
개발자의 답변 Abir Pathak 2024.05.20 01:51
Thank you :)
Suvashish Halder
32754
Suvashish Halder 2021.11.08 08:23 
 

Very Good and Reliable Scanner. Thank you, Abir 😎

Hrishikesh Bhalchandra Kinikar
485
Hrishikesh Bhalchandra Kinikar 2021.06.25 20:15 
 

Exceptional scanner to find the best opportunities in the market. Support and Resistance is the main core of the market, this scanner finds correct zones without fail. Developer has done a wonderful job to make this difficult yet very important scanner work perfectly exceeding all exceptions........

리뷰 답변
버전 1.5 2023.11.15
v1.5 Removed Shift variable. Keeping it fixed at 0
Fixed MA Higher TF Filtering bug
버전 1.4 2023.11.01
v1.4 Added MA Filtering Timeframe selection. Restored Zone selection options back to original.
버전 1.3 2023.04.24
v1.3 Added alerts for zone entry and zone exit. Added alerts for timeframe SR alignment.
SR and price distances will now be based on nearest SR Zone's line in case of breakout.
버전 1.2 2023.01.17
SR Scanner v1.2
Added option: MA Filtering to filter highlighted boxes also
버전 1.1 2021.07.17
SR Scanner v1.1:
- Added MA Alert Filtering
- Added options for: Zone Merge and Zone Extend