Seasonality MT5
- 지표
- Alvin Senjaya
- 버전: 1.1
- 업데이트됨: 27 5월 2021
- 활성화: 5
Hello Seasonal Traders!
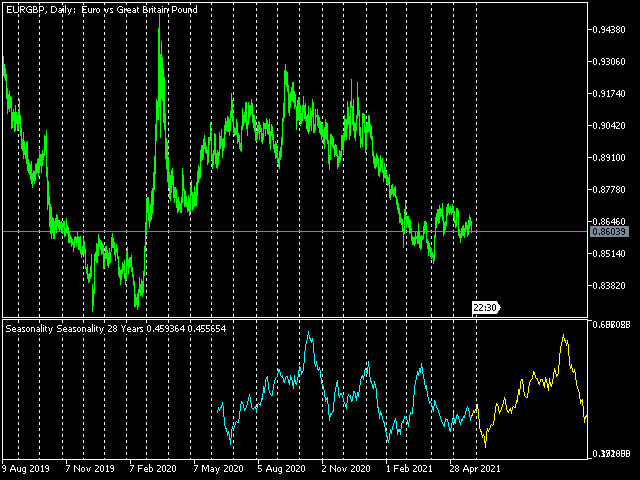
The seasonality trading strategy works because the smart money is doing the same thing every single year more often than not. The month of the year or the day of the week and the time of the day can call the shots in any market.
The seasonal cycle is another useful tool in your trading arsenal. I'm not saying to trade solely off of seasonality and forget anything else. I'm only giving you another trading tool that you can incorporate into your own trading strategy to gain a better edge.
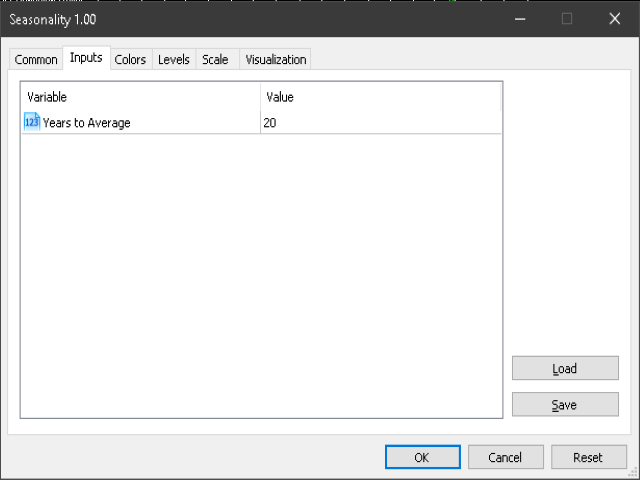
Input
- Years to Average - Number of years of price averaging