TheStrat TFC Monitor MT5
- 지표
- Robert Gerald Wood
- 버전: 1.5
- 업데이트됨: 23 11월 2023
- 활성화: 5
The Strat를 사용하여 거래할 때 여러 시간대를 주시하는 것이 중요합니다.
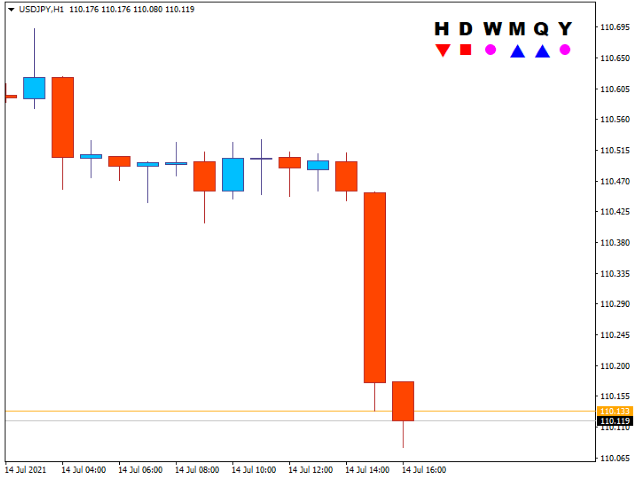
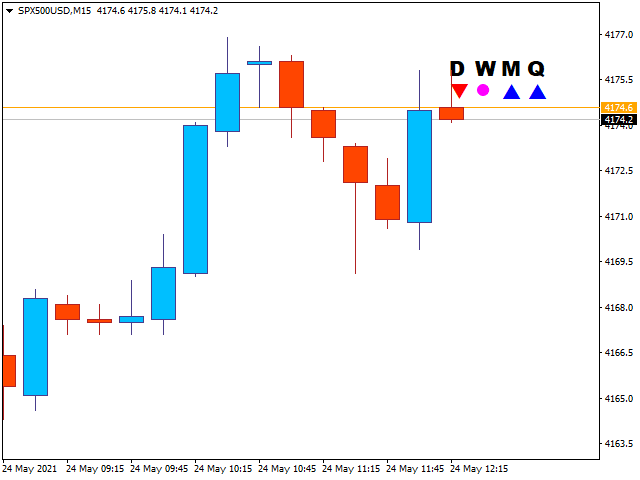
이 표시기는 각 기간에 대한 현재 캔들의 일일, 주간, 월간 및 분기별 상태를 표시합니다.
- 원 아이콘은 해당 기간의 캔들이 현재 내부 또는 TheStrat 용어로 유형 1임을 나타냅니다. 인사이드 데이 양초가 가격 움직임을 통합하고 있으며 우리는 범위의 돌파를 찾고 있습니다.
- 위 또는 아래를 가리키는 삼각형 아이콘은 추세 양초 또는 TheStrat 용어의 유형 2입니다. 추세 양초는 강세 또는 약세일 수 있으며, 이는 이전 양초 범위를 벗어나 현재 한 방향으로 추세를 보이고 있음을 나타냅니다.
- 사각형 아이콘은 아웃사이드 캔들 또는 Strat 용어로 Type 3입니다. 이것은 두 가지를 나타냅니다. 하나는 가격이 해당 기간에 대한 방향에 대해 결정되지 않았고 상당히 고르지 못할 가능성이 높으며, 두 번째는 더 낮은 기간에 짧은 반전을 거래할 수 있는 좋은 기회가 있을 가능성이 있다는 것입니다. 사각형은 강세 또는 약세 색상으로 현재 어느 쪽이 이기고 있는지 보여줍니다.
각 아이콘에 사용되는 색상은 취향에 맞게 구성할 수 있으며 텍스트와 아이콘의 크기도 구성할 수 있습니다.
설정
기간 선택
매시간 표시
True인 경우 시간별 촛불 상태를 표시합니다.
쇼데일리
True이면 일일 캔들 상태를 보여줍니다.
매주 표시
True인 경우 주간 캔들 상태를 표시합니다.
쇼월간
True인 경우 월별 캔들 상태를 표시합니다.
분기별 표시
True인 경우 분기별 캔들 상태를 표시합니다.
ShowYearly
True인 경우 연간 캔들 상태를 표시합니다.
디스플레이 형식
내부글꼴색상
내부(유형 1) 양초를 그릴 때 사용할 색상입니다.
강세글꼴색깔
강세 추세(유형 2) 또는 외부(유형 3) 캔들을 그릴 때 사용할 색상입니다.
Bearish글꼴색
강세 추세(유형 2) 또는 외부(유형 3) 캔들을 그릴 때 사용할 색상입니다.
헤더글꼴 이름
촛불 상태 아이콘의 제목에 사용할 글꼴입니다.
글꼴 크기
제목에 사용할 글꼴 크기입니다. 이것은 또한 표시기 디스플레이의 전체 크기를 제어합니다.

Great tool to see higher time frame confluence