• 미리보기
  • 리뷰
  • 코멘트 (2)
  • 새 소식

Indicator Z Vertical Lines

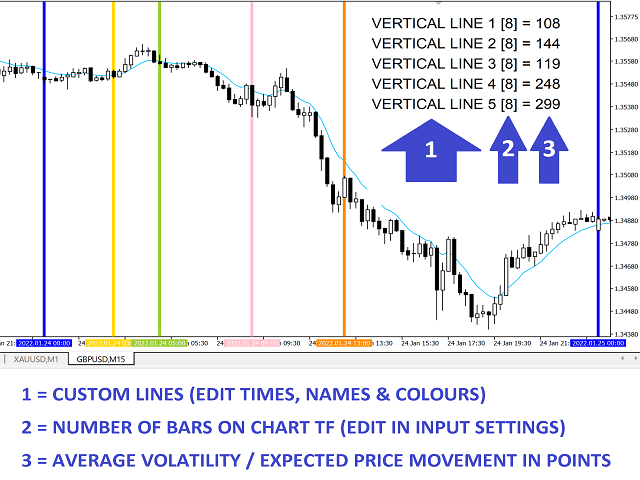
Allows you to find the average volatility / expected price movement for ANY custom period starting at ANY time of day. Simply set a vertical line at the desired entry time and calculate your TP target within the expected volatility range. Indicator places 5 custom vertical lines on chart at the same times each day throughout the history + gives live alerts with custom text each day.

1. Get the average price movement / volatility of ANY time period starting at each vertical line, so you know how much TP price movement to expect in any given period (5 lines = 5 custom volatility readings)

2. Visually check the historical chart at specific times of day (5 coloured lines per day with custom names)

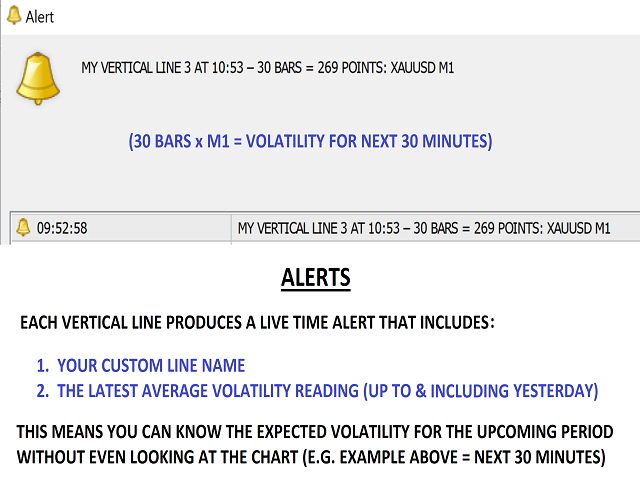
3. Get live time alerts at each vertical line with your own custom alert text + the latest volatility notification

      EXPECTED VOLATILITY = YOUR REAL TP TARGET !!

      Many indicators give limited intra-day volatility readings like ADR or Average Session Ranges etc. but only INDICTAOR Z VERTCIAL LINES allows custom volatility readings for ANY custom-defined period at ANY time of day:

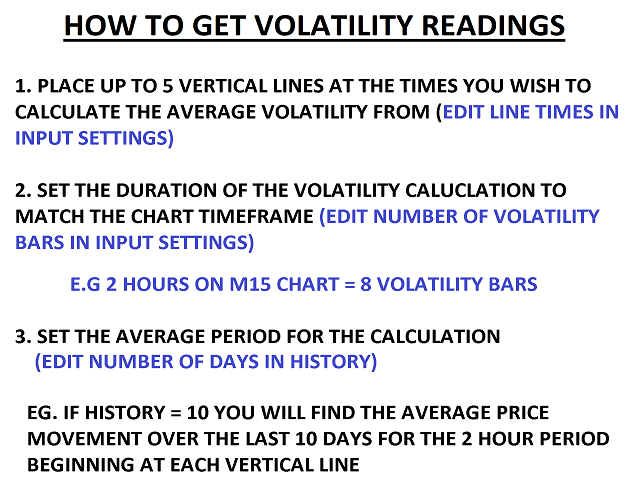
      • The start time for each volatility period is defined by the VERTCIAL LINE TIME (e.g. 09.00)
      • The duration of the volatility period is defined by X NUMBER OF BARS ON THE CHART TIME FRAME (e.g. 4 x M15 BARS = 1 HOUR)
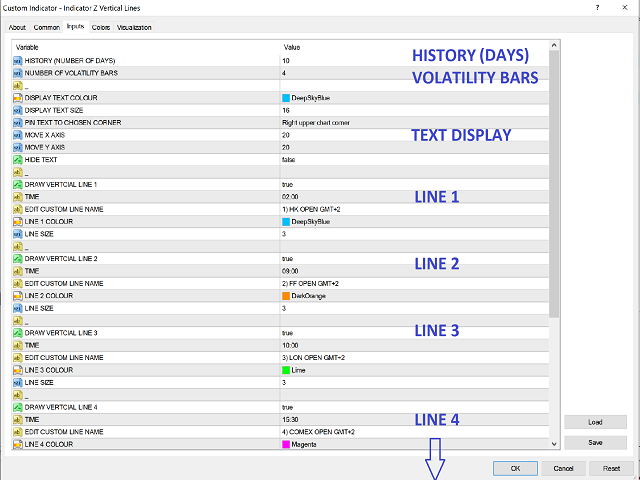
      • The average volatility is calculated over the NUMBER OF DAYS in the HISTORY (e.g. 10 DAY AVERAGE)


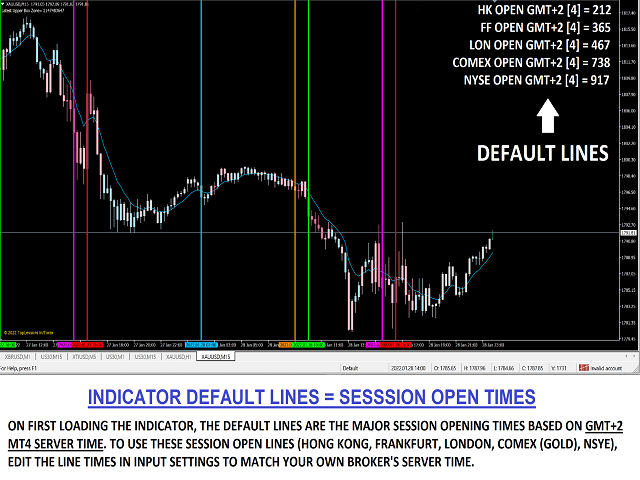
      DEFAULT LINES = SESSION OPEN TIMES

      The indicator default lines are the major SESSION OPEN times at GMT+2 (adjust to match your broker's MT4 SERVER TIME).

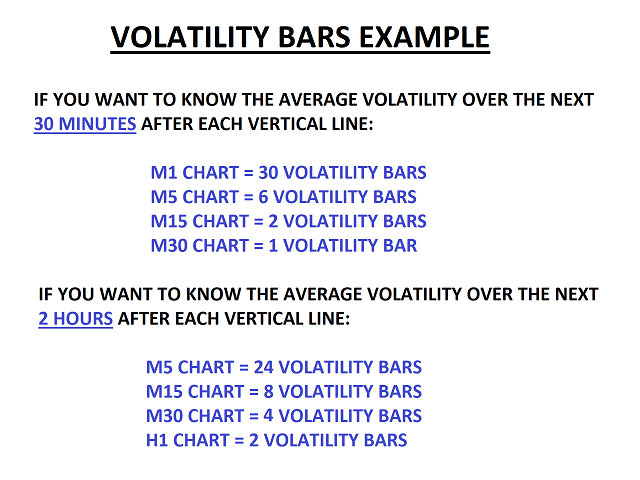
      For example, if you want to know how far price moves during the first 30 minutes of each trading session, use the default lines for each Session Open, and edit the VOLATILITY BARS AFTER LINE input setting to match the required trading period to your chart timeframe e.g.

      • 30 mins on M30 chart = 1 BAR
      • 30 mins on M15 chart = 2 BARS
      • 30 mins on M5 chart = 6 BARS
      • 30 mins on M1 chart = 30 BARS

      DEFAULT = 1 BAR so you can quickly get a volatility reading for different periods just by changing chart timeframe

      Set the NUMBER OF DAYS in the HISTORY setting:

      •  If HISTORY setting = 10 then you get the average volatility over the last 10 days

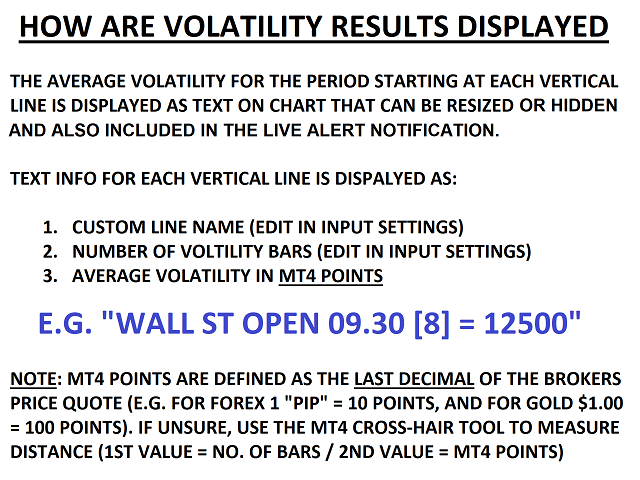
      The average price volatility in MT4 Points for the first 30 minutes of each Session is displayed as text on chart, which you can move or hide, and it is also included in the live alert notifications for each vertical line, so you can know the expected volatility without even looking at the chart.

      With up to 5 lines per day, you can compartmentalize the trading day into specific trading periods, and find the expected price movement for each period, which is very useful for setting realistic and achievable TP targets.

      Use average volatility readings to safely lock in profits while you are away from your screen (e.g. asleep during Asia Session) or for momentum trades at the start of sessions etc. and hit safe TP targets because you know how much price movement to expect.


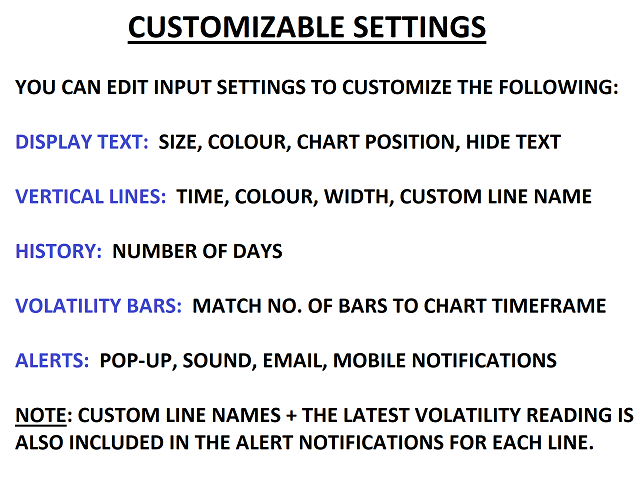
      CUSTOM LINE COLOURS for easy reference to check historical price action and strategies at specific times each day, which saves much time & effort looking back through the charts.

      CUSTOM LINE NAME to label each line with your own text e.g.

      •   "WALL ST OPEN 09.30"

      Lines can also be used as alarm clocks (up to 5 LIVE ALERTS per day) to check the charts or monitor trades at specific times.

      The LATEST TP VOLATILITY CALCULATION + your own CUSTOM LINE NAME text is included in the mobile notification e.g.

      •   "MY STRATGEY NAME
      •   "CHECK MY TRADE 15.00"

      Useful if you have multiple trading strategies, or trades that need to be checked at certain times.

      Manage all your alerts from one chart.


      See Also

      2. INDICATOR Z RECOVERY TRADING ZONE to profit in both directions during high volatility times, even if your 1st trade loses. Only 1 trade is open at any time = compliant hedging for US traders. Easy setup and risk controls for the additional trades.

      3. INDICATOR Z PRO ENGULFING SCANNER to scan unlimited markets for high-probability STRONG ENGULFING and INSIDE REVERSAL patterns with professional pattern filters incl. Min/Max Price Levels, MA Cross, Range Breakout + live price alerts incl. Pullback, Continuation, and Invalidation. HTF + LTF SNIPER ALERT gives Lower Timeframe Patterns within a HTF Engulfing pattern for perfect sniper entries with small SL and high Reward:Risk (e.g. H4+M15 / H1+M5 / M15+M1)


      추천 제품
      OBTE = Order Block Type I OBTI Indicator MT4 is the most accurate and customizable indicator on the market. It was developed to facilitate the analysis of operations based on candlestick patterns and supply-demand zones. These zones are possible movement reversal points. For this indicator is generated by the order block of smart money concept. Input parameters: 1. Multiple timeframes : M1 M5 M15 M30 H1 H4 D1 W1 MN1 2. Default input: H1 H4 D1 W1 MN1 3. Notifications / Send Emails / Notificatio
      XFibo Auto Fibonacci
      Welinton Dos Reis Goncalves
      Use with disciplined risk management. Fibonacci entry system based on the golden zone 38.2 - 61.8 where the entry is confirmed at 23.6 with indications of Take Profit 3:1. Automatically plotted Fibonacci contains retracement and expansion Fibonacci in a single indicator. Up to 77% win rate with this system. FTMO challenge pass with 0.50% risk and 1.50% R:R.
      Transition Trend
      Tatiana Savkevych
      The Transition Trend indicator shows the points of potential market reversal. The indicator's smart algorithm detects the trend, filters out market noise and generates entry signals and exit levels. Simple, visual and efficient trend detection. Uses just one parameter for settings. The indicator does not redraw and does not lag. You can set up message alerts as sound or email. Works on all currency pairs and all timeframes. Ready-made trading system.
      SmartMass
      Roberto Alvarez
      5 (2)
      SMARTMASS INDICATOR This indicator is different from all known volume indicators. It has a significant distinction; it is an algorithm that relates price movement to volume, attempting to find proportionality and efficient movement while filtering out noise and other movements that are more random and do not follow a trend or reversal. Ultimately, it reveals the true strength of the movement, indicating whether it has genuine support from bulls or bears or if it's merely a high-volume movement
      FIBO Trend PRO mt4
      Evgenii Aksenov
      5 (8)
      The indicator allows you to instantly determine the current trend by color and FIBO levels. Higher Timeframe the panel shows the current trend of higher periods, helping to determine the strength of the trend Trade according to the trend when changing the color of candles or trade against the trend when the price hit the extreme levels of the   FIBO Trend PRO  indicator     Advantages of the FIBO Trend PRO Indicator never repaint and does not change their values Very easy to use and intuitive
      Ratio market
      Aleksandr Krokhalev
      4.38 (16)
      Volatility under control. The indicator shows the optimal depth for setting goals within the day and on the average trend. It also builds pivot zones for the estimated correction depth. As an accompaniment, the key levels of the structure are displayed for several timeframes. Classical volatility indicators ATR & ADX on fixed timeframes are used for calculation. The calculation takes into account the spread, and if the market is slightly volatile, you will see a warning about the risk. You can c
      FREE
      Signal Eskiya
      Vitalii Zakharuk
      Signal Eskiya, in addition to channel lines, reflects entry signals in the form of arrows. Trading strategies using the channel indicator belong to the classic methods of technical analysis, are easy to execute, and therefore available even to beginners. Price ranges work equally well on any trading assets and timeframes, they can be used both independently and with additional confirmation from oscillators and market volumes. American traders say: “Trend is your friend”, which means “Trend is
      TRENDIEST TREND LINE   ️️️️️ Do you want to become a constantly profitable 5-star forex trader? ️️️️️ Trendiest Trend Line is a one of a kind trend line indicator, Trend lines work until the market reverses or consolidates. Easily stay out of the chop and stay in the long trends! Key Features of Trendiest Trend Line Stay in strong trends longer with confidence Clearly shows you when the market is ranging to save you money Entry signals help you get in at a good price 100% reliable
      Fibonacci strategies EA trades Fibonacci levels. You can choose whether the EA should trade a manually plotted fibonacci or whether it should automatically plot a fibonacci. In automatic fibonacci drawing mode, the EA automatically plots a fibonacci retracement based on the number of bars you select on the BarsToScan setting in the indicator. The fibonacci is automatically updated in real time as new highest and lowest values appears amongst the selected bars. You can select which level values
      Cuervo Candles Scalping II
      Cristobal Hidalgo Soriano
      Características principales: Estrategia de scalping : El Crow Candles Scalping EA se enfoca en aprovechar movimientos rápidos en el mercado . La estrategia se basa en la identificación de patrones de velas y análisis técnico para tomar decisiones de entrada y salida. 2.Gestión de riesgos avanzada: El EA incorpora una gestión de riesgos sólida para proteger tu cuenta de operaciones. Puedes ajustar los parámetros de stop-loss y take-profit para adaptar el nivel de riesgo a tus preferencias. 3.Co
      Mr Beast Trend Reverse
      Luis Mariano Vazquez Marcos
      MR BEAST TREND REVERSE RECOMENDED H1 EUR USD La estrategia "Trend Reverse" en el mercado de divisas (Forex) es un enfoque utilizado para identificar puntos de reversión de tendencias y capturar cambios de dirección en los precios de los pares de divisas. Esta estrategia se basa en la premisa de que las tendencias del mercado no duran para siempre y que se producirán puntos de inflexión. Este robot de trading de Forex ha sido desarrollado por MRBEAST como una herramienta para facilitar el trading
      Fibo label
      Damir Satridinov
      Индикатор рисует уровни Фибоначчи с выделенными Ценовыми метками.При установке индикатора на график необходимо создать трендовую линию с именем указанным в поле" Unique name of trend line to place fib on ". По умолчанию имя=" Unique name of trend line to place fib on"  =     "+"    .В индикаторе можно заменить уровни фибоначчи по своему усмотрению.Также меняются цвет,стиль,толщина линий и т. д.
      FREE
      Intelligence
      Mikhail Rasporskiy
      the expert Advisor is an artificial intelligence that uses built-in algorithms to calculate currency support levels and place orders. defined by five main levels support.in in cases of a breakdown of the strongest support, the adviser closes orders and opens an order in the direction of the trend, thereby saving the Deposit from being completely drained. new levels are defined, and the EA starts working. does not use martingale. it works on any timeframe, but preferably 30 minutes. th
      외환 거래자로서 기술 분석에서   피보나치   거래 전략의 가치를 이해합니다. 그러나 수동으로 피보나치 수준을 그리고 조정하는 것은 시간이 많이 걸릴 수 있습니다. 여기에서   Fibonacci Of Yesterday Ultimate   지표가 등장합니다. 전일의 가격 조치를 기반으로 하는 피보나치 전략을 사용하는 트레이더를 위해 특별히 설계되어 시간과 노력을 절약할 수 있습니다. 이 혁신적인 지표는 피보나치 수준을 기반으로 진입, 손실 중지 및 이익 실현 수준을 자동으로 식별합니다. 또한 기본 설정에 맞게 쉽게 사용자 지정할 수 있는 사용자 친화적인 피보나치 도구가 포함되어 있습니다. 이를 차별화하는 것은 차트에서 실제 추세 채널을 식별하는 기능으로 반전, 되돌림 및 추세 기회를 쉽게 찾을 수 있도록 도와줍니다. Fibonacci Of Yesterday Ultimate 지표를 사용하는 것은 간단합니다. 주요 보도 자료를 기다렸다가 추세를 파악하고 그에 따라 피보나치 수준을 그립니다
      You shall not pass - it is a Secure Automated Software for trade Forex market and indices. This system detects the ranges between the end of the American session and the beginning of the Asian session, operating thinking that the volume of the market will not be able to maintain the break of the support or resistance, thinking that this break. To adapt to the different schedules of the different brokers, you have to set the closing time of the American session of your broker in the configurati
      Bermaui Channel
      Muhammad Elbermawi
      5 (27)
      This is a price channel that shows five important price levels on the chart. Those levels are: 1. The Highest High (HH) of the previous x bars. 2. The Highest Low (HL) of the previous x bars. 3. The Center Line. 4. The Lowest High (LH) of the previous x bars. 5. The Lowest Low (LL) of the previous x bars. How does Bermaui Channels Captures Overbought  area Think of the distance between HH and HL levels as an overbought area. When the price candles or bars crosses the HL to the upside this
      Evolution Marvel EURCHF Expert Advisor uses independent strategies, including trading on short-term and long-term trends! Trades on the eurchf m5 currency pair by default! Rent for a month is a little. The system sometimes stands still in terms of profitability and if you conduct a test, you can see it. At the time of loading Evolution Marvel EURCHF to the market, the EA was updated and will now make more transactions than initially on the signal! The EA opens a maximum of 3 positions in one
      I will support only my client. สำหรับลูกค้า Parameters General Trade Settings Money Management  Lot : Fixed (can change) Strategies  - H4 Strategies it is fixed with MA, Bollinger band, Candlestick Levels Close Functions  - H4 Strategies MagicNumber  - individual magic number. The EA will only manage position of the chart symbol with this magic number. NextOpenTradeAfterMinutes  - 15 minutes is default, can change it MaxSpread  - upto currency pairs, MaxSlippage  - upto currency pairs, Push
      Level 2 Trading
      Thomas Bradley Butler
      스마트 볼륨 추적기와 결합: https://www.mql5.com/en/market/product/116650 발자국 차트와 결합: https://www.mql5.com/en/market/product/94153 지역 내 거래와 결합: https://www.mql5.com/en/market/product/110194 VOLUM DAY TRADER와 결합: h https://www.mql5.com/en/market/product/72498 주문서와 결합: https://www.mql5.com/en/market/product/102247 레벨 2 트레이딩은 MetaTrader 차트에서 현재 매수 및 매도 거래량을 시각화하는 데 도움이 되는 지표입니다. 이는 시장에서 구매 및 판매 활동을 빠르게 파악하여 압력이 가해지는 위치를 이해할 수 있는 것과 같습니다. 그것이 보여주는 것 입찰 및 매도 금액: 표시기는 매수(매수) 및 매도(매도) 거래량을 보여주는 라벨을 표시
      Using this "Panda EA Creator", *You can create a new EA without Programing using this tool easily. *You can verify your FX method using by this tool. Step1. Register indicators that you want to use. Step2. Register condition of "open position" Step3. Register condition of "close posiiton" Step1. register indicators that you want to use.(max 8 indicators) you can select the major indicator or custom indicator. If the indicator's parameter is not set, the default settings(*1) of indicator are
      This is a simple and efficient indicator based on market logic. The indicator creates a range chosen by a trader. Trader selects only two parameters. The first one is the number of candles that define the frame. The second one is the number of candles needed for confirmation frame. The indicator shows all situations in history and works with the actual movement of the market. The indicator works on all timeframes . You are not limited by use of different timeframes, the indicator is able to adap
      Obie Sniper
      Obaida Kusibi
      Obie Sniper 표시기는 최고의 진입점과 출구점을 제공합니다. Obie Sniper MT4 표시기의 단순성으로 인해 외환 신호를 쉽게 적용하고 성공적으로 거래할 수 있습니다. 이 지표는 M5 및 M15 차트를 사용하는 스캘퍼에게 적합합니다. 동시에 스윙 트레이더는 H1 및 H4 차트를 사용하여 추세를 파악하고 성공적으로 거래할 수 있습니다. 이 지표는 새로운 외환 거래자에게 가장 적합합니다. 시각적으로 추세를 파악하고 최소한의 시간 내에 거래를 시작하는 데 도움이 되기 때문입니다. 그러나 고급 외환 거래자는 모든 추세 거래 환경에서 이 지표를 다른 거래 지표 및 도구와 통합할 수 있습니다. 차트 아래 EURUSD H1 차트는 Obie Sniper의 실제 작동 모습을 보여줍니다. 표시기는 기본 창에 차트 오버레이로 표시됩니다. 강세 추세는 녹색으로 표시되고, 약세 추세는 빨간색 표시선으로 표시됩니다. 결과적으로 추세가 BULLISH에서 BEARISH로 변경되면
      The correlation coefficient reflects the relationship between two values. It shows the dependence of changes in one value on changes in another. For example, from changes in the price of EURUSD and EURNZD. The correlation coefficient in trade, currency relations is constantly changing. Special indicators of correlation help to define it, trace changes, draw correct conclusions. One of them is the Hubbles Correlator indicator. The indicator allows you to simultaneously display several other char
      Master Phi
      Chantal Sala
      Master Phi is an indicator based on Fibonacci numbers. It analyzes the percentage values returning the proportion of the Golden Section. You can customize values and set custom levels so you will create your personal Trading. The attention on the minimums and the maximums of timeframes allows accurate analysis in order to intercept very precisely the trading levels after the various impulse movements. Input Values Time_Frame to analyze LEVELS SETTINGS 9 levels (in percentage) 9 colors LINE SET
      Acromaachin
      Hong Ling Mu
      <LOGIC> EA will place order based on the original logic. This EA should work with take profit and stoploss. Default TP is 50pips and SL is 50pips. If the order was closed with stoploss, EA will stop in that day. Next day, EA will restart and trade again with lot size increasing. Lot size and volume multiple is changeable in the parameters. <Best Pair and TF> EURUSD and GBPUSD TF H1 <Default set> Already optimized TP 50pips SL 50pips Martingale Volume muti X 2 Max martingale 5
      FREE
      ndicador ADX Crossing Alertby Mr Beast El Indicador ADX Crossing Alert v1.0 es una herramienta avanzada diseñada para potenciar tu análisis técnico en MetaTrader, centrándose en las señales generadas por el cruce del Indicador de Dirección del Movimiento (ADX). Este indicador ofrece alertas visuales en el gráfico y la conveniencia de alertas via email, permitiéndote estar siempre al tanto de las oportunidades de trading. Características Destacadas: ADX Crossing Signals: El indicador utiliza el c
      I recommend you to read the   product's blog  (manual) from start to end so that it is clear from the beginning what the indicactor offers. This multi time frame and multi symbol supply and demand zone dashboard indicator sends alerts when the price has reached a supply/demand zone. It is also possible to use it to be alerted about regular double tops/bottoms instead of zones. It can be used with all time frames from M1 to MN. It is possible to use RSI, divergence (MACD, OsMA, RSI or Awesome) a
      Va bank
      Viktor Glovluk
      5 (1)
      This multi-currency EA analyzes the last closed candle of a specified timeframe (Weekly is recommended), calculated candle body and, if it exceeds the set parameter, opens an order in the opposite direction from the calculated price. Pairs are specifies in the EA's settings. It has the trailing stop function. You can also set a trading day (for D1, W1) and day of closing open orders. Specify trading type in settings: all pairs or by the largest candle body . Manual tests of the strategy using "b
      Fibonacci theft   is an ultrascalping system that uses Fibonacci levels to launch a scalping system that allows   theft     a few pips from the market. This system allows the use of fibonacci levels, predetermined levels or a level chosen by the user. It also presents the option of using or not volume and impulse filters. Being a very aggressive scalping system, it should only be used in pairs with a low spread and low commissions. This system is suitable for small accounts and can be used wi
      MaxProfitDz v4
      Hafis Mohamed Yacine
      MaxProfitDZ Expert adviser MaxProfitDz v1.4     Recommendations Symbol: ALL PAIRS ..i Recommended    EURUSD. Time Frame:1M. Brokers: ALL brokers .  low spread/commission, 1:500 leverage Minimum Deposit Recommended :   $500 USD  Lot Size for 500$   : 0.01  Use a broker with good execution and with a spread of 0.1-2 points. A very fast VPS is required Parameters EA TrendON=true (Read the  note ) MMType = 2 LotMultiplikator = 1 LotConst_or_not = TRUE Take profit :5-10 pips  for accounts with fi
      이 제품의 구매자들이 또한 구매함
      Gann Made Easy
      Oleg Rodin
      4.88 (100)
      Gann Made Easy 는 mr.의 이론을 사용하여 최고의 거래 원칙을 기반으로 하는 전문적이고 사용하기 쉬운 Forex 거래 시스템입니다. W.D. 간. 이 표시기는 Stop Loss 및 Take Profit Levels를 포함하여 정확한 BUY 및 SELL 신호를 제공합니다. PUSH 알림을 사용하여 이동 중에도 거래할 수 있습니다. 구매 후 연락주세요! 내 거래 팁과 훌륭한 보너스 지표를 무료로 공유하겠습니다! 아마도 Gann 거래 방법에 대해 이미 여러 번 들었을 것입니다. 일반적으로 Gann의 이론은 초보자 거래자뿐만 아니라 이미 거래 경험이 있는 사람들에게도 매우 복잡한 것입니다. Gann의 거래 방식은 이론적으로 적용하기 쉽지 않기 때문입니다. 나는 그 지식을 연마하고 Forex 지표에 최고의 원칙을 적용하기 위해 몇 년을 보냈습니다. 표시기는 적용하기가 매우 쉽습니다. 차트에 첨부하고 간단한 거래 권장 사항을 따르기만 하면 됩니다. 지표는 지속적으로 시장 분석 작업
      Trend Punch
      Mohamed Hassan
      4.92 (24)
      This indicator is unstoppable when combined with our other indicator called  Support & Resistance . After purchase, send us a message and you will get it   for  FREE as a BONUS! Introducing Trend Punch , the revolutionary forex trend indicator that will transform the way you trade! Trend Punch is uniquely designed to provide precise buy and sell arrows during strong market trends, making your trading decisions clearer and more confident. Whether you're trading major currency pairs or exotic sym
      Gold Stuff
      Vasiliy Strukov
      4.9 (270)
      Gold Stuff는 금을 위해 특별히 설계된 추세 지표이며 모든 금융 상품에서도 사용할 수 있습니다. 표시기가 다시 그려지지 않고 지연되지 않습니다. 권장 기간 H1. 표시기에서 완전 자동 Expert Advisor EA Gold Stuff를 작동합니다. 내 프로필에서 찾을 수 있습니다. 설정 및 개인 보너스를 받으려면 구매 후 즉시 저에게 연락하십시오!   강력한 지원 및 트렌드 스캐너 표시기의 무료 사본을 받으실 수 있습니다. 메시지를 보내주세요. 나!   설정 화살표 그리기 - 켜기 끄기. 차트에 화살표 그리기. 경고 - 가청 경고를 끕니다. 이메일 알림 - 켜기 끄기. 이메일 알림. Puch-notification - 켜기 끄기. 푸시 알림. 다음으로 색 영역을 조정합니다. Gold Stuff는 금을 위해 특별히 설계된 추세 지표이며 모든 금융 상품에서도 사용할 수 있습니다. 표시기가 다시 그려지지 않고 지연되지 않습니다. 권장 기간 H1. 표시기에서 완
      FX Power MT4 NG
      Daniel Stein
      5 (13)
      모닝 브리핑 여기 mql5 와 텔레그램에서 FX Power MT4 NG 는 오랫동안 인기 있는 통화 강도 측정기인 FX Power의 차세대 버전입니다. 이 차세대 강도 측정기는 무엇을 제공합니까? 기존 FX Power에서 좋아했던 모든 것 PLUS GOLD/XAU 강도 분석 더욱 정밀한 계산 결과 개별 구성 가능한 분석 기간 더 나은 성능을 위한 사용자 정의 가능한 계산 한도 특별 멀티더 많은 것을보고 싶은 사람들을위한 특별한 다중 인스턴스 설정 모든 차트에서 좋아하는 색상을위한 끝없는 그래픽 설정 수많은 알림 옵션, 중요한 것을 다시는 놓치지 않도록 Windows 11 및 macOS 스타일의 둥근 모서리가 있는 새로운 디자인 마법처럼 움직이는 인디케이터 패널 FX 파워 키 특징 모든 주요 통화의 완전한 강세 이력 모든 시간대에 걸친 통화 강세 이력 모든 브로커 및 차트에서 고유 계산 결과 100% 신뢰할 수있는 실시간100 % 신뢰할 수있는 실시간 계산-> 다시 칠하지 않음
      Apollo Pips PLUS SP
      Oleg Rodin
      5 (3)
      제품을 구매하기 전에 아래 정보를 읽어보세요! Apollo Pips PLUS SP는 독특한 제품입니다! 모든 거래 지표에 액세스할 수 있는 새로운 "APOLLO PIPS" 지표와 "슈퍼 팩" 보너스를 받고 싶은 분들을 위한 것입니다! Apollo Pips PLUS SP 제품을 구매하면 실제로 Apollo Pips 표시기의 완전히 새로운 버전을 구매하게 됩니다. 이 버전의 지표에는 개선된 알고리즘과 사용하기 쉬운 매개변수가 있어 모든 시장 및 거래 스타일에서 지표를 사용할 수 있는 기회를 제공합니다. 이 제품의 구매자는 슈퍼 보너스로 다른 모든 표시기에 무료로 액세스할 수 있습니다! 내 모든 거래 도구에 액세스하고 싶었다면 이 제품이 당신에게 딱 맞습니다! :) 하지만 이것이 전부는 아닙니다! :) 이 제품의 모든 구매자는 또한 내 새로운 지표를 무료로 받을 자격이 있습니다! :) 새로운 거래 지표를 사용할 수 있게 되었는데, 귀하는 저의 특별한 "SUPER PACK" 평생 보너스
      TPSproTREND PrO
      Roman Podpora
      4.79 (19)
      TPSpro TREND PRO는   시장을 자동으로 분석하여 추세와 각 변화에 대한 정보를 제공할 뿐만 아니라 다시 그리지 않고도 거래에 진입할 수 있는 신호를 제공하는 추세 지표입니다! 지표는 각 양초를 사용하여 개별적으로 분석합니다. 다른 임펄스를 언급합니다 - 업 또는 다운 임펄스. 통화, 암호화폐, 금속, 주식, 지수 거래의 정확한 진입점! 버전 MT5                   표시기에 대한 전체 설명       표시기   와 함께 사용하는 것이 좋습니다   -   RFI LEVELS 주요 기능: 렌더링 없이 정확한 입력 신호! 신호가 나타나면 관련성은 유지됩니다! 이는 신호를 제공한 후 변경하여 예금 자금 손실을 초래할 수 있는 다시 그리기 지표와의 중요한 차이점입니다. 이제 더 큰 확률과 정확도로 시장에 진입할 수 있습니다. 화살표가 나타난 후 목표에 도달(이익실현)하거나 반전 신호가 나타날 때까지 캔들을 색칠하는 기능도 있습니다. STOP LOSS / TAK
      Trend Pulse
      Mohamed Hassan
      5 (5)
      Please contact me after purchase to immediately get your PDF strategy + documentation for Trend Pulse !  Official release price of $89  (2 /50 copies left). Next price is $199 . Introducing Trend Pulse , a unique and robust indicator capable of detecting bullish, bearish, and even ranging trends! Trend Pulse uses a special algorithm to filter out market noise with real precision. If the current symbol is moving sideways, Trend Pulse will send you a ranging signal, letting you know that it'
      Scalper Inside PRO
      Alexey Minkov
      4.75 (60)
      An exclusive indicator that utilizes an innovative algorithm to swiftly and accurately determine the market trend. The indicator automatically calculates opening, closing, and profit levels, providing detailed trading statistics. With these features, you can choose the most appropriate trading instrument for the current market conditions. Additionally, you can easily integrate your own arrow indicators into Scalper Inside Pro to quickly evaluate their statistics and profitability. Scalper Inside
      Atomic Analyst
      Issam Kassas
      5 (3)
      우선적으로 언급할 점은이 거래 지표가 다시 그리지 않고 지연되지 않으며 이를 통해 수동 및 로봇 거래 모두에 이상적이라는 점입니다. 사용자 매뉴얼: 설정, 입력 및 전략. Atomic Analyst는 가격의 강도와 모멘텀을 활용하여 시장에서 더 나은 이점을 찾는 PA Price Action Indicator입니다. 고급 필터를 장착하여 잡음과 거짓 신호를 제거하고 거래 잠재력을 높이는 데 도움이 됩니다. 복잡한 지표의 다중 레이어를 사용하여 Atomic Analyst는 차트를 스캔하고 복잡한 수학적 계산을 간단한 신호와 색상으로 변환하여 초보 트레이더가 이해하고 일관된 거래 결정을 내릴 수 있도록합니다. "Atomic Analyst"는 새로운 및 경험이 풍부한 트레이더를위한 종합적인 거래 솔루션입니다. 프리미엄 지표와 최고 수준의 기능을 하나의 거래 전략에 결합하여 모든 종류의 트레이더에 대한 다재다능한 선택지가되었습니다. 인트라데이 거래 및 스캘핑 전략 : 빠르고 정확한
      Trend Screener
      STE S.S.COMPANY
      4.82 (92)
      트렌드 표시기, 트렌드 트레이딩 및 필터링을 위한 획기적인 고유 솔루션, 하나의 도구 안에 내장된 모든 중요한 트렌드 기능! Forex, 상품, 암호 화폐, 지수 및 주식과 같은 모든 기호/도구에 사용할 수 있는 100% 다시 칠하지 않는 다중 시간 프레임 및 다중 통화 표시기입니다. Trend Screener는 차트에 점이 있는 화살표 추세 신호를 제공하는 효율적인 지표 추세 추종 지표입니다. 추세 분석기 표시기에서 사용할 수 있는 기능: 1. 트렌드 스캐너. 2. 최대 이익 분석이 있는 추세선. 3. 추세 통화 강도 측정기. 4. 경고가 있는 추세 반전 점. 5. 경고가 있는 강력한 추세 점. 6. 추세 화살표 Trend Screener Indicator가 있는 일일 분석 예, 일일 신호 성능...등은 여기에서 찾을 수 있습니다.   여기를 클릭하십시오. LIMITED TIME OFFER : Trend Screener Indicator는 50 $ 및 평생 동안만 사용할 수 있
      Currency Strength Wizard
      Oleg Rodin
      4.92 (52)
      통화 강도 마법사는 성공적인 거래를 위한 올인원 솔루션을 제공하는 매우 강력한 지표입니다. 표시기는 여러 시간 프레임의 모든 통화 데이터를 사용하여 이 또는 해당 외환 쌍의 힘을 계산합니다. 이 데이터는 특정 통화의 힘을 확인하는 데 사용할 수 있는 사용하기 쉬운 통화 지수 및 통화 전력선의 형태로 표시됩니다. 필요한 것은 거래하려는 차트에 표시기를 부착하는 것뿐입니다. 표시기는 거래하는 통화의 실제 강세를 보여줍니다. 지표는 또한 추세와 거래할 때 유리하게 사용할 수 있는 구매 및 판매 거래량 압력의 극한값을 보여줍니다. 지표는 또한 피보나치에 기반한 가능한 대상을 보여줍니다. 표시기는 PUSH 알림을 포함한 모든 유형의 알림을 제공합니다. 구매 후 연락주세요. 나는 당신과 거래 팁을 공유하고 당신에게 무료로 훌륭한 보너스 지표를 줄 것입니다! 나는 당신에게 행복하고 유익한 거래를 기원합니다!
      현재 20% 할인 ! 초보자 또는 전문가 트레이더를 위한 최고의 솔루션! 이 대시보드 소프트웨어는 28개의 통화 쌍에서 작동합니다. 2가지 주요 지표(Advanced Currency Strength 28 및 Advanced Currency Impulse)를 기반으로 합니다. 전체 Forex 시장에 대한 훌륭한 개요를 제공합니다. 고급 통화 강도 값, 통화 이동 속도 및 모든(9) 시간대의 28 Forex 쌍에 대한 신호를 보여줍니다. 추세 및/또는 스캘핑 기회를 정확히 파악하기 위해 차트의 단일 지표를 사용하여 전체 시장을 볼 수 있을 때 거래가 어떻게 개선될지 상상해 보십시오! 잠재적인 거래를 식별하고 확인하면서 강력한 통화와 약한 통화를 더욱 쉽게 식별할 수 있도록 이 지표에 기능을 내장했습니다. 이 표시기는 통화의 강세 또는 약세가 증가 또는 감소하는지 여부와 모든 시간대에서 수행되는 방식을 그래픽으로 보여줍니다. 추가된 새로운 기능은 현재 시장 조건 변화에 적
      Clear Breakout
      Martin Alejandro Bamonte
      5 (1)
      "Breakout Buy-Sell" 지표는 다양한 시장 세션(도쿄, 런던, 뉴욕) 동안 가격 돌파를 기반으로 매수 및 매도 기회를 식별하고 강조하도록 설계되었습니다. 이 지표는 트레이더가 매수 및 매도 영역뿐만 아니라 이익 실현(TP) 및 손절매(SL) 수준을 명확하게 시각화하는 데 도움이 됩니다. 사용 전략 이 지표는 다음과 같이 사용할 수 있습니다: 초기 설정 : 시장 세션을 선택하고 GMT 오프셋을 조정합니다. 시장 시각화 : 각 세션 시작 시 그려지는 돌파 상자를 관찰합니다. 이러한 상자는 기간의 최고점과 최저점을 나타냅니다. 매수 및 매도 신호 : 상자의 최고점을 초과하는 돌파는 매수 신호로 간주됩니다. 최저점을 밑도는 돌파는 매도 신호로 간주됩니다. 위험 관리 : TP1, TP2, TP3 및 SL 수준을 사용하여 포지션을 관리합니다. TP 수준은 다양한 수익 목표를 위해 설계되었으며 SL은 불리한 움직임으로부터 보호를 보장합니다. 적용 전략 이 지표를 최대한 활용하기 위해
      Advanced Currency Strength28 Indicator
      Bernhard Schweigert
      4.91 (667)
      현재 26% 할인 초보자 또는 전문가 트레이더를 위한 최고의 솔루션! 이 지표는 우리가 독점 기능과 새로운 공식을 통합했기 때문에 독특하고 고품질이며 저렴한 거래 도구입니다. 단 하나의 차트로 28 Forex 쌍의 통화 강도를 읽을 수 있습니다! 새로운 추세 또는 스캘핑 기회의 정확한 트리거 포인트를 정확히 찾아낼 수 있기 때문에 거래가 어떻게 개선될지 상상해 보십시오. 사용 설명서: 여기를 클릭  https://www.mql5.com/en/blogs/post/697384 그것이 첫 번째, 원본입니다! 쓸모없는 지망생 클론을 사지 마십시오. 더 스페셜  강력한 통화 모멘텀을 보여주는 하위 창의 화살표 GAP가 거래를 안내합니다! 기본 또는 호가 통화가 과매도/과매도 영역(외부 시장 피보나치 수준)에 있을 때 개별 차트의 기본 창에 경고 표시가 나타납니다. 통화 강도가 외부 범위에서 떨어질 때 풀백/반전 경고. 교차 패턴의 특별 경고 추세를 빠르게 볼 수 있는
      PRO Renko System
      Oleg Rodin
      5 (26)
      PRO Renko System 은 RENKO 차트 거래를 위해 특별히 고안된 매우 정확한 거래 시스템입니다. 이것은 다양한 거래 상품에 적용될 수있는 보편적 인 시스템입니다. 체계는 효과적으로 당신에게 정확한 반전 신호에 접근을 주는 소위 시장 소음을 중화합니다. 이 표시기는 사용하기가 매우 쉽고 신호 생성을 담당하는 매개 변수가 하나만 있습니다. 당신은 쉽게 당신의 선택의 어떤 무역 계기에 공구를 적응시킬 수 있고 renko 막대기의 크기. 나는 항상 당신이 내 소프트웨어로 수익성있게 거래 할 수 있도록 추가 지원을 제공 할 준비가되어 있습니다! 나는 당신에게 행복하고 수익성있는 거래를 기원합니다! 구매 후 저에게 연락하십시오! 내 렌코 차트 생성기를 보내드립니다. 또한 내 개인 권장 사항 및 시스템의 다른 모듈을 무료로 공유 할 것입니다!
      Gold Channel XAUUSD
      Paulo Rocha
      5 (2)
      Gold Channel is a volatility-based indicator, developed with a specific timing algorithm for the XAUUSD pair, which consists of finding possible corrections in the market. This indicator shows two outer lines, an inner line (retracement line) and an arrow sign, where the theory of the channel is to help identify overbought and oversold conditions in the market. The market price will generally fall between the boundaries of the channel. If prices touch or move outside the channel it is a tra
      우선적으로, 이 거래 도구는 전문적인 거래에 이상적인 비-다시 그리기 및 지연되지 않는 지표입니다.  온라인 강좌, 사용자 매뉴얼 및 데모. 스마트 가격 액션 컨셉트 인디케이터는 신규 및 경험 많은 트레이더 모두에게 매우 강력한 도구입니다. Inner Circle Trader Analysis 및 Smart Money Concepts Trading Strategies와 같은 고급 거래 아이디어를 결합하여 20가지 이상의 유용한 지표를 하나로 결합합니다. 이 인디케이터는 스마트 머니 컨셉트에 중점을 두어 대형 기관의 거래 방식을 제공하고 이동을 예측하는 데 도움을 줍니다.  특히 유동성 분석에 뛰어나 기관이 어떻게 거래하는지 이해하는 데 도움을 줍니다. 시장 트렌드를 예측하고 가격 변동을 신중하게 분석하는 데 탁월합니다. 귀하의 거래를 기관 전략에 맞추어 시장의 동향에 대해 더 정확한 예측을 할 수 있습니다. 이 인디케이터는 시장 구조를 분석하고 중요한 주문 블록을 식별하고 다양한
      Advanced Currency IMPULSE with ALERT
      Bernhard Schweigert
      4.91 (495)
      현재 31% 할인!! 초보자 또는 전문가 트레이더를 위한 최고의 솔루션! 이 지표는 우리가 독점 기능과 비밀 공식을 통합했기 때문에 독특하고 고품질이며 저렴한 거래 도구입니다. 단 하나의 차트로 28개 통화 쌍 모두에 대한 경고를 제공합니다. 새로운 추세 또는 스캘핑 기회의 정확한 트리거 포인트를 정확히 찾아낼 수 있기 때문에 거래가 어떻게 개선될지 상상해 보십시오! 새로운 기본 알고리즘을 기반으로 구축되어 잠재적인 거래를 훨씬 더 쉽게 식별하고 확인할 수 있습니다. 이는 통화의 강세 또는 약세가 가속되는지 여부를 그래픽으로 표시하고 가속 속도를 측정하기 때문입니다. 자동차의 속도계처럼 생각하면 됩니다. 가속화할 때 Forex 시장에서 동일한 일이 분명히 더 빠르게 발생합니다. 즉, 반대 방향으로 가속화되는 통화를 페어링하면 잠재적으로 수익성 있는 거래를 식별한 것입니다. 통화 모멘텀의 수직선과 화살표가 거래를 안내합니다! 역동적인 Market Fibonacci 23
      NAM Order Blocks
      NAM TECH GROUP, CORP.
      5 (1)
      MT4 Multi-timeframe Order Blocks detection indicator. Features - Fully customizable on chart control panel, provides complete interaction. - Hide and show control panel wherever you want. - Detect OBs on multiple timeframes. - Select OBs quantity to display. - Different OBs user interface. - Different filters on OBs. - OB proximity alert. - ADR High and Low lines. - Notification service (Screen alerts | Push notifications). Summary Order block is a market behavior that indicates order collection
      RelicusRoad Pro
      Relicus LLC
      4.73 (141)
      이제 $ 147 (몇 가지 업데이트 후 $ 499 증가) - 무제한 계정 (PCS 또는 MACS) RelicusRoad 사용 설명서 + 교육 비디오 + 비공개 Discord 그룹 액세스 + VIP 상태 시장을 보는 새로운 방법 RelicusRoad는 외환, 선물, 암호화폐, 주식 및 지수에 대한 세계에서 가장 강력한 거래 지표로서 거래자에게 수익성을 유지하는 데 필요한 모든 정보와 도구를 제공합니다. 우리는 초보자부터 고급까지 모든 거래자가 성공할 수 있도록 기술적 분석 및 거래 계획을 제공합니다. 미래 시장을 예측할 수 있는 충분한 정보를 제공하는 핵심 거래 지표입니다. 우리는 차트에서 말이 안 되는 여러 지표 대신 완전한 솔루션을 믿습니다. 타의 추종을 불허하는 매우 정확한 신호, 화살표 + 가격 조치 정보를 표시하는 올인원 표시기입니다. 강력한 AI를 기반으로 하는 RelicusRoad는 누락된 정보와 도구를 제공하여 교육하고 성공적인 트레이더인 트레이딩 전문
      PZ Trend Trading
      PZ TRADING SLU
      4.8 (5)
      Capture every opportunity: your go-to indicator for profitable trend trading Special Offer: Purchase now to receive free bonuses worth $159! (Read more for details) Trend Trading is an indicator designed to profit as much as possible from trends taking place in the market, by timing pullbacks and breakouts. It finds trading opportunities by analyzing what the price is doing during established trends. [ Installation Guide | Update Guide | Troubleshooting | FAQ | All Products ] Trade financial
      TPSpro RFI Levels
      Roman Podpora
      4.83 (24)
      Reversal First Impulse levels (RFI)    INSTRUCTIONS        RUS       -       ENG              R ecommended to use with an indicator   -   TPSpro  TREND PRO -  Version MT5 A key element in trading is zones or levels from which decisions to buy or sell a trading instrument are made. Despite attempts by major players to conceal their presence in the market, they inevitably leave traces. Our task was to learn how to identify these traces and interpret them correctly. Main functions: Displaying activ
      Break and Retest
      Mohamed Hassan
      4.17 (18)
      This Indicator only places quality trades when the market is really in your favor with a clear break and retest. Patience is key with this price action strategy! If you want more alert signals per day, you increase the number next to the parameter called: Support & Resistance Sensitivity.  After many months of hard work and dedication, we are extremely proud to present you our  Break and Retest price action indicator created from scratch. One of the most complex indicators that we made with ove
      Order Block Hunter
      Noha Mohamed Fathy Younes Badr
      5 (2)
      Order block hunter indicator is the best indicator for  hunt the order blocks that area where there has been a large concentration of limit orders waiting to be executed Order blocks are identified on a chart by observing previous price action and looking for areas where the price experienced significant movement or sudden changes in direction .This indicator does that for you by using very complicated codes and helps you to take the best areas To buy and sell because it make marks at the best a
      Scalper Vault
      Oleg Rodin
      5 (29)
      Scalper Vault 는 성공적인 스캘핑에 필요한 모든 것을 제공하는 전문 스캘핑 시스템입니다. 이 표시기는 외환 및 바이너리 옵션 거래자가 사용할 수 있는 완전한 거래 시스템입니다. 권장 시간 프레임은 M5입니다. 시스템은 추세 방향으로 정확한 화살표 신호를 제공합니다. 또한 상단 및 하단 신호와 Gann 시장 수준을 제공합니다.  이 시스템은 사용하기가 매우 쉽습니다. 원하는 시장 지역의 화살표만 따라가면 됩니다. 엑시트는 가격이 적정 수준에 도달하거나 시장의 고점 또는 저점 신호가 나타날 때 수행됩니다.  표시기는 PUSH 알림을 포함한 모든 유형의 경고를 제공합니다. 인디케이터 구매 후 연락주세요. 내 개인 거래 권장 사항과 훌륭한 보너스 지표를 무료로 공유합니다! 나는 당신에게 행복하고 유익한 거래를 기원합니다!
      M1 Arrow
      Oleg Rodin
      4.73 (15)
      시장의 두 가지 기본 원칙에 기반한 일중 전략. 알고리즘은 추가 필터를 사용하여 거래량 및 가격 파동 분석을 기반으로 합니다. 지표의 지능형 알고리즘은 두 가지 시장 요인이 하나로 결합될 때만 신호를 제공합니다. 지표는 더 높은 시간 프레임의 데이터를 사용하여 M1 차트에서 특정 범위의 파도를 계산합니다. 그리고 파동을 확인하기 위해 지표는 볼륨 분석을 사용합니다. 이 표시기는 준비된 거래 시스템입니다. 트레이더가 필요로 하는 모든 것은 신호를 따르는 것입니다. 또한 지표는 자신의 거래 시스템의 기초가 될 수 있습니다. 거래는 분 차트에서만 수행됩니다. 지표가 MTF 원리를 사용한다는 사실에도 불구하고 지표 알고리즘은 가능한 한 안정적입니다. 구매 후 반드시 저에게 편지를 보내주세요! 내 거래 설정 및 권장 사항을 공유하겠습니다!
      Backtest and Read Overview before purchase. Chart patterns have been a topic of debate among traders; some believe they are reliable signalers, while others do not. Our Chart Patterns All-in-One indicator displays various chart patterns to help you test these theories for yourself. The profitability of these patterns is not a reflection of the indicator's effectiveness but rather an evaluation of the patterns themselves. The Chart Patterns All-in-One indicator is an excellent tool for visualizin
      Advanced Supply Demand
      Bernhard Schweigert
      4.9 (314)
      현재 33% 할인! 초보자나 전문 트레이더를 위한 최고의 솔루션! 이 보조지표는 우리가 다수의 독창적 기능과 새로운 공식을 통합한 독특하고 고품질이며 저렴한 거래 도구입니다. 이 업데이트를 통해 이중 시간대를 표시할 수 있습니다. 더 높은 TF를 표시할 수 있을 뿐만 아니라 차트 TF와 더 높은 TF 모두를 표시할 수 있습니다: 중첩 영역 표시. 모든 Supply Demand 트레이더들이 좋아할 것입니다. :) 중요한 정보 공개 Advanced Supply Demand의 잠재력을 극대화하려면 다음을 방문하십시오. https://www.mql5.com/ko/blogs/post/720245   진입 또는 목표의 명확한 트리거 포인트를 정확히 찾아냄으로 해서 거래가 어떻게 개선될지 상상해 보십시오. 새로운 알고리즘을 기반으로 매수자와 매도자 간의 잠재적인 불균형을 훨씬 더 쉽게 분간할 수 있습니다. 왜냐하면 가장 강한 공급영역과 가장 강한 수요 영역과 과거에 어떻게 진행 되었는지를(이
      AW Trend Predictor
      AW Trading Software Limited
      4.74 (39)
      하나의 시스템에서 추세와 고장 수준의 조합입니다. 고급 지표 알고리즘은 시장 노이즈를 필터링하고 추세, 진입점 및 가능한 출구 수준을 결정합니다. 표시기 신호는 통계 모듈에 기록되어 가장 적합한 도구를 선택하여 신호 기록의 효율성을 보여줍니다. 이 표시기는 이익 실현 및 손절매 표시를 계산합니다. 매뉴얼 및 설명 ->   여기   / MT5 버전 ->   여기 지표로 거래하는 방법: Trend Predictor로 거래하는 것은 3단계로 간단합니다. 1단계 - 포지션 열기 70% 이상의 성공률로 매수 신호를 받았습니다. 2단계 - StopLoss 결정 반대 신호로 트렁크 선택 3단계 - 이익 실현 전략 정의 전략 1: TP1 도달 시 전체 포지션 청산 전략 2: TP1 도달 시 포지션의 50% 청산 및 TP2 도달 시 나머지 50% 청산 전략 3: 추세 반전 시 전체 포지션 청산 이익: 결과를 다시 그리지 않음, 신호는 엄격하게 양초가 닫힐 때 어드바이저에서 사용할 수 있습니다. 이
      Connect Indicator
      Sukunthakan Ngernbamrung
      Connect Indicator is a tool used for connecting indicators between the MQL market and MT4. The connected indicators are made by our group and can be used for other applications, such as sending messages to the Line application or Telegram application. If you have any questions, please don't hesitate to ask us to receive support. Function and indicator buffer Buffer one is the high price of the previous candle. Buffer two is the high price of the previous candle. Usage To connect indicators to fu
      제작자의 제품 더 보기
      Average Daily Weekly Monthly Range Alerts. The most complete multi-period dynamic range indicator with full alert options. Visually displays the Average Range lines on chart + real time distances to the Range Highs and Lows. Notifications are sent when the average ranges are hit. An essential tool for any serious trader! Average period ranges, especially the ADR (Average Daily Range) for day traders, are one of the most useful and consistently reliable indicators available to traders. Always a
      Gives the average times of the High of The Day and Low of The Day + the ADR over 2 different look back periods. Every day there is a High of the Day and a Low of the Day, and the distance between them is the ADR (Average Daily Range). If you are trading reversals at the first High/Low of the Day for high Reward:Risk trading, it’s useful to know the Morning Reversal time. If you are trading the End of Day Reversal back into the range after the ADR has been hit at the opposing High/Low of the Day,
      필터:
      리뷰 없음
      리뷰 답변
      버전 1.2 2022.11.12
      Changed the default setting VOLATILITY BARS AFTER LINE = 1 to allow the user to simply change timeframes in order to quickly find the expected price movement / average volatility over the next 1 MIN / 5 MIN / 15 MIN / 30 MIN / 1 HOUR / 4 HOURS / DAY / WEEK / MONTH after each vertical line. Edit this setting for other custom volatility periods depending on the chart timeframe (e.g. 20 minutes volatility = 20 VOLATILITY BARS on M1 / 4 VOLATILITY BARS on M5)...