• 미리보기
  • 리뷰
  • 코멘트

Trend Ranger XO

Аттракцион невиданной щедрости - треть цены!

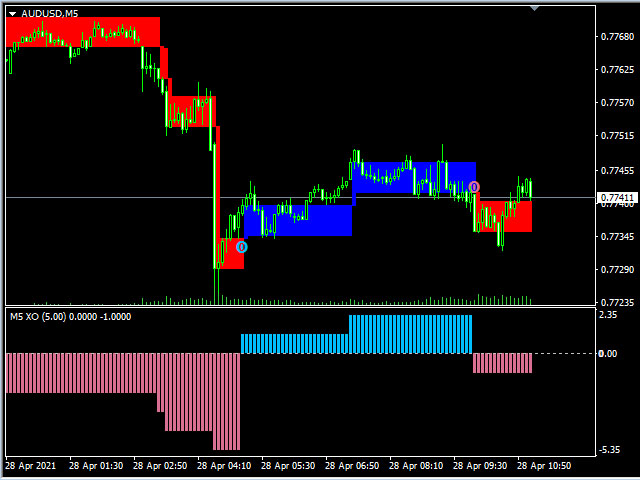
Индикатор отображает на графике другой популярный индикатор XO, представленный на рисунке в подвале.

Важно! Сигнальным является 0 бар - не перекрашивается! 

Параметры индикатора:

Zone Range (Pips) - размер зоны в пипсах без учета количества знаков;

Line or Histogram Width - ширина линий или гистограммы;   

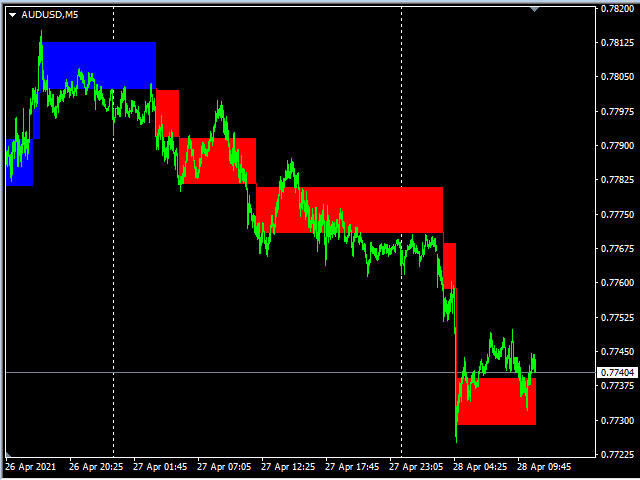
Zone Draw Type - способ отрисовки зон: в виде гистограммы или линий на графике;

Up Zone Color -  цвет зоны BUY;

Down Zone Color - цвет зоны SELL;

AlertsMessage - включение вывода сообщения о смене тенденции;        

AlertsEmail - включение отправки письма о смене тенденции;       

AlertsMobile - включение отправки Push сообщения о смене тенденции ;       

AlertsSound - включение звукового оповещения о смене тенденции;       

SoundFile - имя файла для звукового оповещения, по умолчанию "alert.wav".

추천 제품
This indicator works on MT4 and is very easy to use. When you receive a signal from it, you wait for that candle with the signal to close and you enter your trade at the beginning of the next new candle . A red arrow means sell and a green arrow means buy. All arrows comes with Alert  like for easy identification of trade signal. Are you okay with that? 1 minute candle 1 minute expire
The King of Forex Trend Cloud Indicator is a trend following indicator based on moving averages. The Indicator is meant to Capture both the beginning and the end of a trend. This indicator can be used to predict both short and long terms market trends.  The king of Forex Trend Cloud if paired together with the King of Forex Trend Indicator can give a broad picture in market analysis and forecasts. I have attached images for both the  The king of Forex Trend Cloud on its own and  The king of Fore
Trend Flasher
Amarnath K M
Trend Flasher Trend is your friend is the age old saying quote in trading arena, there are though many ways to gauge the trend and its direction, more scientific measure and logically meaningful will be an ATR break outs to identify and spot the trend and its acceleration, so we created this easy to use trend identification panel and optimized super trend based multi time frame panel entry system to aid and help the traders to make their trading decision. Unique Features of Trend Flasher 1. H
This Indicator is use the ZigZag to calculate the Upper and  Lower Bound and the uptrend and the downtrned. Red for downtrend, Green for uptrend and Yellow is for the horizontal trend this horizontal trend also bookmarked the upper limited and the lower limited the the price swings.  Or in simple the Support and the Resistance level. However, You may use the Heikin Ashi to confirm the trend of the buy sell signal above. I cannot guarantee the win rate, Nevertheless, you must study well the timef
Forex 및 바이너리 옵션 성공을 위한 궁극적인 가이드: 비 다시 그리는 XY 트렌드 지표 공개 서론: Forex 및 바이너리 옵션 거래의 역동적인 세계에서 한발 앞선다는 것은 가장 중요합니다. 거래자들은 지속적으로 경쟁력 있는 우위를 제공할 수 있는 도구를 찾고 있으며, 거래 커뮤니티에서 파장을 일으키고 있는 그러한 강력한 도구 중 하나는 "비 다시 그리는 XY 트렌드" 지표입니다. 지표 이해: 비 다시 그리는 XY 트렌드 지표를 다른 지표와 구별하는 핵심 기능 중 하나는 정확성에 대한 약속입니다. 과거 신호를 다시 그려 거래자에게 신뢰할 수 없는 데이터를 남길 수 있는 다른 많은 지표와 달리 이 지표는 무결성을 유지합니다. 거래자는 생성되는 신호에 대해 자신감을 가질 수 있으며 이러한 신호가 과거 가격 움직임을 정확하게 반영하고 있음을 알 수 있습니다. XY 트렌드 지표는 고급 알고리즘을 사용하여 가격 데이터를 분석하고 시장의 트렌드를 식별합니다. 노련한 거래자든 초보 거래자든
Night ghost
Dmitriy Kashevich
Night Ghost - Arrow indicator for binary options. This is a reliable assistant to you in the future! - No redrawing on the chart -Works great on EUR/USD currency pairs! -Indicator accuracy up to 90% (Especially at night) -No long setup required (Perfectly set up for Binary Options) - Not late signals - The appearance of a signal on the current candle -Perfect for M1 period (No More!) - Eye-friendly candle color (Red and Blue) -Installed Alert Working with it: - Blue arrow shows signa
Binary Option Signal
Yaroslav Varankin
Indicator for binary options arrow is easy to use and does not require configuration works on all currency pairs, cryptocurrencies buy signal blue up arrow sell signal red down arrow tips do not trade during news and 15-30 minutes before their release, as the market is too volatile and there is a lot of noise it is worth entering trades one or two candles from the current period (recommended for 1 candle) timeframe up to m 15 recommended money management fixed lot or fixed percentage of the depo
Crypto_Forex 지표 "CHANNEL of FRACTALS" for MT4. - 이 지표는 프랙탈의 고점/저점을 기반으로 실제 로컬 트렌드 라인을 보여줍니다. - 그래픽 분석을 사용하는 트레이더에게 좋습니다. - 저항 로컬 트렌드 라인 - 빨간색 - 지원 로컬 트렌드 라인 - 파란색 - 프랙탈 수, 트렌드 라인 색상 및 너비를 담당하는 매개변수가 거의 없습니다. - 지표는 현재 시장 상황을 감지하는 데 좋습니다. - 강세 시장 상황 - 두 선이 모두 상승할 때. - 약세 시장 상황 - 두 선이 모두 하락할 때. - 횡보 - 두 선이 반대 방향으로 갈 때. // 훌륭한 트레이딩 로봇과 지표는 여기에서 제공됩니다: https://www.mql5.com/en/users/def1380/seller 이것은 이 MQL5 웹사이트에서만 제공되는 오리지널 제품입니다.
Signal From Level
Yaroslav Varankin
Binary Options Support Resistance Indicator This indicator is designed for binary options trading and effectively shows retracements from support and resistance levels. Signals appear on the current candle. A red arrow pointing downwards indicates a potential selling opportunity, while a blue arrow pointing upwards suggests buying opportunities. All that needs adjustment is the color of the signal arrows. It is recommended to use it on the M1-M5 timeframes as signals are frequent on these timef
Swing Master Indicator
Elias Mtwenge
5 (1)
Dear Traders this is my another tool called " Swing Master Indicator ". As the name above the indicator is designed to help you in swing trading by capturing the low and highs of the price. You may us this tool with any trading strategy and style from scalping to position trading. It is made for level of traders including newbies and advanced traders even prop-firms, hedge funds and banks to help them make sold market analysis. I create tools for serious traders who want to make a difference in
ADM Multiframe
Dmitriy Susloparov
ADM Oscillator Multiframe Unlike the classic indicator " Average Direction Movement index ", this indicator shows directly the difference between the +DI and -DI values. When +DI is greater than -DI results above zero and vice versa. This is more visual and, in addition, allows you to clearly see the interaction of indicator readings for different timeframes. It also uses a proprietary technology that allows you to see different timeframes simultaneously on a single time scale. For example, fo
브레이크아웃 프로 스캘퍼 솔루션 이 표시기는 RPTrade Pro 솔루션 시스템의 일부입니다. Breakout Pro Scalper Solution은 Price Action, Dynamic Support 및 Resistance를 사용하는 일일 추세 지표입니다. 누구나 사용할 수 있도록 설계되었으며 거래의 절대 초보자도 사용할 수 있습니다. 다시 칠하지 마십시오. 표시는 닫기에서 닫기로 제공됩니다. 단독으로 사용하도록 설계되어 다른 표시기가 필요하지 않습니다. 당신에게 하루의 시작에 추세와 잠재적인 이익실현을 제공합니다. 특정 그래프는 이력 데이터에 따른 잠재적 이익을 보여줍니다. 어떻게 작동합니까 Breakout Pro Scalper Solution은 가격 조치 및 동적 지원 및 저항과 결합된 브레이크아웃 전략을 사용합니다. 야간 추세와 변동성은 다음날에 사용할 것으로 분석됩니다. 이 분석에서 브레이크아웃 한계(파란색 및 진한 주황색 선)와 이익실현(Take Profit)이
Naked Forex Kangaroo Tail Pro Indicator Kangaroo Tail Pro Indicator is a pattern recognition indicator for Forex, Stocks, Indices, Futures, Commodities and Cryptos. The Kangaroo Tail is a multi-bar pattern. The Kangaroo Tail pattern is very effective and is very simple to trade. The strategy that comes with the Kangaroo Tail is based on price action. The indicator does what it was designed for: displaying Kangaroo Tail patterns.   Don't expect to follow the up and down arrows and make money
Trend Line Chart Pattern Signals  Is a traders Tool for Signals based on Strong  Patterns Formed By a pair of robust trend lines. They FOR WITH DIFFERENT POPULAR PATTERNS ON CHARTS LIKE – TRIANGLES, FLAGS,RANGE , ASCENDING TRIANGLES, DESCENDING PATTERNS, PENNANTS ETC. The TREND LINES  form  dynamically  on running bars. The  sensitivity  of the trend lines can be changed by custom settings. The  Buy and Sell Signals Generate upon Break Of the Trend Line + "Close" of the same bar above the previo
Supply and Demand Dashboard PRO
Bernhard Schweigert
4.8 (20)
현재 20% 할인! 이 대시보드는 여러 기호와 최대 9개의 타임프레임에서 작동하는 매우 강력한 소프트웨어입니다. 주요 지표(최상의 리뷰: 고급 공급 수요)를 기반으로 합니다.   Advanced Supply Demand 대시보드는 훌륭한 개요를 제공합니다. 다음과 같이 표시됩니다.  영역 강도 등급을 포함하여 필터링된 공급 및 수요 값, 영역에 대한/및 영역 내 Pips 거리, 중첩된 영역을 강조 표시하고 모든 (9) 시간 프레임에서 선택한 기호에 대해 4가지 종류의 경고를 제공합니다. 그것은 당신의 개인적인 필요에 맞게 고도로 구성 가능합니다! 당신의 혜택! 모든 트레이더에게 가장 중요한 질문: 시장에 진입하기에 가장 좋은 수준은 무엇입니까? 최고의 성공 기회와 위험/보상을 얻으려면 강력한 공급/수요 영역 내 또는 그 근처에서 거래를 시작하십시오. 손절매를 위한 최적의 장소는 어디입니까? 가장 안전하려면 강력한 수요/공급 구역 아래/위에 정류장을 두십시오.
Urgently
Tatiana Savkevych
The Urgently indicator is designed to quickly determine the situation in the market, reflect the state of the market and signal profitable levels for opening trades. Market conditions change quickly enough, requiring constant calibration of trading strategies. Recommended for use in conjunction with any of the oscillators. The Urgently forex market trend indicator shows the trend direction and entry points. It smooths out price fluctuations when generating a signal by averaging the data and the
MFI Pointer is an indicator based on Money Flow Index indicator that uses both price and volume to measure buying and selling pressure. Money Flow Index is also known as volume-weighted RSI . MFI Pointer simply draws arrows on chart window when value of Money Flow Index (from parameter MFI_Period) is below MFI_Level (green upward pointing arrow) or above 100-MFI_Level (red downward pointing arrow). Indicator works on all timeframes and all currency pairs, commodities, indices, stocks etc. MFI Po
OFFER!   OFFER ! After 3 weeks the unlimited price will be 500$ and in the future you will regret why you didn't make a purchase at this lowest price. Dear Traders, the atomic power Entries Indicator is one of the indicators that if used wisely and correctly can help you to find an edge over the market.  The indicator will work for all forex pairs, all markets and all timeframes. Still it is your duty to find the most effective timeframe for you. When the sell or buy arrow appears you will get a
Mk R
Can Pei Pu
MK_R It is based on contrary patterns for EURUSD.  Basically, it will entry using the condition of 1 buy wave and 6 sell wave of Granville's law. The EA does not use indicators, grid, martingale, arbitrage.  The EA has been proven to be profitable in the six months of 2020 and is particularly suitable for the current EURUSD market since mid-December 2020. Monitoring: https://www.mql5.com/en/signals/789229 Timeframe is M5. EA needs M1 chart,M5 chart,M15 Chart,H1 chart,H4 chart. Maxium Spread
The indicator scans for stop grabber (special pattern of Joe Dinapoli which gives very high probability buy / sell signals and does not repaint ) signals in multiple timeframes for the all markets filtered and shows the results on Dashboard. Key Features Dashboard can be used for all markets It can scan for stop grabber pattern on MN1, W1, D1, H4, H1, M30, M15 ,M5, M1 timeframes Parameters UseMarketWatch: Set true to copy all symbols available in market watch MarketWatchCount : Set the number
Key level wedge pro
Presley Annais Tatenda Meck
5 (1)
We have combined all of our beloved indicators the likes of: Key level order block , Key level supply and demand , Key level liquidity grab and Key level wedge into one single indicator and dashboard. Whats new Dashboard : There is an easy access dashboard for all your needs. Multi-timeframe button : There is now a multi-timeframe option for Order Blocks and Supply and demand zones, making it easy to see higher timeframe zones easily on the current timeframe by just clicking the desired timefra
POWER TO GET WEALTHY TRADING SYSTEMS.  NON REPAINT REVERSAL ARROW AND CHANNEL  Intra-Day trading and Scalping Strategy:   Designed for fast and accurate day trading and short-term trades. Day and Swing Trading Strategy:   Can be used as a reliable tool for day and swing traders who aim for the big moves of the price. Multi Currencies and Markets:   Works on different instruments and markets with its reliable precision. Multi Timeframes:   Can be used on multiple timeframes with good performanc
Market Secret
Ramzi Abuwarda
세계적인 바이너리 옵션 거래에서는 정확한 시장 분석과 전략적인 의사 결정이 핵심입니다. 수익성 있는 기회를 찾아내는 뛰어난 거래 지표를 찾는 여정은 끝이 없습니다. 비밀 지표(Secret Indicator)가 등장합니다 - 최고이며 강력한 MT4 바이너리 옵션 거래 도구로서의 명성을 얻은 주목할 만한 도구입니다. 비밀 지표는 경험있는 트레이더와 전문 프로그래머들로 구성된 팀에 의해 수년간의 세심한 연구, 개발 및 테스트를 통해 만들어졌습니다. 독특한 알고리즘과 고급 수학적 모델은 바이너리 옵션의 빠른 속도로 변동하는 세계에서 트레이더에게 무적의 이점을 제공하기 위해 정교하게 조정되었습니다. 비밀 지표를 다른 거래 지표와 구분 짓는 특징은 놀라운 정확도로 수익성 있는 거래 기회를 발견하는 능력입니다. 이 신호는 강력한 기술적 지표, 가격 행동 분석 및 시장 감성 평가의 조합에서 유도됩니다. 이 다각적 접근법은 비밀 지표가 단기 변동과 장기 추세 모두를 포착하여 트레이더에게 시장의
Reback
Yazhou Liu
This index can be traced back to historical transactions, and can clearly see the trading location, trading type, profit and loss situation, as well as statistical information. Showlabel is used to display statistics. Summy_from is the start time of order statistics. This parameter is based on the opening time of the order. Backtracking can help us to correct the wrong trading habits, which is very important for beginners to learn manual transactions. This index is suitable for each time per
Liquidity Buy Sell Signal
Filip Maurice Daelman
Liquidity Buy Sell Signal Indicator is a no-nonsense, no delay, no repaint indicator ! Liquidity pools together with a trend filter is the most powerful and reliable signal according to me (with the correct parameters depending on the timeframe used) It selects buy/sell entry signals based on liquidity in the market. The time range to scan for liquidity can be set in the parameters. Liquidity is an important aspect in the market, especially for institutional investors, as they need lots of liqu
True Magic Oscillator
Muhammed Emin Ugur
The   True Magic Oscillator   indicator is designed for signal trading. This indicator generates trend signals. It uses many algorithms and indicators to generate this signal. It tries to generate signals from the points with the highest trend potential. This indicator is a complete trading product. This indicator does not need any additional indicators. The indicator is never repainted. The point at which the signal is given does not change.         Features and Recommendations Works wit
Alpha Trend sign has been a very popular trading tool in our company for a long time. It can verify our trading system and clearly indicate trading signals, and the signals will not drift. Main functions: Based on the market display of active areas, indicators can be used to intuitively determine whether the current market trend belongs to a trend market or a volatile market. And enter the market according to the indicator arrows, with green arrows indicating buy and red arrows indicating se
Two Candles to Glory
Ellan Dirgantara Tholkhah
This is a Binary Options signal indicator. Extremely powerful for the 1 min chart. The signals are based on my personal tweak (based on real trial and error & backtested) of the RSI, ADX and Ichimoku and my observation on how price moves. It turns out, 2 candles expiry is the most consistent with this set up. How to use: 1. Wait for arrow signal to show. 2. Place a 2 candle expiry right after the close of the signal candle. So if you are trading a 1 min chart, place an expiry for 2 mins... if yo
Magic Reversion Indicator
Giordano Bruno Rodrigues Machado
Indicator that indicate where the best point of reverse market.This indicator is a reactive or lagging signal, because the strategy uses a formation of an odd number of bars being the middle bar the highest or lowest in the formation, and the indicator draws when the all bars in the fractal close. However, traders with a pre-existing directional bias will find this indicator extremely useful, picking up early entry points.This indicator is not a boiled-down signals indicator nor a complete tradi
"Adjustable Fractals"는 프랙탈 지표의 고급 버전으로, 매우 유용한 거래 도구입니다! - 알다시피 표준 프랙탈 mt4 지표에는 설정이 전혀 없습니다. 이는 거래자에게 매우 불편합니다. - Adjustable Fractals는 이 문제를 해결했습니다. 필요한 모든 설정이 있습니다. - 지표의 조정 가능한 기간(권장 값 - 7 이상). - 가격의 고점/저점으로부터 조정 가능한 거리. - 프랙탈 화살표의 조정 가능한 디자인. - 표시기에는 모바일 및 PC 알림 기능이 내장되어 있습니다. // 뛰어난 트레이딩 로봇과 지표는 여기에서 확인할 수 있습니다: https://www.mql5.com/en/users/def1380/seller 이 MQL5 웹사이트에서만 제공되는 오리지널 제품입니다.
이 제품의 구매자들이 또한 구매함
Cycle Maestro
Stefano Frisetti
NOTE: CYCLEMAESTRO is distributed only on this website, there are no other distributors. Demo version is for reference only and is not supported. Full versione is perfectly functional and it is supported CYCLEMAESTRO , the first and only indicator of Cyclic Analysis, useful for giving signals of TRADING, BUY, SELL, STOP LOSS, ADDING. Created on the logic of Serghei Istrati and programmed by Stefano Frisetti ; CYCLEMAESTRO is not an indicator like the others, the challenge was to interpret only t
TrendMaestro
Stefano Frisetti
4 (4)
note: this indicator is for METATRADER4, if you want the version for METATRADER5 this is the link:  https://www.mql5.com/it/market/product/108106 TRENDMAESTRO ver 2.4 TRENDMAESTRO recognizes a new TREND in the bud, he never makes mistakes. The certainty of identifying a new TREND is priceless. DESCRIPTION TRENDMAESTRO identifies a new TREND in the bud, this indicator examines the volatility, volumes and momentum to identify the moment in which there is an explosion of one or more of these data a
System Trend Pro
Aleksandr Makarov
5 (2)
Special offer! https://www.mql5.com/ru/users/bossik2810 System Trend Pro - This is the best trend trading indicator!!! The indicator no repaint!!!  The indicator has   MTF   mode, which adds confidence to trading on the trend (   no repaint   ). How to trade? Everything is very simple, we wait for the first signal (big arrow), then wait for the second signal (small arrow) and enter the market in the direction of the arrow. (See screens 1 and 2.) Exit on the opposite signal or take 20-30 pips,
현재 20% 할인 ! 초보자 또는 전문가 트레이더를 위한 최고의 솔루션! 이 대시보드 소프트웨어는 28개의 통화 쌍에서 작동합니다. 2가지 주요 지표(Advanced Currency Strength 28 및 Advanced Currency Impulse)를 기반으로 합니다. 전체 Forex 시장에 대한 훌륭한 개요를 제공합니다. 고급 통화 강도 값, 통화 이동 속도 및 모든(9) 시간대의 28 Forex 쌍에 대한 신호를 보여줍니다. 추세 및/또는 스캘핑 기회를 정확히 파악하기 위해 차트의 단일 지표를 사용하여 전체 시장을 볼 수 있을 때 거래가 어떻게 개선될지 상상해 보십시오! 잠재적인 거래를 식별하고 확인하면서 강력한 통화와 약한 통화를 더욱 쉽게 식별할 수 있도록 이 지표에 기능을 내장했습니다. 이 표시기는 통화의 강세 또는 약세가 증가 또는 감소하는지 여부와 모든 시간대에서 수행되는 방식을 그래픽으로 보여줍니다. 추가된 새로운 기능은 현재 시장 조건 변화에 적응하는
StalkeR Arrow
Abdulkarim Karazon
5 (3)
StalkeR Arrow는 바 오픈/인트라 바에서 매수 및 매도 신호를 제공하는 화살표 표시기입니다. 이 표시기는 가격 행동 패턴 및 프랙탈을 기반으로 합니다. 이 지표는 각 매수 및 매도 신호에 대해 tp와 sl을 제공하며, tp와 sl은 각 신호 위와 아래에 선 형태로 표시되며 새로운 신호가 형성될 때까지 연장됩니다. 이 표시기에는 기록 신호의 승/패 통계를 제공하는 백테스팅 패널/대시보드가 ​​있으며, 이 표시기는 다시 칠하거나 다시 칠하지 않습니다. 매개변수: StalkeR 기간: 화살표 기간, 숫자가 높을수록 더 적은 수의 신호가 제공됩니다. 스프레드: 포인트 단위의 스프레드 값을 사용하여 패널에서 승패를 계산합니다. 정지손실 ATR x : atr 곱셈의 SL 값 Takeprofit ATR x : atr 곱셈의 TP 값 ATR 기간 : tp 및 sl을 기반으로 계산하는 데 사용되는 atr 기간 TP/SL 라인 색상 및 너비 화살표 색상 및 너비 패널
Dynamic Forex28 Navigator
Bernhard Schweigert
5 (5)
Dynamic Forex28 Navigator - 차세대 외환 거래 도구. 현재 49% 할인. Dynamic Forex28 Navigator는 오랫동안 인기 있는 지표의 진화형으로, 세 가지의 힘을 하나로 결합했습니다. 고급 통화 Strength28 지표(695개 리뷰) + 고급 통화 IMPULSE with ALERT(520개 리뷰) + CS28 콤보 신호(보너스). 지표에 대한 자세한 정보 https://www.mql5.com/en/blogs/post/758844 차세대 Strength 지표는 무엇을 제공합니까?  원래 지표에서 좋아했던 모든 것이 새로운 기능과 더 높은 정확도로 강화되었습니다. 주요 기능: 독점적인 통화 Strength 공식.  모든 시간대에 걸쳐 부드럽고 정확한 강도선. 추세와 정확한 진입을 식별하는 데 이상적입니다. 역동적인 시장 피보나치 수준(시장 피보나치).  이 지표에만 있는 고유한 기능. 가격 차트가 아닌 통화 강도에 피보나치가 적용됩니다.
TPSpro RFI Levels
Roman Podpora
4.85 (27)
주요 플레이어의 반전 구역 / 피크 볼륨 / 활성 구역 =       TS TPS프로시스템 지침 RUS       /       지침       영어       /     Version MT5   이 지표를 구매한 모든 구매자는 또한 다음을 무료로 받습니다. RFI SIGNALS 서비스의 거래 신호에 6개월 동안 액세스할 수 있습니다. TPSproSYSTEM 알고리즘에 따른 즉시 사용 가능한 진입 포인트입니다. 정기적으로 업데이트되는 교육 자료 - 전략에 푹 빠져서 전문가 수준을 높여보세요. 주중 24/5 지원 및 비공개 트레이더 채팅 이용 - 시장 상황에 대한 소통, 지원 및 분석. 저자가 설정한 파일 - 별도의 노력 없이 최대 결과를 얻을 수 있도록 지표를 자동으로 설정합니다. 주요 기능: 판매자와 구매자의 활동 영역을 표시합니다! 이 지표는 매수 및 매도에 대한 모든 올바른 첫 번째 임펄스 레벨/존을 표시합니다. 진입점 검색이 시작되는 이러한 레벨/존이 활성화되면 레벨의 색
Hit Rate Top Bottom Signal
Martin Alejandro Bamonte
히트율 탑 바텀 신호 히트율 탑 바텀 신호 히트율 탑 바텀 신호 는 완전히 혁신적인 접근 방식을 제공합니다. 특정 TP-SL과 PAIR/TF에서 어떤 성과를 내는지 미리 평가하고자 하는 분들께 이상적입니다. 전략 히트율 탑 바텀 신호 는 모든 트레이더와 모든 거래 유형 에게 필수적인 도구입니다. 이 전략은 정확한 리페인트 없는 신호 를 제공하여 언제 어떤 방향으로 거래해야 할지를 명확하게 제시할 뿐만 아니라 각 페어와 TF에 대한 상세한 성공률 기록 을 제공합니다. 사전 정의된 테이크 프로핏(TP)과 스톱 로스(SL)을 통해 신호의 효율성을 미리 알 수 있습니다 , 이는 효과적인 리스크 관리와 정확한 거래에 매우 중요합니다. 이 전략의 특징은 전체 움직임이 아닌 임펄스 내의 반전 지점을 감지하는 데 중점을 두고 있어 전통적인 탑-바텀보다 신호 발생 빈도가 높고, 시장의 주요 변동에서 핵심 순간을 포착하는 데 집중합니다. 이 전략은 SL/TP 비율과 결합된 신호의 과거 성과를
IQ FX Gann Levels
INTRAQUOTES
5 (2)
IQ FX Gann Levels a precision trading indicator based on W.D. Gann’s square root methods. It plots real-time, non-repainting support and resistance levels to help traders confidently spot intraday and scalping opportunities with high accuracy. William Delbert Gann (W.D. Gann) was an exceptional market analyst, whose trading technique was based on a complex blend of mathematics, geometry, astrology, and ancient mathematics which proved to be extremely accurate. Download the Metatrader 5 Version M
AT Forex Indicator MT4
Marzena Maria Szmit
5 (3)
The AT Forex Indicator MT4 is a sophisticated trading tool designed to provide traders with a comprehensive analysis of multiple currency pairs. This   powerful indicator   simplifies the complex nature of the forex market, making it accessible for both novice and experienced traders. AT Forex Indicator uses   advanced algorithms   to detect trends, patterns and is an essential tool for traders aiming to enhance their forex trading performance. With its robust features, ease of use, and reliabl
Introducing the Delta Volume Profile Indicator - Unleash the Power of Institutional Precision!  https://youtube.com/shorts/znUdz5PEBAY Technical Indicator: Are you ready to trade like the pros? The Delta Volume Profile Indicator is no ordinary tool. It’s a high-precision, cutting-edge indicator that puts the power of institutional-grade trading in your hands. This unique indicator analyses delta volume distribution in real-time, revealing the market's hidden buy/sell imbalances that the biggest
Enigmera
Ivan Stefanov
5 (7)
ENIGMERA: 시장의 핵심 중요: MQL5.com의 데모는 Strategy Tester에서 실행되며 Enigmera의 기능을 완전히 반영하지 못할 수 있습니다. 설명, 스크린샷 및 비디오를 확인하여 자세한 내용을 확인하십시오. 질문이 있으면 언제든지 메시지를 보내주세요! 인디케이터의 코드는 완전히 다시 작성되었습니다. 버전 3.0은 새로운 기능을 추가하고 인디케이터가 처음 출시된 이후 누적된 버그를 수정했습니다. 소개 이 인디케이터 및 거래 시스템은 금융 시장에 대한 주목할 만한 접근 방식입니다. ENIGMERA는 프랙탈 주기를 사용하여 정확하게 지원 및 저항 수준을 계산합니다. 실제 축적 단계를 보여주고 방향과 목표를 제공합니다. 트렌드와 수정 모두에서 작동하는 시스템입니다. 작동 방식 인디케이터의 대부분의 기능은 차트 왼쪽에 있는 버튼을 통해 제어되며, 이를 통해 다양한 시장 상황에 빠르게 대응할 수 있습니다. 버튼 ON/OFF – 인디케이터 전체를 표시하거나 숨깁니다.
MartingaleArrow
Abdulkarim Karazon
Martingale Arrow는 martingale 바이너리 옵션 거래를 위해 설계된 화살표 유형 mt4 표시기입니다. 이 화살표는 바 열기/인트라 바에 인쇄되고 경고를 제공합니다. 사용 방법: 화살표가 나타나는 순간 거래를 개시하세요. 거래가 성공했다면 다음 신호를 기다렸다가 동일한 로트를 거래하세요. 다음 신호에서 거래가 두 배의 로트를 잃고 신호가 승리할 때까지 계속 그렇게 하는 경우 재설정하고 첫 번째 거래 로트로 거래하세요. 권장 기간: 모두 최소 보증금 : 200 단위. 이 표시기 라이브는 다음을 수행하지 않습니다: 다시 칠하기/뒤로 칠하기 ------------------------------------- ------------- 매개변수: 표시 기간: 변경 시 다른 신호를 제공합니다. 지표 가격/유형 과매수/과매도 수준 경고 입력 화살표 스타일 ==========================================
NAM Order Blocks
NAM TECH GROUP, CORP.
3 (2)
MT4 Multi-timeframe Order Blocks detection indicator. Features - Fully customizable on chart control panel, provides complete interaction. - Hide and show control panel wherever you want. - Detect OBs on multiple timeframes. - Select OBs quantity to display. - Different OBs user interface. - Different filters on OBs. - OB proximity alert. - ADR High and Low lines. - Notification service (Screen alerts | Push notifications). Summary Order block is a market behavior that indicates order collection
Linear Trend Predictor - 진입 지점과 방향성 지원선을 결합한 추세 지표입니다. 고가/저가 채널을 돌파하는 원칙에 따라 작동합니다. 지표 알고리즘은 시장 노이즈를 걸러내고 변동성과 시장 역학을 고려합니다. 표시기 기능  평활화 방법을 사용하여 시장 추세와 BUY 또는 SELL 주문을 시작하기 위한 진입 시점을 보여줍니다.  모든 기간의 차트를 분석하여 단기 및 장기 시장 움직임을 파악하는 데 적합합니다.  어떠한 시장과 시간대에도 적용할 수 있으며, 입력 매개변수를 통해 거래자는 자신에게 맞게 지표를 독립적으로 사용자 지정할 수 있습니다.  설정된 지표 신호는 사라지거나 다시 그려지지 않습니다. 이는 캔들 마감 시 결정됩니다.  여러 유형의 알림이 화살표와 결합되어 있습니다.  이 지표는 독립적인 거래 시스템으로 사용할 수도 있고, 다른 거래 시스템에 추가하는 용도로도 사용할 수 있습니다.  모든 수준의 경험을 가진 거래자가 사용할 수 있습니다. 주요 매
Beast Super Signal
Dustin Vlok
4.73 (89)
수익성 있는 거래 기회를 쉽게 식별하는 데 도움이 되는 강력한 외환 거래 지표를 찾고 계십니까? Beast Super Signal보다 더 이상 보지 마십시오. 사용하기 쉬운 이 추세 기반 지표는 시장 상황을 지속적으로 모니터링하여 새로운 개발 추세를 찾거나 기존 추세에 뛰어들 수 있습니다. Beast Super Signal은 모든 내부 전략이 정렬되고 서로 100% 합류할 때 매수 또는 매도 신호를 제공하므로 추가 확인이 필요하지 않습니다. 신호 화살표 알림을 받으면 구매 또는 판매하기만 하면 됩니다. 구매 후 비공개 VIP 그룹에 추가되도록 저에게 메시지를 보내주세요! (전체 제품 구매만 해당). 최신 최적화된 세트 파일을 구입한 후 저에게 메시지를 보내주세요. MT5 버전은   여기에서 사용할 수 있습니다. 여기에서   Beast Super Signal EA를 받으세요. 최신 결과를 보려면 댓글 섹션을 확인하세요! Beast Super Signal은 1:1, 1:2
RelicusRoad Pro
Relicus LLC
4.63 (104)
이제 $ 147 (몇 가지 업데이트 후 $ 499 증가) - 무제한 계정 (PCS 또는 MACS) RelicusRoad 사용 설명서 + 교육 비디오 + 비공개 Discord 그룹 액세스 + VIP 상태 시장을 보는 새로운 방법 RelicusRoad는 외환, 선물, 암호화폐, 주식 및 지수에 대한 세계에서 가장 강력한 거래 지표로서 거래자에게 수익성을 유지하는 데 필요한 모든 정보와 도구를 제공합니다. 우리는 초보자부터 고급까지 모든 거래자가 성공할 수 있도록 기술적 분석 및 거래 계획을 제공합니다. 미래 시장을 예측할 수 있는 충분한 정보를 제공하는 핵심 거래 지표입니다. 우리는 차트에서 말이 안 되는 여러 지표 대신 완전한 솔루션을 믿습니다. 타의 추종을 불허하는 매우 정확한 신호, 화살표 + 가격 조치 정보를 표시하는 올인원 표시기입니다. 강력한 AI를 기반으로 하는 RelicusRoad는 누락된 정보와 도구를 제공하여 교육하고 성공적인 트레이더인 트레이딩 전문가가 되도
PTS Precision Index Oscillator V2
PrecisionTradingSystems
5 (1)
프리시전 트레이딩 시스템의 로저 메드칼프에 의한 프리시전 인덱스 오실레이터 (Pi-Osc) 버전 2는 차트에 신속하게 로드되도록 주의 깊게 다시 코딩되었으며 경험을 향상시키기 위해 몇 가지 다른 기술적 개선 사항이 통합되었습니다. Pi-Osc는 정확한 거래 타이밍 신호를 제공하도록 개발되었으며 시장이 모든 사람의 스톱을 청산하기 위해 가야 하는 극도의 고갈 지점을 찾는 데 목적이 있습니다. 이 제품은 극단적인 지점이 어디에 있는지 알고 있는 고전적인 문제를 해결하며 트레이더로서의 삶을 훨씬 간단하게 만듭니다. 이것은 업계 표준 오실레이터와는 상당히 다른 강력한 차이점을 가지고 있는 고도로 복잡한 합의 지표입니다. 사용하는 기능 중 일부는 수요 지수, 자금 흐름, RSI, 스토캐스틱, 패턴 인식, 거래량 분석, 표준 편차 극단점 및 다양한 길이에서 위와 유사한 변형을 갖습니다. 미숙한 눈에는 다른 오실레이터와 비슷해 보일 수 있지만 RSI 또는 모멘텀과 같은 다른 오실레이
Max Min Cycle
Vitalyi Belyh
Cyclical indicator for trading and predicting the direction of the market. Shows the cyclical behavior of the price in the form of an oscillator. Gives signals for opening deals when rebounding from the upper and lower boundaries of the oscillator. In the form of a histogram, it shows the smoothed strength of the trend. Will complement any trading strategy, from scalping to intraday. The indicator does not redraw. Suitable for use on all symbols/instruments. Suitable time frames for short-term t
Order Blocks ICT Multi TF MT4
Diego Arribas Lopez
5 (2)
[ MT5 Version ]  [ Kill Zones ]  [ SMT Divergences ] How to trade using Order Blocks:  Click here User Interface Performance:  During testing in the strategy tester, the UI may experience lag. Rest assured, this issue is specific to the testing environment and does not affect the indicator's performance in live trading. Elevate your trading strategy with the  Order Blocks ICT Multi TF  indicator, a cutting-edge tool designed to enhance your trading decisions through advanced order block analys
PTS Divergence Sell Finder V2
PrecisionTradingSystems
로저 메드칼프 (Roger Medcalf)의 PTS 다이버전스 파인더 판매 인디케이터 - 프리시전 트레이딩 시스템. 이 인디케이터는 곰세 - 판매 신호만을 제공합니다. 먼저, 많은 해 동안 매수 신호 다이버전스 파인더를 제공하는 반면 판매 다이버전스 인디케이터를 제공하지 않았던 이유를 자주 묻는 질문을 받았습니다. 매도 다이버전스가 매수 다이버전스보다 신뢰성이 떨어진다고 답했으며, 이것은 여전히 사실입니다. 이를 변경하기 위한 몇 가지 솔루션이 발견되었으며, 이는 동료 압력에 따르거나 15년 전에 만든 이 인디케이터를 수정하는 것이 아니라 기본 설정을 보다 엄격하게 변경함으로써 이루어졌습니다. PTS 다이버전스 파인더 판매 인디케이터는 어떻게 작동합니까? PTS 다이버전스 파인더 판매 인디케이터는 거래량을 기반으로 한 Demand Index에서 발생한 다이버전스의 수를 정확하게 측정합니다. MT4는 거래량 대신 틱 거래량을 제공하므로 기본 Demand Index 인디케이터에서 발생하
PTS Divergence Buy Finder
PrecisionTradingSystems
PTS - Precision Trading Systems의 Divergence Buy Finder Precision Divergence Finder는 시장 바닥을 핀포인트 정확도로 찾아내도록 설계되었으며 이를 자주 수행합니다. 기술적 분석에서 바닥을 고르는 기술은 일반적으로 정상을 선택하는 것보다 훨씬 쉽습니다. 이 항목은 정확히 이 작업을 위해 설계되었습니다. 상승 Divergence가 식별되면 구매하기 전에 트렌드가 반등할 때 기다리는 것이 현명합니다. 10 또는 20 바 높음을 사용하거나 이전 바의 이동 평균 15-30이 상승하는 것을 식별하기 위해 사용할 수 있습니다. 복잡한 알고리즘은 실시간 바 단위로 활성 Demand Index(DI) Divergence 수를 찾아내고 계산합니다. 모델은 시장 가격이 새로운 최저점을 기록하고 Demand Index가 새로운 최저점을 기록하지 않을 때 Divergence를 발생시키는 것을 관찰합니다. 이 지표는 두 가지 설정을 사
IQ Gold Gann Levels a non-repainting, precision tool designed exclusively for XAUUSD/Gold intraday trading. It uses W.D. Gann’s square root method to plot real-time support and resistance levels, helping traders spot high-probability entries with confidence and clarity. William Delbert Gann (W.D. Gann) was an exceptional market analyst, whose trading technique was based on a complex blend of mathematics, geometry, astrology, and ancient mathematics which proved to be extremely accurate. Download
Introduction to Fractal Pattern Scanner Fractal Indicator refers to the technical indicator that makes use of the fractal geometry found in the financial market. Fractal Pattern Scanner is the advanced Fractal Indicator that brings the latest trading technology after the extensive research and development work in the fractal geometry in the financial market. The most important feature in Fractal Pattern Scanner is the ability to measure the turning point probability as well as the trend probabi
POWR Rise Coming
Trade Indicators LLC
This indicator is SO SIMPLE… when the green Rise Coming arrow appears, a price drop may be on the way! Plain and easy profits! As you receive more than one 'Rise Coming' text signal in a downtrend, it means momentum is building larger for a bull run. HOW TO USE 1. When the green "Rise Coming" text appears, a price jump may be on the way! This indicator Never Repaints! To get the best setting it's a matter of tweaking the indicator until it gives you the best results. Our recommendation, and what
거래 수준 지표는 진입점을 결정하고 포지션을 유지하며 추세 방향을 유지하도록 설계된 거래 시스템입니다. 하나의 복합체에서 작동하는 여러 메커니즘, 추세 방향의 파동 분석, 신호 구성 시 레벨 분석을 포함하고 가능한 TP 및 SL 목표를 보여줍니다. 표시기 기능 신호 화살표는 현재 캔들에 표시되며 다시 칠해지지 않습니다. 가격이 반등하는 수준을 검색하기 위해 특별한 알고리즘을 사용합니다. 추세에 따라 작동합니다. 이 시스템은 보편적이며 다양한 거래 수단에 적용될 수 있습니다. 화살표 경고에는 여러 유형이 있습니다. 신호 화살표의 입력 매개변수는 자동 모드에서 구성되고 작동됩니다. 기간에 따라 "추세 파동 기간" 매개변수를 변경합니다. "목표 수준 SL TP" 매개변수는 주요 통화쌍에 대해 정의되어 있으며 다른 거래 상품에 사용하기 위해 10개 이상의 증가가 가능합니다. 표시기 작동 방식 추세를 결정하기 위해 지표에는 파동선이 있습니다. 가격보다 높으면 추세는 약세이고, 가격보다
이 지표는 실제 거래에 완벽한 자동 파동 분석 지표입니다! 사례... 참고:   웨이브 그레이딩에 서양식 이름을 사용하는 데 익숙하지 않습니다. Tang Lun(Tang Zhong Shuo Zen)의 명명 규칙의 영향으로 기본 웨이브를   펜   으로 명명하고 2차 웨이브 밴드를   세그먼트   로 명명했습니다. 동시에, 세그먼트에는 추세 방향이 있습니다.   주요 추세 세그먼트에는   이름이 지정되지만(이 이름 지정 방법은 향후 노트에서 사용됩니다. 먼저 말씀드리겠습니다.) 알고리즘은 굴곡 이론과 거의 관련이 없으므로 그렇게 해서는 안 됩니다. 이는 나의 시장 분석을   통해 요약된 끊임없이 변화하고 복잡한 운영 규칙을   반영합니다. 밴드는 더 이상 사람마다 다르지 않도록 표준화되고 정의되었습니다. 인위적인 간섭의 드로잉 방법은 시장 진입을 엄격하게 분석하는 데 핵심적인 역할을 합니다. 이 지표를 사용하는 것은 거래 인터페이스의 미학을 개선하고 원래의 K-line 거래를
ECM Elite Channel is a volatility-based indicator, developed with a specific time algorithm, which consists of finding possible corrections in the market. This indicator shows two outer lines, an inner line (retracement line) and an arrow sign, where the channel theory is to help identify overbought and oversold conditions in the market. The market price will generally fall between the boundaries of the channel. If prices touch or move outside the channel, it's a trading opportunity. The ind
Supreme Commander
Ramon Sobrevals Arce
4.13 (8)
The indicator of the indicators. The Most Powerful Technique to Determine Forex Trend Strength in 2023. We have perfected Supreme Commander that it calculates an average of the selected indicators (up to 16) and the selected timeframe (all) with the result of a single trend that indicates the potential of buying and selling.  It includes the following indicators: Accelerator/Decelerator oscillator Average Directional Movement Index Awesome oscillator; Bulls and Bears  Commodity Channel Index; De
Trend Oscillator for MT4
Nicola Capatti
5 (1)
트렌드 오실레이터: 부드럽고 신뢰할 수 있는 시장 트렌드 식별 트렌드 오실레이터는 트레이더가 트렌드 방향과 잠재적 반전 포인트를 정확하게 식별하는 데 도움을 주기 위해 설계된 MT4의 고급 지표입니다. 직관적인 시각적 표현을 통해 시장이 상승 추세인지 하락 추세인지를 명확하게 보여주어 분석을 단순화하고 차트 가독성을 높입니다. 다양한 시장 및 시간 프레임에 적합하여 여러 트레이딩 요구에 유연하게 대응할 수 있습니다. 트렌드 오실레이터의 주요 특징과 장점 단순화된 트렌드 시각화 : 트렌드 오실레이터는 라인의 색상을 변경하여 트렌드 움직임을 그래픽으로 나타냅니다. 파란색은 상승 추세를, 노란색은 하락 추세를 나타내어 트렌드를 즉시 명확하게 파악할 수 있습니다. 신뢰할 수 있는 반전 신호 : 고급 알고리즘을 통해 지표는 잠재적인 반전 포인트를 나타내는 색상의 화살표를 생성합니다. 녹색 화살표는 매수 포인트를, 빨간색 화살표는 매도 포인트를 나타내어 트레이더가 진입 또는 청산을 평가할 수
제작자의 제품 더 보기
The indicator displays 4 current levels between which the price is located. The levels are calculated based on the range of the previous day. The number and value of levels is arbitrary and expressed as a percentage. The position of the levels is calculated from the minimum of the previous day (an example can be found in the description of the parameters). It is advisable to place the levels in the settings line in order, nevertheless, the indicator will sort them by itself and if levels are fou
Displays the readings of the Moving Average indicator on the older timeframe. Wishes for other types of Moving Average are accepted (however, the possibility of implementation depends on the type of algorithm). It doesn't make sense to apply it to the current timeframe - there are free indicators for this. Does not redraw the readings starting from the first bar. It is very important to have and match the history of the timeframes on which it is installed and set in the settings. A simple built-
The next version of the indicator based on the range of previous day. Considers a difference of time zones. By default works the time zone of the broker. Can work on time zones: Greenwich, broker or local.  It can be applied only on timeframe from H1 below. If the day range of new day is lower minimum, then minimum is transferred from ranges of previous day symmetrically concerning the line of closing previous day (optionally, look Input parameters ). Screenshot 1: operation of the indica
In indicators the positive scale often unreasonably is accepted though in fact they are the symmetric. Such property has also standard RSI. The presented indicator works in the scale, symmetric concerning zero, but at the same time completely repeats an original form. In this indicator important levels 20 and -20. It is very convenient at its use in automatic trade as application of one threshold by optimization excludes overoptimization. Besides, the algorithm of calculation of the indicato
ZigZagHistory
Aleksandr Martynov
The indicator was developed with one purpose - adequate processing on stories and the maximum approach to the original (it was required for development of more difficult indicator and use in the expert). I think, everything who tried to get history from the original indicator understood that in it there is information only on extrema and nothing more. It is not sure that similar does not exist, but mine is found on other than original to an algorithm: - for one pass (programmers will understand)
The indicator is constructed on the basis of ZigZagHistory ( https://www.mql5.com/ru/market/product/37376 ). At the same time calculated on the current timeframe and on the specified high. The history of the high timeframe is displayed by hollow squares. The history of a current timeframe is displayed by rhombuses. Colors and the sizes of signs can be adjusted. Attention!  The Price noise parameter - has significant effect on formation of extrema. Parameters: High TimeFrame (HTF) - the high tim
This indicator is based on the previous option ( https://www.mql5.com/ru/market/product/37376 ) and includes all completions at the time of creation. Availability of additional data allows to understand more deeply the principle of work as this indicator and original. Points on extrema of bars show history of a portrayal of extrema as before. Levels of a reverse show as far as the price for formation of a new shoulder has to deviate. The Price noise parameter has a special impact (the name "devi
ZigZag Minimal
Aleksandr Martynov
The indicator is made on the basis of the algorithm put in the ZigZag History indicator ( https://www.mql5.com/ru/market/product/37376/ ). In the real option there are no additional buffers and an opportunity to trace work history. It causes the minimum involvement of random access memory, however productivity practically does not improve. Attention!  The Price noise parameter - has significant effect on formation of extrema. Parameters: Depth  - is depth of search of a local extremum in bars;
The RSI Symmetric indicator approximated by function of the known Buzzer indicator. Display for the high timeframe is provided. 2 types of signals are of interest: 1. Position of the RSI line concerning the approximated line 2. The trend direction of the approximated line  Indicator parameters: RSI TimeF rame - the worker  timeframe (it has to be equal or more than current); RSI Period - no comments; Buzzer Period is the period of approximation of the RSI Symmetric indicator; Buzzer Ave
Индикатор отображает 4 текущих уровня между, которыми находится цена. Уровни вычисляются на основе диапазона предыдущей недели. Количество и значение уровней произвольное   и выражается в процентах . Положение уровней отсчитывается от минимума предыдущего дня (пример можно посмотреть в описании параметров). Целесообразно размещать уровни в строке настроек по порядку, тем не менее индикатор сам их отсортирует и если обнаружатся уровни отстоящие менее чем на 1% выдаст ошибку. Индикатор работает н
ZigZag Level
Aleksandr Martynov
One of the disadvantages of the ZigZag indicator when working with advisers is the need to find the latest extremes. For this purpose, various algorithms of history analysis in indicator buffers are used. However, the indicator itself knows these values and can therefore display them. To this target, the ZigZag Minimum indicator ( https://www.mql5.com/ru/market/product/37975 ) has been refined. The zero buffer stores the value of the last maximum. The first buffer stores the value of the last m
ZigZag Mini Extra
Aleksandr Martynov
Not a logical continuation of the ZigZag indicator series is an indicator cut to an absolute minimum. An important property of this indicator is that it will never redraw the value of a completed bar. Based on previous indicator algorithms, e.g. ( https://www.mql5.com/ru/market/product/37975 ). Parameters: Depth  - is depth of search of a local extremum in bars; On minute calc  - is switching ON/OFF of calculation on minute bar (it is switched off - calculation on each tic).
The proposed indicator is based on the ZigZag Mini Extra indicator ( https://www.mql5.com/ru/market/product/42632 ). Unlike the prototype can be built at the price of Close or High-Low with the established timeframe. The prices of the current timeframe will be used when calculating the indicator on the highest timeframes at Close price, . Indicator parameters: ZigZag TimeFrame = PERIOD_CURRENT - operating time frame (must be equal or more than current timeframe); Depth = 12 - depth of loca
The ZigZag indicator is based on the RSI indicator. This makes it possible to identify significant extremes. Different calculation options are provided: - RSI indicator at Close or Hi-Low prices (1 and 2 buffers respectively in OnClose mode - the first buffer, in Hi-Low mode the first buffer at High price, the second buffer at Low); - ZigZag indicator by period (standard) or minimal deviation. (The ZigZag indicator values are always in zero buffer.) If you use a higher timeframe, make sure
Trend Ranger
Aleksandr Martynov
The indicator does not use predictions. It merely shows what range the price is in. However, it does a good job with chart markings and mapping current trade preferences. It can act as an independent tool of medium and long-term urgent trade, and together with oscillators it is possible to build a good scalper system. Important! The signal is 0 bar - does not repaint! Indicator parameters: Zone Range (Pips) - size of zone in pips excluding the number of characters; Line or Histogram Width -
Based on the course records of Yuri Antonov (academyfx.ru) YouTube Channel: https://www.youtube.com/playlist? list=PLj3wALUOwoZ9kdacS09K9bjD1zulR _ HJh The indicator is intended for people who know the strategy but find it difficult to mark the graph.  Approaches the new Intensive MD system. The default parameters are set as of mid-2019. For a 5-digit EURUSD account! You can work on the 4-character after the parameters are recalculated. The current parameters can be found on the author 's
Fractal with levels
Aleksandr Martynov
Indicator of fractals with adjustable indents. Designed according to an original simplified algorithm for use in EA. The main ones in the indicator are lines showing the levels of the current fractals, which allows you to read the values ​ ​ of the last fractal in one operation. It works on a closed bar, so it does not redraw and does not load the terminal with calculations. It should be understood that the indicator is late with the detection of the fractal by the number of bars on the righ
Аттракцион невиданной щедрости - треть цены! Сканер Heiken Ashi на четырех таймфреймах. Индикатор не рисует и не подсматривает историю. Модифицированный расчет повышает чувствительность! Возможно отключить модифицированный расчет для каждого таймфрейма отдельно, а также отключить анализ 4 таймфрейма. В нулевом (скрытом) буфере хранится информация о совпадении трендов на всех рабочих ТФ. Эта опция упрощает анализ и чтение из советников. Требователен к истории. Наиболее простое отсутствие данных
Indicator from the Real Non RePaint MultiTimeFrame (Real NRP MTF)  series. Specially designed to display the RSI standard indicator reading from the Senior TimeFrame (TF) to the Junior. The indicator differs from the standard scale - symmetrical relative to 0. Add 50.0 to the readings to get the standard values. Does not look into the future for history at the senior TF. DOES NOT DIFFER from the standard real-time indicator readings (including bias), but shows the actual indicator readings on th
Indicator from the Real Non RePaint MultiTimeFrame   (Real NRP MTF)  series. The indicator is based on the standard one. Does not redraw in any mode: the last closed candle is a rock. Does not look into the future for history at the senior TF. The formula for sensitivity enhancement has been changed (disabled in settings). It works on the current TF or older ones with the display on the current one. The last closed Heiken Ashi candle of the current timeframe before the opening of the new senior
Indicator from the  Real Non RePaint MultiTimeFrame  (Real NRP MTF) series. Specially designed to display the standard Stohastic indicator from the senior timeframe (TF) to the junior. The indicator differs from the standard scale - symmetrical relative to 0. Add 50.0 to the readings to get the standard values. Does not look into the future for history at the senior TF. DOES NOT DIFFER from the real-time standard indicator (offset-based), but shows the actual indicator counts on the history f
Индикатор содержит 3 RSI с возможностью выбора рабочего таймфрейма, периода и параметра сглаживания каждого. Не перерисовывает начиная с 1 бара. При задании параметра сглаживания большего 1 показания будут обработаны специальным образом, для исключения мелких колебаний. Возможно использовать в качестве готовой торговой системы, где показания старших ТФ определяют тренд, а младший используется для поиска точек входа, в качестве примера может служить система Дмитрия Брылякова  https://www.infoclub
Dynamic Fibo Level
Aleksandr Martynov
Индикатор отображает динамические разворотные уровни по шкале Фибоначи. Основан на индикаторе ЗИГ-ЗАГ, который управляется периодом и минимальной глубиной для переключения тренда. Если указать глубину переключения равной 0, то она не будет участвовать в расчетах индикатора. Используется неперерисовывающий сформированные вершины индикатор - возможны несоответствия экстремумов со стандартным индикатором ЗИГ-ЗАГ. Расчитывается на закрытом баре, действие зоны отображается для текущего бара. Основные
필터:
리뷰 없음
리뷰 답변