• 미리보기
  • 리뷰
  • 코멘트

Fractal with levels

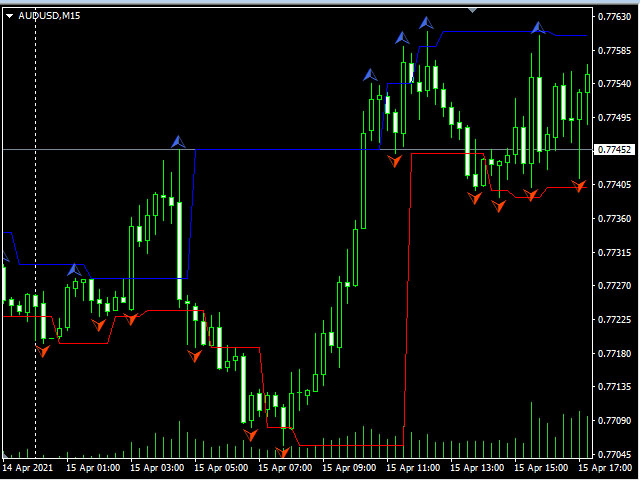
Indicator of fractals with adjustable indents. Designed according to an original simplified algorithm for use in EA.

The main ones in the indicator are lines showing the levels of the current fractals, which allows you to read the values ​ ​ of the last fractal in one operation.

It works on a closed bar, so it does not redraw and does not load the terminal with calculations.

It should be understood that the indicator is late with the detection of the fractal by the number of bars on the right plus 1.

Indicator parameters:

Fraktal bars left - number of bars to the left of the fractal;

Fraktal bars right - number of bars to the right of the fractal;

Draw Arrow? - draw icons;

Arrow Up Code - character code from the Wingdings font of the upper fractal;

Arrow Down Code - character code from the Wingdings font of the lower fractal;

Arrow Gap (pips) - indentation of the icon in pipes.


추천 제품
Diamond PRO
Fanur Galamov
4.83 (18)
Diamond PRO is enhanced powerful version of Diamond for advanced traders. Pro version includes optimized cores, new impoved entry points filters, new multistage profit closure algorithm and сontains number of external control parameter that allows build and fine tune own tradind decisions and algorithms. The system provides more accurate market entries, analyzes and filters upcoming economic news, contains spread protection and an advanced position management algorithm. Main goal of Diamond PRO
The Advanced Bands Squeeze indicator is a custom indicator based on the classic Bollinger Bands as created by John Bollinger. The Bollinger Band Squeeze occurs when volatility falls to low levels and the Bollinger Bands narrow. This low volatility level is called a “Squeeze”.  According to John Bollinger, periods of low volatility are often followed by periods of high volatility, where prices tend to move a lot in either direction. Therefore, a volatility contraction or narrowing of the bands
Strength and weakness of currencies : Shows the currency status at any time, values between 50 and -50 are neutral, everything outside indicates a trend change  Waves : Current state of waves, daily, weekly monthly and yearly Recommended volume for trading a specific number of waves Yearly High Low Drawn waves on which the market will react in advance, without redrawing Yearly candle with bonus levels used to display deviations  For more info contact me
Owl smart levels
Sergey Ermolov
4.58 (55)
MT5 버전  |   FAQ Owl Smart Levels Indicator 는   Bill Williams 의 고급 프랙탈, 시장의 올바른 파동 구조를 구축하는 Valable ZigZag, 정확한 진입 수준을 표시하는 피보나치 수준과 같은 인기 있는 시장 분석 도구를 포함하는 하나의 지표 내에서 완전한 거래 시스템입니다. 시장과 이익을 취하는 장소로. 전략에 대한 자세한 설명 표시기 작업에 대한 지침 고문-거래 올빼미 도우미의 조수 개인 사용자 채팅 ->구입 후 나에게 쓰기,나는 개인 채팅에 당신을 추가하고 거기에 모든 보너스를 다운로드 할 수 있습니다 힘은 단순함에 있습니다! Owl Smart Levels   거래 시스템은 사용하기 매우 쉽기 때문에 전문가와 이제 막 시장을 연구하고 스스로 거래 전략을 선택하기 시작한 사람들 모두에게 적합합니다. 전략 및 지표에는 눈에 보이지 않는 비밀 공식 및 계산 방법이 없으며 모든 전략 지표는 공개되어 있습니다. Owl Smart Lev
VR Cub
Vladimir Pastushak
VR Cub 은 고품질 진입점을 얻는 지표입니다. 이 지표는 수학적 계산을 용이하게 하고 포지션 진입점 검색을 단순화하기 위해 개발되었습니다. 지표가 작성된 거래 전략은 수년 동안 그 효율성을 입증해 왔습니다. 거래 전략의 단순성은 초보 거래자라도 성공적으로 거래할 수 있다는 큰 장점입니다. VR Cub은 포지션 개시 지점과 이익 실현 및 손절매 목표 수준을 계산하여 효율성과 사용 편의성을 크게 높입니다. 간단한 거래 규칙을 이해하려면 아래 전략을 사용한 거래 스크린샷을 살펴보세요. 설정, 세트 파일, 데모 버전, 지침, 문제 해결 등은 다음에서 얻을 수 있습니다. [블로그] 다음에서 리뷰를 읽거나 작성할 수 있습니다. [링크] 버전 [MetaTrader 5] 진입점 계산 규칙 포지션 개설 진입점을 계산하려면 VR Cub 도구를 마지막 최고점에서 마지막 최저점까지 늘려야 합니다. 첫 번째 지점이 두 번째 지점보다 빠른 경우, 거래자는 막대가 중간선 위에서 마감될 때까지 기다립
Master XR
Mati Maello
This indicator Master XR indicator.Indicator displays trend movement. Indicator calculates automatically line. Features FiltPer - displays indicator period. deviation - displays indicator deviation. deviation2 - displays indicator deviation. How to understand the status: If (Timeframe M1-H1) FiltPer = 100; If ( Timeframe H4-MN) FiltPer = 5-20; ////////////////////////////////////////////////////////////////////////////////////////////////////////////////////////////////////////////////////// /
Market Structure Zig Zag
Lesedi Oliver Seilane
4.8 (25)
Free Market structure zig zag to assist in price action trading the screenshots describe how to use and how to spot patterns new version comes with alerts, email alert and  push notification alert can be used on all pairs  can be used on all timeframes  you can add additional confirmation indicators the indicator shows you your higher high and low highs as well as your lower lows and lower highs  the indication makes price action analysis easier to spot.
FREE
We present you the indicator "Candle closing counter", which will become your indispensable assistant in the world of trading. That’s why knowing when the candle will close can help: If you like to trade using candle patterns, you will know when the candle will be closed. This indicator will allow you to check if a known pattern has formed and if there is a possibility of trading. The indicator will help you to prepare for market opening and market closure. You can set a timer to create a p
Introduction It is common practice for professional trades to hide their stop loss / take profit from their brokers. Either from keeping their strategy to the themselves or from the fear that their broker works against them. Using this indicator, the stop loss / take profit points will be drawn on the product chart using the bid price. So, you can see exactly when the price is hit and close it manually.  Usage Once attached to the chart, the indicator scans the open orders to attach lines fo
Black series MT4
Dmitriy Kashevich
1 (1)
Black series MT4 - The indicator is designed for trading on binary options with Timeframe M1-M5-M15 Multicurrency (Works on cryptocurrency and currency pairs) The signal appears when the candle opens Up to 90% correct signals There is no signal redrawing at all Can be used with other indicators. Good for scalping! In Settings there is: -Indicator working methods -I Allert Arrow color Red signal down Blue signal up Also watch the video how the indicator works and signals
This indicator converted from 5 min Buy and Sell Range Filter - guikroth version on TradingView Popularity of the Range Filter The Range Filter is a very popular and effective indicator in its own right, with adjustments to the few simple settings it is possible to use the Range Filter for helping filter price movement, whether helping to determine trend direction or ranges, to timing breakout or even reversal entries. Its practical versatility makes it ideal for integrating it's signals into
AIS Optimal TPSL
Aleksej Poljakov
이 표시기는 최적의 이익실현 및 손절매 수준을 표시합니다. 이 수준은 과거 데이터를 기반으로 계산됩니다. 처음 시작할 때 표시기는 기록에 대해 학습됩니다. 그런 다음 그는 가격이 미래에 이 또는 그 수준을 극복할 확률을 평가하고 정지 주문을 하기 위한 가장 최적의 옵션을 선택합니다. 예를 들어 이익을 취하는 값은 이익이 최대이고 가격이 해당 수준에 도달할 확률이 가장 높도록 선택됩니다. 손절매 수준은 최소한이어야 하지만 도달할 확률은 최소한이어야 합니다. 결과적으로 승리에 대한 수학적 기대치가 가장 높은 레벨이 생성됩니다. 또한 이 지표는 지지선과 저항선의 형태로 사용될 수 있습니다. 이를 위해 다양한 예측 길이와 오프셋을 결합할 수 있습니다. 표시 매개변수: 길이 - 예측 길이. 이 매개변수는 향후 막대 거래의 예상 기간을 나타냅니다. Shift - 막대에서 이동합니다. 이 매개변수 덕분에 과거의 표시기 판독값을 볼 수 있습니다. 너비 - 선 너비. ClrBuy - 매수 포지션의
Индикатор содержит 3 RSI с возможностью выбора рабочего таймфрейма, периода и параметра сглаживания каждого. Не перерисовывает начиная с 1 бара. При задании параметра сглаживания большего 1 показания будут обработаны специальным образом, для исключения мелких колебаний. Возможно использовать в качестве готовой торговой системы, где показания старших ТФ определяют тренд, а младший используется для поиска точек входа, в качестве примера может служить система Дмитрия Брылякова  https://www.infoclub
Gioteen Volatility Index (GVI)   - your ultimate solution to overcoming market unpredictability and maximizing trading opportunities. This revolutionary indicator helps you in lowering your losing trades due to choppy market movements. The GVI is designed to measure market volatility, providing you with valuable insights to identify the most favorable trading prospects. Its intuitive interface consists of a dynamic red line representing the volatility index, accompanied by blue line that indicat
The Daily Trader
Remi Passanello
데일리 트레이더   이 표시기는 RPTrade Pro 솔루션 시스템의 일부입니다. Daily Trader는 통계만을 사용하는 일일 지표입니다. 누구나 사용할 수 있도록 설계되었으며 거래의 절대 초보자도 사용할 수 있습니다. 다시 칠하지 마십시오. 표시는 닫기에서 닫기로 제공됩니다. 단독으로 사용하도록 설계되어 다른 표시기가 필요하지 않습니다. 명확하고 간단한 표시를 제공합니다. 어떻게 작동합니까 통계 시스템은 이력을 분석하여 기호 동작에서 중복성을 찾습니다. 거래는 하나씩 표시되며 동시에 두 거래가 없습니다. IT는 다음을 나타냅니다. 거래를 할 때 이익실현을 어디에 둘 것인가 앞으로 24시간 동안 어떤 거래를 해야 할까요? 공장 FX 쌍, 지수, 금속, 선물 또는 기타와 같은 모든 상품. H1에만 모든 중개인과 함께. (낮은 스프레드는 더 많은 핍을 남깁니다) 특징 신뢰할 수 있는 매수/매도 신호. 매우 간단한 입력. 온스크린 알림 + 푸시 알림 + 이메일 알림
Trend Flasher
Amarnath K M
Trend Flasher Trend is your friend is the age old saying quote in trading arena, there are though many ways to gauge the trend and its direction, more scientific measure and logically meaningful will be an ATR break outs to identify and spot the trend and its acceleration, so we created this easy to use trend identification panel and optimized super trend based multi time frame panel entry system to aid and help the traders to make their trading decision. Unique Features of Trend Flasher 1
This indicator is another variant of the famous powerful indicator Fibonacci-SS https://www.mql5.com/en/market/product/10136 but has different behaviour in placing Pending Order and TP Line. Automatically places Fibonacci retracement lines from the last highest and lowest visible bars on the chart with: An auto Pending Order (Buy/Sell). Taking Profit 1, Taking Profit 2 is pivot point and Taking Profit 3 for extended reward opportunity. The best risk and reward ratio. Simple and powerful indica
Smooth price for Monarch MT4
Konstantin Gruzdev
3.67 (3)
The Smooth Price technical indicator is used for plotting a smoothed line as close to the price of the financial instrument as possible, and serves to eliminate its noise components. The indicator is part of the Monarch trading system, but here it is presented as an independent technical analysis tool. The indicator is based on the cluster digital filter , which, unlike the ClusterSMA , is applied directly to the price time series. Smooth Price does not redraw (except the very last, zero bar) an
Chart Patterns Detect 15 patterns (Ascending Triangle, Descending Triangle, Rising Wedge, Falling Wedge, Bullish Flag, Bearish Flag, Bullish Rectangle, Bearish Rectangle Symmetrical triangle, Head and Shoulders, Inverted Head and Shoulders, Triple top, Triple Bottom, Double Top, Double Bottom) Use historical data to calculate the probability of each pattern to succeed (possibility to filter notification according to the chance of success) gives graphic indication about the invalidation level and
Next level of trend trading here. Possibility 75%, the indicator analyzes the current market to determine short (small dot), middle (circle with a dot inside) and long (cross with a circle and a dot inside) trends.  Wingdings characters of  Aqua color represents the beginning of the UP trend. Wingdings characters of  Orange color represents the beginning of the DOWN trend. Possibility 75% Indicator will improve your trading in the world of forex, commodities, cryptocurrencies and indices.
This is a new strategy for SUPPLY DEMAND areas It is based on a calculation using the tick volume to detect the big price action in market for both bear /bull actions this smart volume action candles are used to determine the supply and demand areas prices in between main supply and demand lines indicate sideway market  up arrows will be shown when prices moves above the main supply and the secondary supply lines Down arrows will be shown when prices moves below the main demand and the secondary
Introduction to Chart Pattern MT Chart Pattern MT is a chart pattern scanner to detect the triangle pattern, falling wedge pattern, rising wedge pattern, channel pattern and so on. Chart Pattern MT uses highly sophisticated chart pattern detection algorithm. However, we have designed it in the easy to use with intuitive user interface. Chart Pattern MT will show all the patterns in your chart in the most efficient format for your trading. You do not have to do tedious manual pattern detection an
The principle of this indicator is very simple: detecting the trend with Moving Average, then monitoring the return point of graph by using the crossing of Stochastic Oscillator and finally predicting BUY and SELL signal with arrows, alerts and notifications. The parameters are fixed and automatically calculated on each time frame. Example: If you install indicator on EURUSD, timeframe M5: the indicator will detect the main trend with the Moving Average on this timeframe (for example the Moving
Galactic VSA
Jhon Martinez
Galactic Volume spread analysis (VSA), is an indicator designed for the visualization of the Volume, and the proportion in which it affects the volatility of the spread of the different pairs. The strategy consists of the following: Bull Trend: Always going in favor of the trend, open buying operations at the lows of the trend, provided that it coincides with a high volume shown by the Galactic VSA indicator. Downtrend: Always going in favor of the trend, open sales operations at the highs
NOTE: NEXT PRICE WILL BE 550$ Dear Trader I hope you have been eagerly waiting and looking for a tool to improve your trading. I am so glad to introduce my other product to you called Trend Shooter Index. The main goal of this tool is to help traders shoot the trend (target the trend) from the bottom or from the top of the trend for maximum profitability. How is the Indicator designed This tool is designed to show the following Red arrows pointing down for sell signals. Blue arrows pointing up
PZ Penta O MT4
PZ TRADING SLU
The Penta-O is a 6-point retracement harmonacci pattern which usually precedes big market movements. Penta-O patterns can expand and repaint quite a bit. To make things easier this indicator implements a twist: it waits for a donchian breakout in the right direction before signaling the trade. The end result is an otherwise repainting indicator with a very reliable trading signal. The donchian breakout period is entered as an input. [ Installation Guide | Update Guide | Troubleshooting | FAQ | A
Advance Currency Meter is a currency meter that detects strong market trends. This indicator is good for scalping, intraday trading and swing trading. The indicator will detect short term to long term market trends. This will give you good insight which currencies are best to trade as of the moment. Note : Kindly contact me before you make any purchases. Works well with my MACD Currency Strength Meter
Night ghost
Dmitriy Kashevich
Night Ghost - Arrow indicator for binary options. This is a reliable assistant to you in the future! - No redrawing on the chart -Works great on EUR/USD currency pairs! -Indicator accuracy up to 90% (Especially at night) -No long setup required (Perfectly set up for Binary Options) - Not late signals - The appearance of a signal on the current candle -Perfect for M1 period (No More!) - Eye-friendly candle color (Red and Blue) -Installed Alert Working with it: - Blue arrow
PABT Pattern Indicator - it's classical system one of the signal patterns. Indicator logic - the Hi & Lo of the bar is fully within the range of the preceding bar, look to trade them as pullback in trend. In the way if indicator found PABT pattern it's drawing two lines and arrow what showing trend way.  - First line - it's entry point and drawing at: 1. On the high of signal bar or on middle of the signal bar (depending from indicator mode) for buy; 2. On the low of signal bar or on middle of t
UniversalIndicator
Andrey Spiridonov
UniversalIndicator is a universal indicator. A great helper for beginners and professional traders. The indicator algorithm uses probabilistic and statistical methods for analyzing the price of a trading instrument. The indicator is set in the usual way. Advantages of the indicator works on any time period works with any trading tool has a high probability of a positive forecast does not redraw Indicator Parameters LengthForecast = 30 - the number of predicted bars
이 제품의 구매자들이 또한 구매함
Enigmera
Ivan Stefanov
5 (4)
에니메라: 시장의 핵심 https://www.enigmera.com 소개 이 지표 및 트레이딩 시스템은 금융 시장에 대한 놀라운 접근 방식입니다. 에니메라는 프랙탈 주기를 사용하여 지지선과 저항선을 정확하게 계산합니다. 진정한 축적 단계를 보여주고 방향과 목표를 제시합니다.  추세에 있든 조정에 있든 작동하는 시스템입니다.  어떻게 작동하나요? 에니메라는 지지선/저항선, 목표선, 편차선의 세 가지 라인으로 구성됩니다. 이 시스템은 과거 데이터를 현재와 미래로 추정하는 일반적인 시장 지표와 달리 현재에 대한 완전한 그림을 제공합니다. 지지선 위에 있으면 실제 지지를 의미하고 저항선 위에 있으면 실제 저항을 의미합니다. 레벨이 깨지면 추세의 변화를 나타냅니다. 다시 그리지 않습니다. 시장이 지속적으로 진화함에 따라 에니메라는 평가 도구를 조정하여 전략을 정기적으로 수정합니다.   이를 통해 모든 시나리오를 철저히 평가할 수 있습니다. 이 시장 지표의 고유성은 분명하며 그 기
Apollo Pips PLUS SP
Oleg Rodin
5 (3)
제품을 구매하기 전에 아래 정보를 읽어보세요! Apollo Pips PLUS SP는 독특한 제품입니다! 모든 거래 지표에 액세스할 수 있는 새로운 "APOLLO PIPS" 지표와 "슈퍼 팩" 보너스를 받고 싶은 분들을 위한 것입니다! Apollo Pips PLUS SP 제품을 구매하면 실제로 Apollo Pips 표시기의 완전히 새로운 버전을 구매하게 됩니다. 이 버전의 지표에는 개선된 알고리즘과 사용하기 쉬운 매개변수가 있어 모든 시장 및 거래 스타일에서 지표를 사용할 수 있는 기회를 제공합니다. 이 제품의 구매자는 슈퍼 보너스로 다른 모든 표시기에 무료로 액세스할 수 있습니다! 내 모든 거래 도구에 액세스하고 싶었다면 이 제품이 당신에게 딱 맞습니다! :) 하지만 이것이 전부는 아닙니다! :) 이 제품의 모든 구매자는 또한 내 새로운 지표를 무료로 받을 자격이 있습니다! :) 새로운 거래 지표를 사용할 수 있게 되었는데, 귀하는 저의 특별한 "SUPER PACK" 평생 보너스
Max Paynex
Abdulkarim Karazon
Max Payne은 화살표 형태로 신호를 제공하는 반전/추세 신호 지표입니다. 이 지표는 동일한 막대 종가에 신호를 제공하며, 이 지표는 신호의 이중/삼중 확인을 위해 다양한 기간으로 차트에서 여러 번 떨어질 수 있습니다. 표시기는 다시 칠하거나 다시 칠하지 않는 동안 모든 거래 스타일에 맞게 고도로 조정 가능합니다. 사용된 템플릿과 함께 구매 후 스크린샷에 표시된 전체 시스템을 얻을 수 있습니다. ----------------- 거래 방법: 트렌드 필터(구매 후 얻을 수 있는 Payne 트렌드)가 방향에 동의하는 동안 동일한 바에서 세 번의 확인을 받을 때까지 기다리세요. 거래를 개시하고 매수 거래의 경우 황금색 화살표(템플릿) 아래에 정지 손실을 설정하고 매도 거래의 경우 황금색 화살표(템플릿) 위에 설정하면 종료 신호는 반대쪽 첫 번째 흰색 점 신호(템플릿)입니다. ----------------- 매개변수: 신호주기 : 화살표주기 필터: 신호 필터 거리 : 양초로부터의 화살표
Market Swing Index MSI
Elias Mtwenge
5 (1)
JULY OFFER 80% OFF next price for unlimited version will be 17000$. This is the only time you can get this institutional and professional indicator at this price for unlimited version. Don't dare to miss this. The tool I am about to introduce to you you can't compare it with other tools due to its strategy and accuracy level in predicting the next price directional movement . This tool is designed for serious traders who have decided to make a difference through trading. Be the next person to wi
Swing Master Indicator
Elias Mtwenge
5 (1)
Dear Traders this is my another tool called " Swing Master Indicator ". As the name above the indicator is designed to help you in swing trading by capturing the low and highs of the price. You may us this tool with any trading strategy and style from scalping to position trading. It is made for level of traders including newbies and advanced traders even prop-firms, hedge funds and banks to help them make sold market analysis. I create tools for serious traders who want to make a difference in
Bomb Bank Signal
Igor Pereira Calil
폭탄 은행 신호: MetaTrader 4의 신뢰도 지표 Bomb Bank Signal은 금융 시장에서 가장 관련성이 높은 추세를 식별하도록 설계된 MetaTrader 4의 강력한 지표입니다. 움직임을 정확하게 예측하는 도구를 찾고 있다면 Bomb Bank가 바로 여러분에게 필요한 동맹입니다. 작동 방식: 이 지표는 거래량 분석, 양초 종가, 대칭 추세 등 세 가지 방법을 결합하여 매수 및 매도 기회를 감지하고 신호를 보냅니다. Bomb Bank는 매수 기회를 포착할 때는 '폭탄'과 같고, 매도 신호를 감지할 때에는 '해골'과 같습니다. 폭탄 은행은 왜 다른가요? 완전한 신뢰성: 폭탄 은행 신호는 신호를 제거하지 않습니다. 일단 신호가 발행되면 그 신호는 계속 유지되므로 기회를 절대 놓치지 않습니다. 극도의 정확성: Bomb Bank는 잘못된 신호를 보내지 않습니다. 시장이 발전함에 따라 조정하면서 실시간으로 업데이트하지만 이전 신호의 투명성은 유지합니다. 실시간
Gann Price Level
Kirill Borovskii
The indicator is designed to work on any trading platform. The program is based on proprietary algorithms and W.D.Ganna's mathematics, allowing you to calculate target levels of price movement based on three points with the highest degree of certainty. It is a great tool for stock trading. The indicator has three buttons: NEW - call up a triangle for calculation. DEL - delete the selected triangle. DELS - completely remove all constructions. The probability of achieving the goals is more than 80
The indicator " ZigZag on Trend " is an assistant in determining the direction of price movement, as well as a calculator of bars and points. It consists of a trend indicator, which follows the price direction by the trend line presented in the form of a zigzag and a counter calculating the number of bars traversed in the direction of the trend and the number of points on the vertical scale. (calculations are carried out by the opening of the bar) The indicator does not redraw. For convenience,
TrendMaestro
Stefano Frisetti
5 (3)
note: this indicator is for METATRADER4, if you want the version for METATRADER5 this is the link:  https://www.mql5.com/it/market/product/108106 TRENDMAESTRO ver 2.4 TRENDMAESTRO recognizes a new TREND in the bud, he never makes mistakes. The certainty of identifying a new TREND is priceless. DESCRIPTION TRENDMAESTRO identifies a new TREND in the bud, this indicator examines the volatility, volumes and momentum to identify the moment in which there is an explosion of one or more of these data a
거래 속도는 시장에서 대량 주문이 언제 어디서 누적되는지, 그리고 이로 인한 이점을 보여주는 최고 품질의 지표입니다. 매우 초기 단계에서 추세 변화를 감지합니다. 이는 지표이자 동시에 트레이딩 시스템입니다. 이 개념은 독특하고 수익성이 매우 높습니다. 외환에서 틱 볼륨은 거래량이라고 오해의 소지가 있습니다. 실제로는 단위 시간당 가격 변동으로, 사실상 거래 속도입니다. 이 지표는 외환에서 볼륨에 대한 개념을 완전히 수정하여 올바른 방식으로 논리적으로 정의하고이 논리를 적용하면 독특하고 정확한 최상위 수익성 도구가됩니다. 속도가 증가하면 더 큰 관심과 그에 상응하는 진입 및 출구의 신호입니다. 사용 방법: 이 지표는 시장에서 거래 속도를 측정하고 비교하기 때문에 가장 먼저해야 할 일은 다음과 같습니다.  이러한 비교를 할 기간을 선택합니다.  일반적으로 15일 전이 비교를 위한 좋은 출발점입니다.  인디케이터에 날짜를 입력하고 실행합니다.  30분 또는 1시간의 기간에서
Contact us to receive a comprehensive user guide after purchasing. William Delbert Gann, commonly known as W.D. Gann, was an exceptional market analyst renowned for his unique trading style in the early 20th century.  His trading techniques were based on a blend of mathematics, geometry, astrology, and ancient mathematics. Gann believed that stock market movements followed specific patterns and cycles, rather than being random. His methodologies, celebrated for their accuracy and relevance, con
NOTE: PRICE WILL RISE VERY SOON. DON'T SKIP THIS OFFER! Dear traders I am glad to introduce the " Market Swing Scanner Board" indicator to you. This indicator was made mainly to be used in combination with the Market Swing Index Indicator. You use the  "Market Swing Scanner Board"  indicator to scan for trading opportunities on the  Market Swing Index Indicator . This tool is designed for serious traders who have decided to make a difference through trading. Be the next person to witness this st
Gann Swing Structure
Kirill Borovskii
5 (1)
This indicator is based on the mathematics of the great trader W.D. Ganna. With its help, you can easily find strong levels by analyzing swings to find the optimal entry point. The indicator works on all instruments and all timeframes. The indicator is fully manual and has control buttons. All you need to do is press the NEW button, a segment will appear, which you can place on any movement, swing or even 1 candle that you want to analyze. By placing the segment, press the OK button. A grid (th
The indicator of a Professional Trader is an arrow indicator for predicting the direction of price movement. I have been working on this indicator since 2014. You can use this indicator as your main indicator, use its entry signals, and use it as your only indicator to find entry points. About the product: Recommended TF [H4-D1-W1]   . The indicator predicts the direction of the next candle. Fits a variety of tools; Flexibility in settings for different instruments and intervals through the
Full Forex Market View Dashboard
Opengates Success International
5 (2)
전체 외환 시장 보기 대시보드 표시기 이것은 거래자에게 시장에서 일어나는 일에 대한 전체 보기를 제공하기 위해 만들어진 사용자 지정 지표입니다. 실시간 데이터를 사용하여 시장에 액세스하고 성공적인 거래에 필요한 모든 정보를 표시합니다. 설치: 이 지표를 창 차트에 첨부하기 전에 MT4의 Market Watch 패널로 이동하여 필요하지 않거나 거래하지 않는 모든 통화 쌍을 숨기고 나머지는 그대로 두십시오. 그 이유는 FFMV 대시보드가 MT4의 Market Watch에 나타나는 모든 통화 쌍을 표시하기 때문입니다. 최대 30개 이하의 통화 쌍을 표시할 수 있습니다. MT4의 Market Watch에서 그 이상이면 FFMV 대시보드의 글꼴과 이미지가 흐려지고 변형됩니다! 제대로 표시되지 않습니다. 용법:      솔로 트레이딩      바구니 거래의 경우(방법에 대한 스크린샷 참조)      다중 주문 거래에도 사용할 수 있습니다.      자신의 거래
Gann Signal
Kirill Borovskii
Gann Signal is a very simple indicator at first glance, but hidden inside is many years of experience in studying W.D.Ganna methods. The indicator gives accurate BUY/SELL signals, without redrawing. The indicator is very easy to use. All you need to do is attach it to your chart and follow its recommendations. The indicator constantly analyzes the market for entry opportunities. When such an opportunity appears, the indicator gives a signal in the form of an arrow. I repeat, all signals are NOT
Connect Indicator
Sukunthakan Ngernbamrung
Connect Indicator is a tool used for connecting indicators between the MQL market and MT4. The connected indicators are made by our group and can be used for other applications, such as sending messages to the Line application or Telegram application. If you have any questions, please don't hesitate to ask us to receive support. Function and indicator buffer Buffer one is the high price of the previous candle. Buffer two is the high price of the previous candle. Usage To connect indicators to fu
Moving pivot Average Fibonacci The  indicator compares the selected period with its counterpart from the previous period. The indicator determines the moving Fibonacci levels for the day or any time interval to assess the price movement range from the time average. The indicator helps predict the expected high or low for the day based on historical time data. The pivot line can be considered an average trend line and use it in a variety of trading strategies. If you have any question about t
Currently Price 20% OFF ( for unlimited use )   BONUS  AUX VIP Club 2024 : Include  EA Airbag  and  Load Data History  to enhance the performance of this tool to its maximum potential  Click Here to Download Files   ( for users only )   Hello World! Introducing.. SMCpro VIP tool and Indicator for MetaTrader 4, designed to revolutionize your trading experience with the ICT Smart Money Concept. This system is meticulously crafted to empower traders with advanced insights and precision in
Full STO
Roman Smoroda
전체 STO 표시기 (프리미엄, 골드, 실버의 세 가지 STO 표시기의 모든 버전 포함)-안정적인 거래 옵션은 자동 바이너리 옵션 거래를 위해 설계되었습니다.  주의 깊게 읽기!!!!! 중요 하나의 터미널에서 만기가 다른 두 개의 템플릿, 즉 18:01, 18:02의 만기가 1 분에서 15 분인 템플릿과 10 분에서 20 분의 만기가 22:00 인 템플릿을 만듭니다. 승률: 지난 5년간 71% 자금 관리: 예치금에서 0.3 이 버전의 지표는 모스크바 시간 18:01, 18:02, 22:00 거래 전용으로 설정되며 실버 및 금의 경우 1에서 15까지, 프리미엄 버전의 경우 10에서 20 분까지 만료됩니다. 신호는 양초 내부에 나타나고 커넥터를 사용하면 양초 내부에 마크 개구부를 넣으면 즉시 거래를 시작합니다. 표시기가 완전히 구성되었으므로 직접 변경할 필요가 없습니다. 설치 및 거래 !!! 확인 및 테스트없이 지표를 구입하지 마십시오. 실제 계정에서
WARNING: PRICE IS SUBJECT TO RISE AT ANY TIME. GET YOUR COPY TODAY TO AVOID MORE COST! Dear Traders I am so glad to introduce to you my other tool called the Forex Sniper Entries Indicator. This tool is designed to help serious traders and investors capture big moves in the currency price movements. The philosophy behind this tool is all about winning big and riding the price movement from its beginning until the maximum point. We want to capture those big moves in both down and up markets as mu
WARNING!! THIS SWORD IS TOO SHARP!    ONLY 10 COPIES LEFT FOR THE NEXT PRICE TO BE 8,000$ FOR UNLIMITED PLAN. Dear traders I am very glad once again to introduce to you my other tool called "Forex Sword Indicator". In short this tool is meant to give you an edge over the market that you have been waiting for  so long. Now, here it is. It is a very very simple tool but yet a dangerous sword. I call it a  Holy grail indicator!. I will not talk a lot about this tool. Just let the tool speak by itse
Limitless MT4
Dmitriy Kashevich
Limitless MT4 is a universal indicator suitable for every beginner and experienced trader. works on all currency pairs, cryptocurrencies, raw stocks Limitless MT4 - already configured and does not require additional configuration And now the main thing Why Limitless MT4? 1 complete lack of redrawing 2 two years of testing by the best specialists in trading 3 the accuracy of correct signals exceeds 80% 4 performed well in trading during news releases Trading rules 1 buy signa
Alqannas
Mouhcine Haddad
ALQANNAS (Sniper) Indicator Overview: Welcome to ALQANNAS, your ultimate sniper in the forex market! ALQANNAS is a powerful and versatile trading indicator designed to enhance your trading experience. Whether you're a beginner or an experienced trader, ALQANNAS provides you with accurate non repainting signals, trend direction and strength, and advanced features to elevate your trading strategy.   Key Features: Buy and Sell Signals: ALQANNAS is equipped with a sophisticated algorithm that genera
MT My Way
Issara Seeboonrueang
Best strategy,  Easy trade ,  Support of version update in the future MT My Way:  For new traders with no experience It is a very simple trade. Open the order when there is signal and close the order when there is exit or found the next opposite signal. You can set Stop Loss at the arrow and set the distance at Arrow Gap. For experienced traders, It will be very easy to trade. indicator for trade by yourself TRADE: Forex  TIME FRAME:  All Time Frame (Not M1) SYMBOL PAIR: All Sy
IA Trendx3 PRO
Marco Aurelio Santos Costa
What if God Created a Trade System? No miracles... Just see how mathematics can be effective in the market. We managed to combine technical analysis / price action into indicators, creating the best setup for trading, be it in Forex, Indices, or stocks. It took us 2 years to create something that really works, and now it's time for you to discover it. TrendX3 is a revolution in trend analysis. Based on advanced algorithms and real-time data, it provides valuable insights so that you can make inf
Binary Deal Trading
Sukunthakan Ngernbamrung
1 (1)
. Simple Trading System Update !!! Follow this link to see our 2023 Strategy !!!   (See results and download the auto trade tool) Description Binary Deal Trading Indicator is an indicator on MT4 for Binary Option Trading. It forecasts the overbought / oversold level, Reversal and Fractal point. This indicator will help you to decide a reversal price on any time frame (Recommend M1, M5 and M15). The expiry time is 5-15 minutes after receive signal.   Features High w in rate Non-repaint signal
Weis Wave with Alert
Trade The Volume Waves Single Member P.C.
4.81 (21)
Limited time offer 40% Discount on six month, yearly and lifetime packages. Offer ends 31/8/2024. Six Month from 209$ to 125$ Yearly from 379$ to 227$ Lifetime from 599$ to 359$ Rental/Lifetime Package Options and Privileges' * For optimum results the yearly or lifetime package is suggested due to live training and Discord  channel trading with the  creator! Rent Monthly Six Months   Yearly/Lifetime Weis Wave with Speed with Alert+Speed Index x x x Manual  x x x Quick Set up Video x x x Blog x
OFFER! OFFER! NEXT Price Will be 650$ and the rental option will be removed after this. Don't miss the current price offer before it is too late. Dear Traders I am so glad to introduce my Super Powers Indicator.  The purpose of this trading tool is to help serious traders who want to make trading one of their main source of income.  I know trading is not an easy task but if you have the right tools, knowledge and motivation to trade then you are ready to go in this industry. My role is to help y
Weddell Pro
Dmitriy Kashevich
Weddell Pro is a good trading tool that is suitable for both a beginner and an experienced trader. It can be used both separately and combined with other strategies and indicators Configured for currency pairs was tested several times on cryptocurrency but did not show a high result Currency pairs USD/EUR AUD/CAD GBP/USD Showed itself very well here The percentage of correct transactions is above 68%, which does not make it perfect and bad Doesn't draw or disappear The red arrow sho
제작자의 제품 더 보기
The indicator displays 4 current levels between which the price is located. The levels are calculated based on the range of the previous day. The number and value of levels is arbitrary and expressed as a percentage. The position of the levels is calculated from the minimum of the previous day (an example can be found in the description of the parameters). It is advisable to place the levels in the settings line in order, nevertheless, the indicator will sort them by itself and if levels are fou
Displays the readings of the Moving Average indicator on the older timeframe. Wishes for other types of Moving Average are accepted (however, the possibility of implementation depends on the type of algorithm). It doesn't make sense to apply it to the current timeframe - there are free indicators for this. Does not redraw the readings starting from the first bar. It is very important to have and match the history of the timeframes on which it is installed and set in the settings. A simple built-
The next version of the indicator based on the range of previous day. Considers a difference of time zones. By default works the time zone of the broker. Can work on time zones: Greenwich, broker or local.  It can be applied only on timeframe from H1 below. If the day range of new day is lower minimum, then minimum is transferred from ranges of previous day symmetrically concerning the line of closing previous day (optionally, look Input parameters ). Screenshot 1: operation of the
In indicators the positive scale often unreasonably is accepted though in fact they are the symmetric. Such property has also standard RSI. The presented indicator works in the scale, symmetric concerning zero, but at the same time completely repeats an original form. In this indicator important levels 20 and -20. It is very convenient at its use in automatic trade as application of one threshold by optimization excludes overoptimization. Besides, the algorithm of calculation of the indi
ZigZagHistory
Aleksandr Martynov
The indicator was developed with one purpose - adequate processing on stories and the maximum approach to the original (it was required for development of more difficult indicator and use in the expert). I think, everything who tried to get history from the original indicator understood that in it there is information only on extrema and nothing more. It is not sure that similar does not exist, but mine is found on other than original to an algorithm: - for one pass (programmers will understand)
The indicator is constructed on the basis of ZigZagHistory ( https://www.mql5.com/ru/market/product/37376 ). At the same time calculated on the current timeframe and on the specified high. The history of the high timeframe is displayed by hollow squares. The history of a current timeframe is displayed by rhombuses. Colors and the sizes of signs can be adjusted. Attention!  The Price noise parameter - has significant effect on formation of extrema. Parameters: High TimeFrame (HTF) - the high ti
This indicator is based on the previous option ( https://www.mql5.com/ru/market/product/37376 ) and includes all completions at the time of creation. Availability of additional data allows to understand more deeply the principle of work as this indicator and original. Points on extrema of bars show history of a portrayal of extrema as before. Levels of a reverse show as far as the price for formation of a new shoulder has to deviate. The Price noise parameter has a special impact (the name "devi
ZigZag Minimal
Aleksandr Martynov
The indicator is made on the basis of the algorithm put in the ZigZag History indicator ( https://www.mql5.com/ru/market/product/37376/ ). In the real option there are no additional buffers and an opportunity to trace work history. It causes the minimum involvement of random access memory, however productivity practically does not improve. Attention!  The Price noise parameter - has significant effect on formation of extrema. Parameters: Depth  - is depth of search of a local extremum in bar
The RSI Symmetric indicator approximated by function of the known Buzzer indicator. Display for the high timeframe is provided. 2 types of signals are of interest: 1. Position of the RSI line concerning the approximated line 2. The trend direction of the approximated line  Indicator parameters: RSI TimeF rame - the worker  timeframe (it has to be equal or more than current); RSI Period - no comments; Buzzer Period is the period of approximation of the RSI Symmetric indicator; B
Индикатор отображает 4 текущих уровня между, которыми находится цена. Уровни вычисляются на основе диапазона предыдущей недели. Количество и значение уровней произвольное   и выражается в процентах . Положение уровней отсчитывается от минимума предыдущего дня (пример можно посмотреть в описании параметров). Целесообразно размещать уровни в строке настроек по порядку, тем не менее индикатор сам их отсортирует и если обнаружатся уровни отстоящие менее чем на 1% выдаст ошибку. Индикатор работает н
ZigZag Level
Aleksandr Martynov
One of the disadvantages of the ZigZag indicator when working with advisers is the need to find the latest extremes. For this purpose, various algorithms of history analysis in indicator buffers are used. However, the indicator itself knows these values and can therefore display them. To this target, the ZigZag Minimum indicator ( https://www.mql5.com/ru/market/product/37975 ) has been refined. The zero buffer stores the value of the last maximum. The first buffer stores the value of the last m
ZigZag Mini Extra
Aleksandr Martynov
Not a logical continuation of the ZigZag indicator series is an indicator cut to an absolute minimum. An important property of this indicator is that it will never redraw the value of a completed bar. Based on previous indicator algorithms, e.g. ( https://www.mql5.com/ru/market/product/37975 ). Parameters: Depth  - is depth of search of a local extremum in bars; On minute calc  - is switching ON/OFF of calculation on minute bar (it is switched off - calculation on each tic).
The proposed indicator is based on the ZigZag Mini Extra indicator ( https://www.mql5.com/ru/market/product/42632 ). Unlike the prototype can be built at the price of Close or High-Low with the established timeframe. The prices of the current timeframe will be used when calculating the indicator on the highest timeframes at Close price, . Indicator parameters: ZigZag TimeFrame = PERIOD_CURRENT - operating time frame (must be equal or more than current timeframe); Depth = 12 - depth of
The ZigZag indicator is based on the RSI indicator. This makes it possible to identify significant extremes. Different calculation options are provided: - RSI indicator at Close or Hi-Low prices (1 and 2 buffers respectively in OnClose mode - the first buffer, in Hi-Low mode the first buffer at High price, the second buffer at Low); - ZigZag indicator by period (standard) or minimal deviation. (The ZigZag indicator values are always in zero buffer.) If you use a higher timeframe, make s
Trend Ranger
Aleksandr Martynov
The indicator does not use predictions. It merely shows what range the price is in. However, it does a good job with chart markings and mapping current trade preferences. It can act as an independent tool of medium and long-term urgent trade, and together with oscillators it is possible to build a good scalper system. Important! The signal is 0 bar - does not repaint! Indicator parameters: Zone Range (Pips) - size of zone in pips excluding the number of characters; Line or Histogram Wid
Based on the course records of Yuri Antonov (academyfx.ru) YouTube Channel: https://www.youtube.com/playlist? list=PLj3wALUOwoZ9kdacS09K9bjD1zulR _ HJh The indicator is intended for people who know the strategy but find it difficult to mark the graph.  Approaches the new Intensive MD system. The default parameters are set as of mid-2019. For a 5-digit EURUSD account! You can work on the 4-character after the parameters are recalculated. The current parameters can be found on the autho
Trend Ranger XO
Aleksandr Martynov
Аттракцион невиданной щедрости - треть цены! Индикатор отображает на графике другой популярный индикатор XO, представленный на рисунке в подвале. Важно! Сигнальным является 0 бар - не перекрашивается!  Параметры индикатора: Zone Range (Pips)   - размер зоны в пипсах без учета количества знаков; Line or Histogram Width   - ширина линий или гистограммы;    Zone Draw Type  - способ отрисовки зон: в виде гистограммы или линий на графике; Up Zone Color   -  цвет зоны BUY; Down Zone Color   - цвет з
Аттракцион невиданной щедрости - треть цены! Сканер Heiken Ashi на четырех таймфреймах. Индикатор не рисует и не подсматривает историю. Модифицированный расчет повышает чувствительность! Возможно отключить модифицированный расчет для каждого таймфрейма отдельно, а также отключить анализ 4 таймфрейма. В нулевом (скрытом) буфере хранится информация о совпадении трендов на всех рабочих ТФ. Эта опция упрощает анализ и чтение из советников. Требователен к истории. Наиболее простое отсутствие данн
Indicator from the Real Non RePaint MultiTimeFrame (Real NRP MTF)  series. Specially designed to display the RSI standard indicator reading from the Senior TimeFrame (TF) to the Junior. The indicator differs from the standard scale - symmetrical relative to 0. Add 50.0 to the readings to get the standard values. Does not look into the future for history at the senior TF. DOES NOT DIFFER from the standard real-time indicator readings (including bias), but shows the actual indicator readings on th
Indicator from the Real Non RePaint MultiTimeFrame   (Real NRP MTF)  series. The indicator is based on the standard one. Does not redraw in any mode: the last closed candle is a rock. Does not look into the future for history at the senior TF. The formula for sensitivity enhancement has been changed (disabled in settings). It works on the current TF or older ones with the display on the current one. The last closed Heiken Ashi candle of the current timeframe before the opening of the new senior
Indicator from the  Real Non RePaint MultiTimeFrame  (Real NRP MTF) series. Specially designed to display the standard Stohastic indicator from the senior timeframe (TF) to the junior. The indicator differs from the standard scale - symmetrical relative to 0. Add 50.0 to the readings to get the standard values. Does not look into the future for history at the senior TF. DOES NOT DIFFER from the real-time standard indicator (offset-based), but shows the actual indicator counts on the history
Индикатор содержит 3 RSI с возможностью выбора рабочего таймфрейма, периода и параметра сглаживания каждого. Не перерисовывает начиная с 1 бара. При задании параметра сглаживания большего 1 показания будут обработаны специальным образом, для исключения мелких колебаний. Возможно использовать в качестве готовой торговой системы, где показания старших ТФ определяют тренд, а младший используется для поиска точек входа, в качестве примера может служить система Дмитрия Брылякова  https://www.infoclub
Dynamic Fibo Level
Aleksandr Martynov
Индикатор отображает динамические разворотные уровни по шкале Фибоначи. Основан на индикаторе ЗИГ-ЗАГ, который управляется периодом и минимальной глубиной для переключения тренда. Если указать глубину переключения равной 0, то она не будет участвовать в расчетах индикатора. Используется неперерисовывающий сформированные вершины индикатор - возможны несоответствия экстремумов со стандартным индикатором ЗИГ-ЗАГ. Расчитывается на закрытом баре, действие зоны отображается для текущего бара. Основные
필터:
리뷰 없음
리뷰 답변