CPR Pivot Lines
- 지표
- Hiren Parekh
- 버전: 1.0
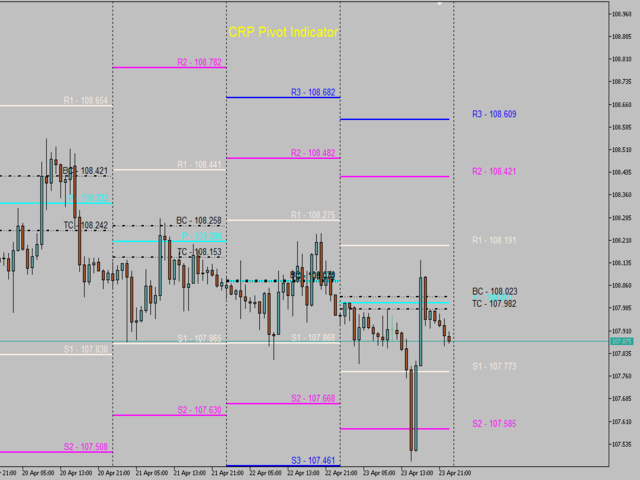
CPR Pivot Lines
It Will Draw
Pivot Point
R1,R2,R3
S1,S2,S3
Tc
Bc
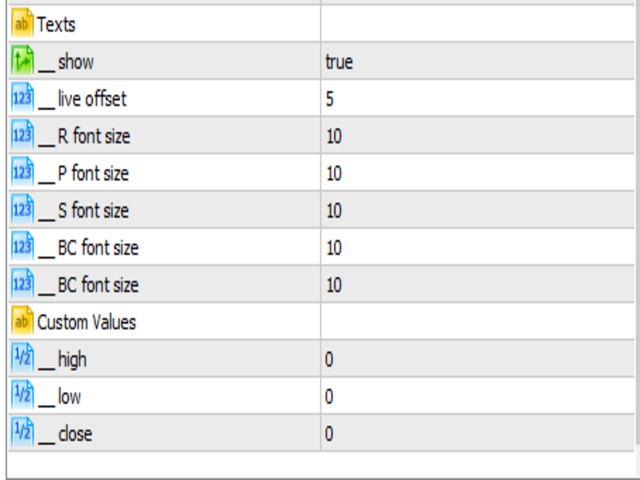
Best Part Is That You Can Even Add Values Of High,Low,Close Manually Also To Get Your All Levels On Chart. So If Your Broker Data Of High ,Low ,Close Is Incorrect Then You Don’t Have To Depend On Them Anymore.
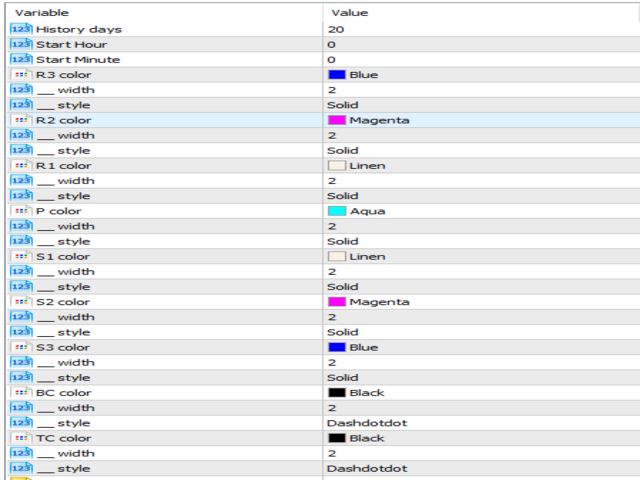
You Can Even Modify All Lines Style.
It Will Show Line In Floating Style And Not Continues Mess.


Super !