Whatch and Candle Alarm Osw MT4
- 지표
- William Oswaldo Mayorga Urduy
- 버전: 1.1
- 활성화: 5
Osw Watch for METATRADER 4
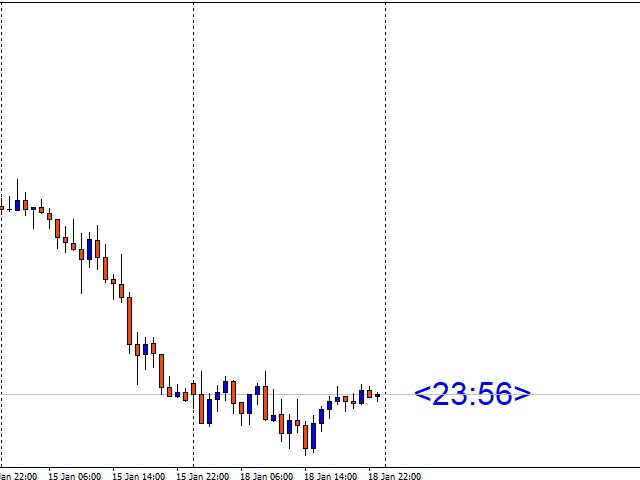
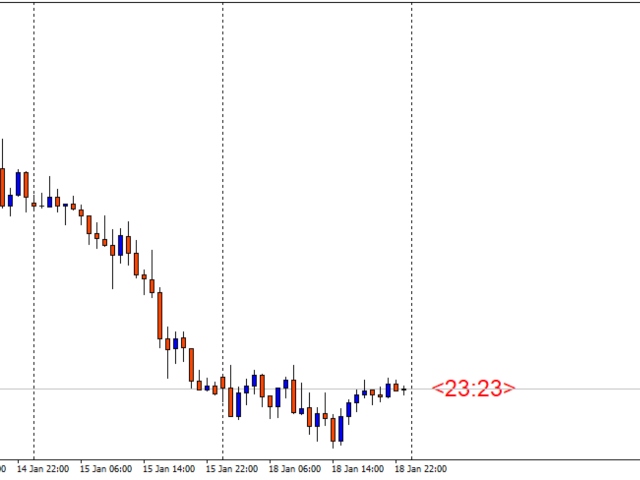
This is an indicator that shows the remaining time for the current candle to expire on a watch, this is always located next to the last candle following the price, the numbers are shown the same as in the images, and can be modified both in size and color.
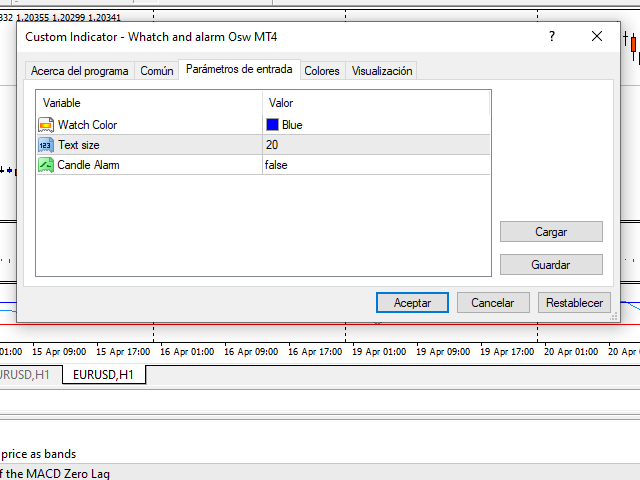
between your settings you can set:
the size of the numbers showing the time.
the color of the numbers showing the time.
Also within the configuration you can activate and deactivate so that an alarm sounds each time a new candle starts.
(Don't forget to check my other indicators)