Break out Magic Season
- 지표
- Mohammadal Alizadehmadani
- 버전: 4.1
- 업데이트됨: 6 5월 2021
- 활성화: 5
<< See how it works on YouTube >>
Possibilities:
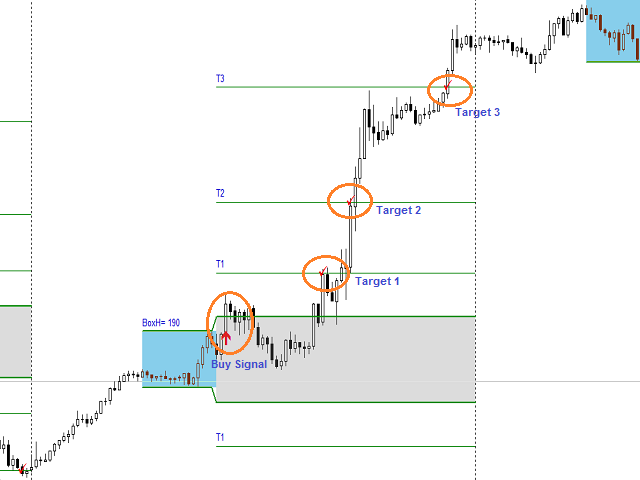
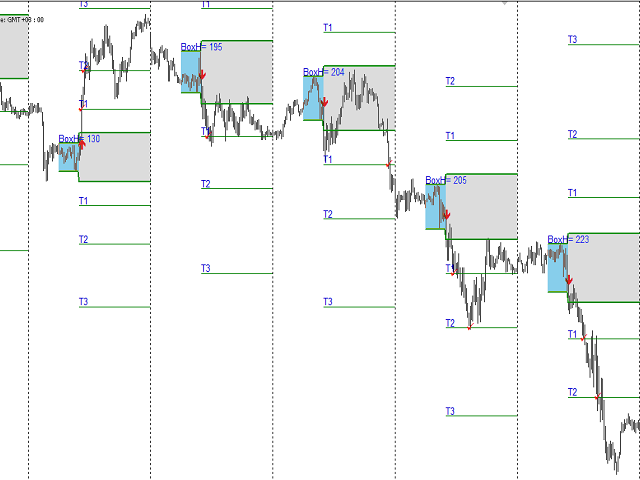
- Arrow signal to buy, sell and hit the targets
- Alert signal
- send mail
- Execute custom audio file
The Break Out Magic indicator monitors price fluctuations over a set period of time (adjustable rectangle). Then, according to the maximum and minimum price, in the second rectangle, it determines the outline break lines. And sets 3 goals to exit from each side.
In the settings we have:
Start Time: Start time of range
End Time: The end of range time
Expiration Time: Expiration break out time
Offset: The distance from the top and bottom for more security
Maximum range: Maximum allowable range
Minimum range: The minimum allowable range
Days displayed: days when the indicator is displayed in the past of the market.
range Color: The color of the first rectangle
range Color: The color of the second rectangle
Text Color: The color of the displayed text
Target Color: The color of the displayed targets.
Text Offset: The distance between text and objects
사용자가 평가에 대한 코멘트를 남기지 않았습니다