Cycles Forecast
- 지표
- Pooriya Alirezaee
- 버전: 1.2
- 업데이트됨: 14 4월 2021
- 활성화: 5
This indicator is based on a mathematical formula and an ANN combined, designed to make a model(using previous prices) of the most recent market condition (any chart*) in order to use the model as a forecasting tool.
*This indicator can operate on any chart/timeframe, but it's suggested you use multiple timeframes for each trade because this method relies solely on the time factor, you can not use this indicator to predict price volatility, but if it's fit correctly it will show you when the next High/Low will be happening( Ex: if you're an intraday trader you can first find a good model on a daily/12h/4h timeframe as your trend, then find models on smaller timeframes as entry/exit points. ).
Imagine knowing when the highs and lows are going to be, then it won't really matter how much the price changes as long as you know when to enter or exit!
Sometimes you will encounter models which are exact opposites of your fitting sample, those models are also viable to be used for forecasting.
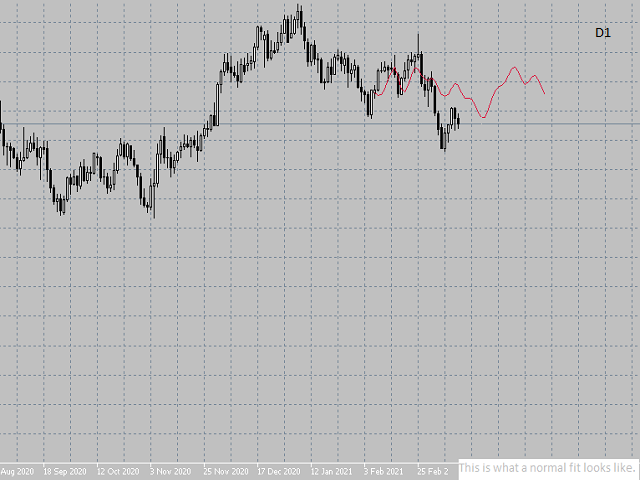
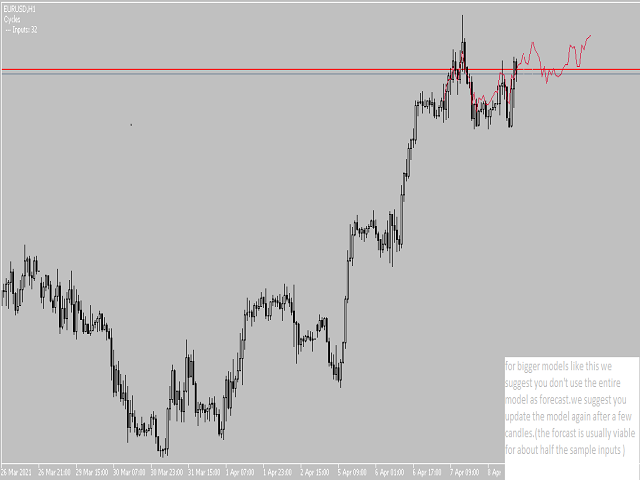
There are a few examples in the pictures.
Fitting the model is an automatic process but inputs optimization has to be done manually. if you don't change the input on the indicator manually, the number of fitted models you can find for forecasting reduces dramatically. so it's suggested you fit the models manually in order to produce best results.
There are 3 control keys provided on your keyboard for easier & faster optimization.
Inputs: this number decides how big your fitting sample will be.
AutoRecalculate On New Candle: this will decide if the indicator should recalculate with every new candle or if you want to keep your fitted model until you recalculate manually.
All the pictures are from the EUR/USD currency pair.


