• 미리보기
  • 리뷰
  • 코멘트
  • 새 소식

Multi Temporalities Osw MT5

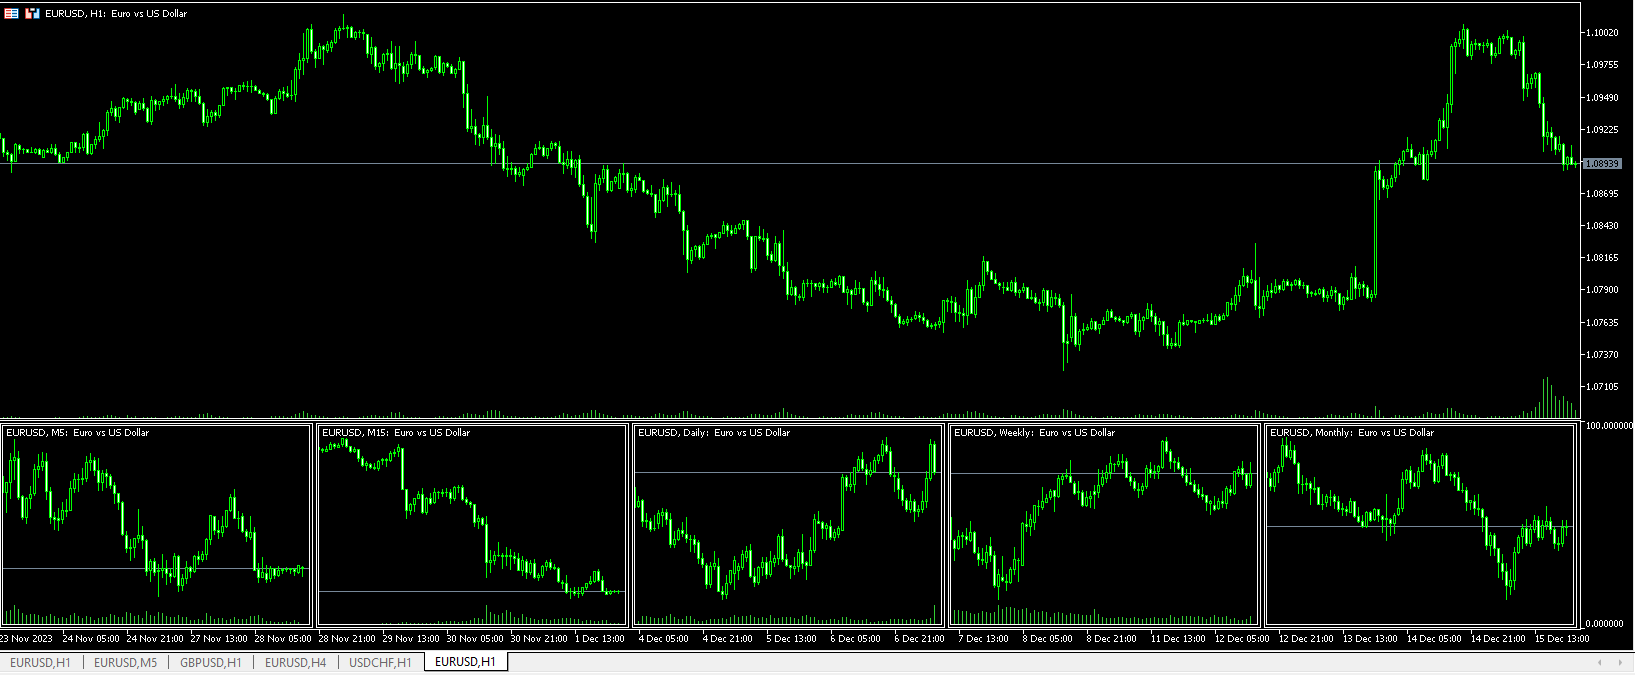
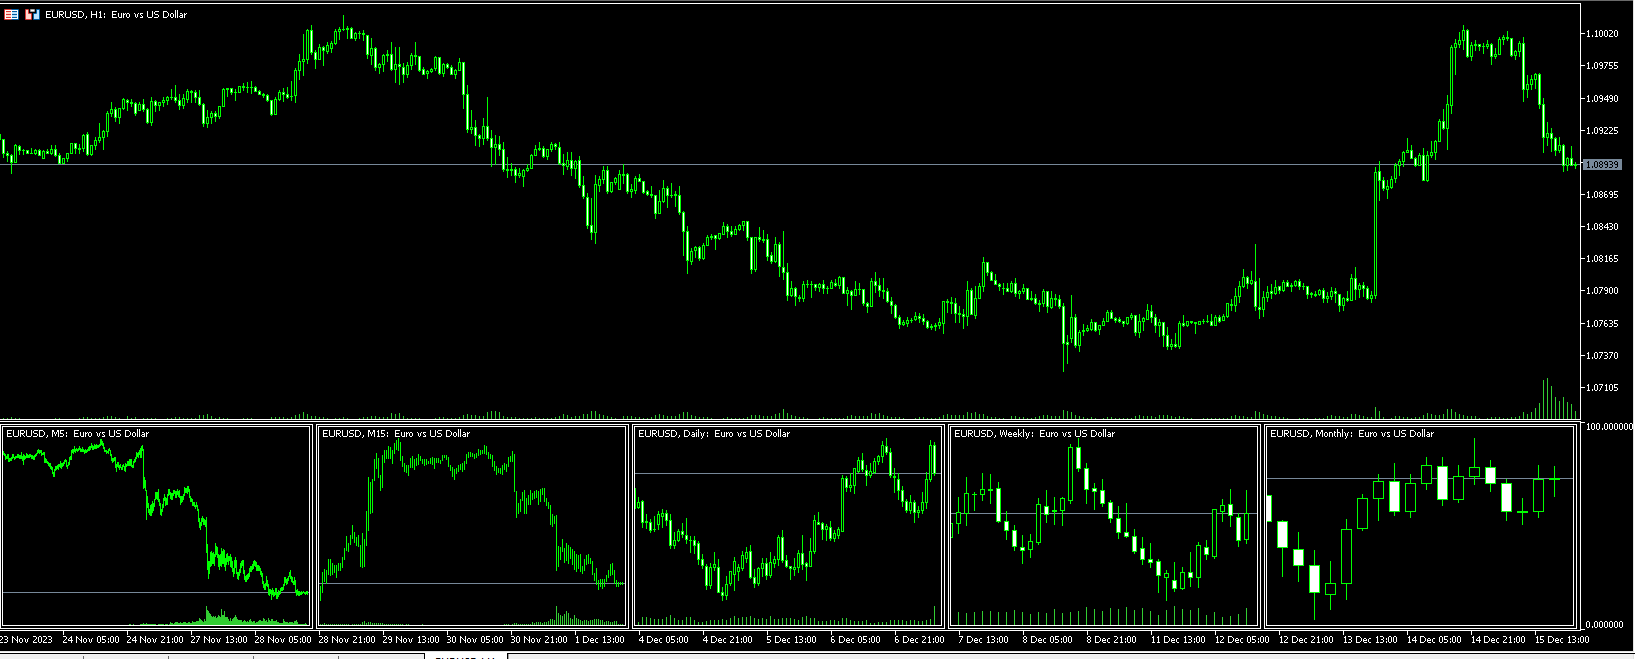
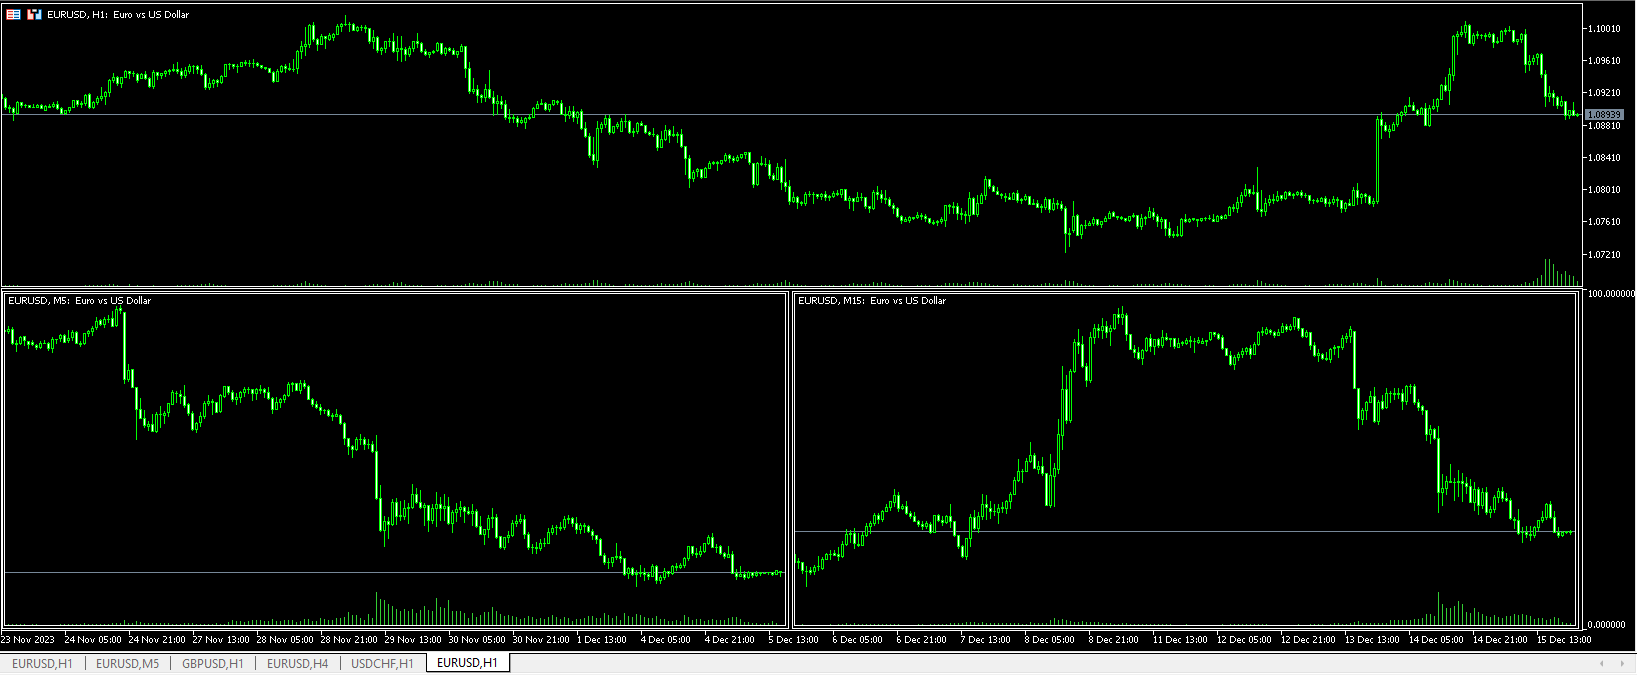
MULTI-TIMES FOR METATRADER 5

This indicator, in a lower window, shows the current chart in different timeframes, this can help you better decipher the market, taking into account the higher timeframes.

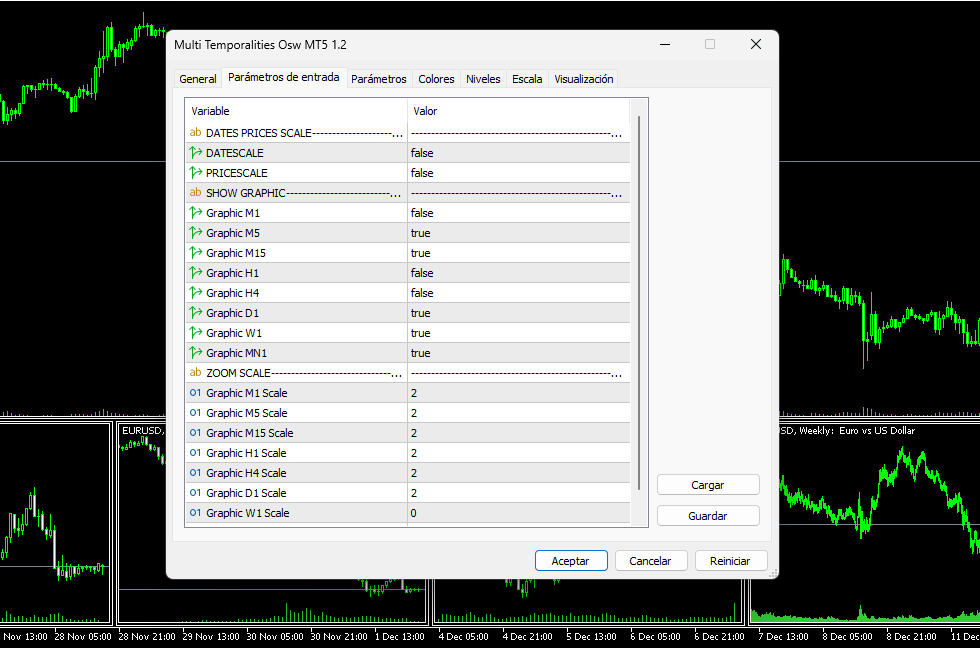
Among the settings that you can modify are:

view of prices in charts
view of the temporalities in the graphs
enable each of the graphics in the different temporalities
(M1, M5, M15, H1, H4, D1, W1, MN1).
추천 제품
--- StudentK Sync Chart --- 1. Move charts at the same time 2. Cross check among different Symbols and Timeframes 3. Plan your own trading strategies --- Context --- StudentK is not indicated as a master or K Sir for knowledgeable person who claims for winning all the time. (But lots of traders should know the fact that it is rarely truth, especially in fluctuated period of time) StudentK is a group of years-experienced traders who want to share amazing tools in Free and Paid versions. Aiming
Higher Time Frame Bars
Rajesh Kumar Nait
5 (1)
이 지표는 동일한 차트에서 추적하려는 다른 기간 캔들스틱을 효율적으로 추적합니다. 1. 동일한 차트에 막대를 로드하려면 더 높은 기간을 선택하세요. 2. 촛대의 색상과 스타일을 사용자 정의하세요 3. 캔들스틱을 그릴 막대 수를 선택하세요. 4. 심지 및 몸체와 함께 더 높은 기간의 전체 양초를 추적합니다. 5. 차트 전환을 원하지 않는 사람들을 위해 쉽고 편리합니다. 이 지표는 동일한 차트에서 추적하려는 다른 기간 캔들스틱을 효율적으로 추적합니다. 1. 동일한 차트에 막대를 로드하려면 더 높은 기간을 선택하세요. 2. 촛대의 색상과 스타일을 사용자 정의하세요 3. 캔들스틱을 그릴 막대 수를 선택하세요. 4. 심지 및 몸체와 함께 더 높은 기간의 전체 양초를 추적합니다. 5. 차트 전환을 원하지 않는 사람들을 위해 쉽고 편리합니다.
Rocket Trend
Andriy Sydoruk
The Rocket Trend indicator is trending. The indicator draws two-color points connected by lines along the chart. This is a trend indicator, it is an algorithmic indicator. It is easy to work and understand when a blue circle appears, you need to buy, when a red one appears, sell. The indicator is used for scalping and pipsing, and has proven itself well. Rocket Trend is available for analyzing the direction of the trend for a specific period of time. Ideal for novice traders learning the laws o
MTF Candles PRO
Renato Fiche Junior
1 (2)
Tool that allows viewing candles in multiple timeframes. This way, it helps the analysis in multiple timeframes. This is another product developed by Renato Fiche Junior and available to all MetaTrader 5 users! Input Parameters - Option 1 - TimeFrame: Standard MT5 timeframe - Option 2 - Custom TimeFrame (in minutes): Or, if this value is different from zero, the timeframe will be customized. This allows you to choose timeframe other than the MT5 standard. - Total Candles: Number of candles. -
UT Bot Alerts MT5
Mohammad Taher Halimi Tabrizi
5 (2)
This indicator is converted from UT Bot alerts indicator by @QuantNomad of Trading View to MT5. its considering ATR and creating new candles on chart and also is giving good entry points based on its candles. all buffers of new candles and also entry signals are included as buffer so can be used easily on any EA. there are also some different strategies on the internet that can be used or contact me to create it for you.
Ali Levels Pro
Alexandra Voicu
Ali Levels Pro is an indicator designed to identify and draw levels of interest including: Opening Range High/Low with seconds precision,  Previous Session High/Low (if you are a Intraday trader who trades Indices or Commodities maybe you want to know yesterday New York Session high and low),  Overnight Session High/Low,  Previous Day High/Low,  Previous Week High/Low, and  Previous Month High/Low. Traders use this levels as support and resistance levels.  By searching for confluences between
KT Price Border MT5
KEENBASE SOFTWARE SOLUTIONS
KT Price Border creates a three-band price envelope that identifies potential swing high and low areas in the market. These levels can also be used as dynamic market support and resistance. The mid-band can also be used to identify the trend direction. As a result, it also functions as a trend-following indicator. In addition, its ease of use and more straightforward conveyance of trade signals significantly benefit new traders. Features It works well on most of the Forex currency pairs. It wo
Advisor for hedging trading or pair trading. A convenient panel allows you to open positions on the necessary trading instruments and lots. Automatically determines the type of trading account - netting or hedging. Advisor can close all its positions upon reaching profit or loss (determined in the settings). A negative value is required to control losses (for example, -100, -500, etc.). If the corresponding fields are 0, the EA will not use this function.   Settings: Close profit (if 0 here
Go Ferramentas
Fabio Oliveira Magalhaes
This product is a set of tools that help the trader to make decisions, bringing information from different categories that complement each other: trend, support / resistance and candle patterns. It also has a panel with information about the balance. The trend has two different calculations and is shown as colored candles. Strategy 1 is longer, having 3 different states: up, down and neutral trend. Strategy 2 has a faster response and has only 2 states: up and down trend. Support and resistance
Engulfing Candle Alert MT5
Prafull Manohar Nikam
This is a simple arrow system based on Engulfing Candlestick Pattern. It gives you alerts on your smartphone when there is an engulfing candlestick pattern happens. Which type of alerts available? 1. It paints on chart Up/Down Arrows. 2. Popup message and sound alert in trading terminal window. 3. Push notification or Alert on your Android and IOS mobile phones (requires MT4 or MT5 app installed!) *Note: Use it on higher timeframes like H4 (4 hours), D1 (1 Day) then find trade opportunities on s
FRB Day Points
Fernando Baratieri
Day Points Indicadtor that shows the points considered important for X days. (Open,Close, High, Low) Used a lot by those who do day trade. These points can be used for decision making by a trader. You will choose the amount of days ago for it to show. Settings High/Low/Close/Open Show - True/False. Days - Number of days that will show on the chart. Color - Line Color. Style - Line Style.
KT Horizontal Lines MT5
KEENBASE SOFTWARE SOLUTIONS
In MetaTrader, plotting multiple   horizontal lines   and then tracking their respective price levels can be a hassle. This indicator automatically plots multiple horizontal lines at equal intervals for setting price alerts, plotting support and resistance levels, and other manual purposes. This indicator is suitable for Forex traders who are new and looking for chances to make quick profits from buying and selling. Horizontal lines can help traders find possible areas to start trading when the
To download MT4 version please click here . - This is the exact conversion from TradingView: "Linear Regression Candles" By "ugurvu". - The screenshot shows similar results from tradingview and Metatrader when tested on ICMarkets on both platforms. - The overall look of the indicator is like Heiken Ashi. - It can be used as a trend confirmation indicator to detect the right trend direction. - This indicator lets you read the buffers for Candles' OHLC. - This is a non-repaint and light processing
이 지표는 실제 거래에 완벽한 자동 파동 분석 지표입니다! 사례... 참고:   웨이브 그레이딩에 서양식 이름을 사용하는 데 익숙하지 않습니다. Tang Lun(Tang Zhong Shuo Zen)의 명명 규칙의 영향으로 기본 웨이브를   펜   으로 명명하고 2차 웨이브 밴드를   세그먼트   로 명명했습니다. 동시에, 세그먼트에는 추세 방향이 있습니다.   주요 추세 세그먼트에는   이름이 지정되지만(이 이름 지정 방법은 향후 노트에서 사용됩니다. 먼저 말씀드리겠습니다.) 알고리즘은 굴곡 이론과 거의 관련이 없으므로 그렇게 해서는 안 됩니다. 이는 나의 시장 분석을   통해 요약된 끊임없이 변화하고 복잡한 운영 규칙을   반영합니다. 밴드는 더 이상 사람마다 다르지 않도록 표준화되고 정의되었습니다. 인위적인 간섭의 드로잉 방법은 시장 진입을 엄격하게 분석하는 데 핵심적인 역할을 합니다. 이 지표를 사용하는 것은 거래 인터페이스의 미학을 개선하고 원래의 K-line 거래를
The Telegram Blue Chili Alerter is still in full development. Many more options are still being programmed. Signals for trades will be added next. I am also happy to respond to customer requests. The only thing you need to do is create a Telegram bot and enter the bot token and chat ID in the presets. If you have any questions or want to know which features are still to come, just get in touch with me. I will be happy to help you and answer your questions as quickly as possible. Quick guide: 1:
QuantumAlert Stoch Navigator is a free indicator available for MT4/MT5 platforms, its work is to provide "alerts" when the market is inside "overbought and oversold" regions in the form of "buy or sell" signals. This indicator comes with many customization options mentioned in the parameter section below, user can customise these parameters as needful. Join our   MQL5 group , where we share important news and updates. You are also welcome to join our private channel as well, contact me for the p
FREE
To download MT4 version please click here . This is the exact conversion from TradingView: "WaveTrend [LazyBear]" By "zeusuk3". One of the coolest indicators out there to detect overbought and oversold zones. It can be used as a part of more complicated strategy and for confirming a potential trade setup. There are buffers to use in EAs also. The indicator is loaded light and non-repaint. - You can message in private chat for further changes you need. Thanks for downloading 
대칭 삼각형, 비대칭 삼각형 또는 직각 삼각형과 같은 삼각형 패턴, 상승 쐐기 또는 하강 쐐기와 같은 쐐기 패턴, 확장 패턴 및 추세 채널에 대한 패턴 탐색기 이 지표는 과거의 패턴과 현재의 패턴을 탐색하며, 수동으로 추세선이나 삼각형을 그려 시간을 절약하고 차트에 가장 좋은 패턴을 그리는 자동 분석에 사용하려는 사람들에게 가장 적합한 지표입니다. 특징 : - 최적의 패턴을 조정하고 찾기 위해 즉시 ZigZag 확장 깊이를 변경하는 패널 - 패턴을 지그재그의 이전 막대로 다시 이동하여 과거에 발생한 일을 탐색하고 추세선이 존중되는지 여부를 탐색하고 가격 동작을 이해할 수 있습니다. 이 지표를 사용하여 이전의 과거 패턴을 탐색하고 분석하고 학습하여 마스터 전략을 도출합니다. - 전환 버튼에서 추세 채널 또는 추세선에서 쐐기 또는 삼각형 모드로 즉시 전환 - 패턴이 변경되지 않도록 일시 중지하고 경고에 대한 가격 터치를 계속 확인합니다. - 레벨 터치에 대한 다양한 유형
Retracement Feeder MT5
Innovicient Limited
The Retracement Feeder  checks for retracement opportunities after the first move has occurred.  Basically it scans for the second wave of trend. Works with any financial instrument,  It does not repaint/change color or cancel arrows, Easy to set and use. Works great with Renko Charts ________________________________________ MT4 version  | Best used with :  Market Heart MT5 | How it works The indicator is based on RSI and Stochastics.  The algorithm used in the Retracement Feeder allows the Stoc
A useful scanner/dashboard that shows the RSI values for multiple symbols and Time-frames. It can be easily hidden/displayed with a simple click on the scanner man top left of the dashboard. You can input upper and lower RSI values and the colours can be set to show when above/below these values. The default values are 70 and 30. There are also input colours for when the RSI is above or below 50 (but not exceeding the upper/lower levels Symbols and time-frames are input separated by commas. S
HIGH and LOW OTT
Mohammad Taher Halimi Tabrizi
This product is converted form Trading View of Kivanc Ozbilgic to be used on MT5 and below are descriptions of developer on Trading View: Anıl Özekşi's latest development on his precious OTT - Optimized Trend Tracker: In this version, there are two lines of OTT which are derived from HIGHEST price values (HOTT) and LOVEST price values (LOTT) which were originally sourced to CLOSE values on default OTT. Another significant difference is there is no Support Line (Moving Average) in this version
Introduction to Fractal Pattern Scanner Fractal Indicator refers to the technical indicator that makes use of the fractal geometry found in the financial market. Fractal Pattern Scanner is the advanced Fractal Indicator that brings the latest trading technology after the extensive research and development work in the fractal geometry in the financial market. The most important feature in Fractal Pattern Scanner is the ability to measure the turning point probability as well as the trend probabil
Three Candles Pattern
Edson Cavalca Junior
5 (1)
The patterns of 3 (three) Candles: Three White Soldiers; Three Black Crows; These are reversal patterns widely used by traders, as they have a high probability of showing the inversion of the current market movement. For example, if in a bullish trend there are three black crows, there is a high probability of reversing the current bullish movement. The Three White Soldiers have the following characteristics: There are 3 consecutive candles with a good body, that is, the difference between th
Price Guide Full
Robson Ferreira
Functional in the Forex market. Functional on the B3 market - Bolsa Brasil Balcão. Motivation The Price Guide indicator is a tool that helps you insert support and resistance points at the chosen price and in the quantity you want, it depends on the agility of its configuration. This   FULL version   will work in   Meta Trader 5   on all accounts and   Strategy Tester . To test on the DEMO account , download the free version at: https://www.mql5.com/pt/market/product/111620 Operation The method
Time Line by MMD MT5
Mariusz Maciej Drozdowski
Time Line by MMD is a simple indicator that supports historical data analysis and trading on statistical models that follow the MMD methodology. Start Time - specifying the time when we start analyzing and playing the MMD statistical model Time Duration in minutes - duration of the model and its highest effectiveness (after the end of the line, the price returns - statistically - to the set level) Lookback days - the number of days back, subjected to historical analysis Base Time Frame - the b
My PVSR
Ashok Kumar Singha
My PVSR   is based on All Type of Pivot Points. Use this Indicator to get proper Support / Resistance Zone and Trade accordingly.. Recommendation: Use this Indicator along with my another Indicator --->>> Dr. Trend   <<<--- Click Here ; To get the best output result feel free to contact me ; Best of Luck It can be used for: All Pairs: Forex, Cryptocurrencies, Metals, Stocks, Indices etc. All Timeframe All Brokers All type of Trading Style like Scalping, Swing, Intraday, Short-Term, Long-
General Description In the simplest terms this is a contrarian intra-day scalping system. Built to try and let correct trades run as far as possible and flip the trade when indicated. The indicator looks at historical daily trading ranges to lay out levels at which it takes long and short positions based on the statistical levels. The indicator is built around index futures, mainly around S&P and the DOW but can be used an any futures contract mainly using AMP Futures to trade. The indicator is
My Point MT5
Claudia Ramona Angerer
Diagnosis of major and minor pivot Trend detection with many signals Can be used in all symbols Can be used in all time frames Settings: Back Show: The number of candles it displays If you need any adjustments, or have any questions or suggestions, message me How to trade: Blue: sell signal Red: buy signal Blue and red at the same time: no signal Exit signal: Opposite signal
ATR Bands Expansion Indicator
AL MOOSAWI ABDULLAH JAFFER BAQER
Unlock Precision with ATR Bands Expansion Indicator The ATR Bands Expansion Indicator is your gateway to identifying dynamic price movements and breakout opportunities in the financial markets. Designed to enhance your trading strategy, this tool uses Average True Range (ATR) principles to create adaptive bands that expand and contract based on market volatility. Key Highlights : Not Optimized: This indicator is designed for you to optimize according to your trading preferences and mark
Gap MT5
Dmitry Fedoseev
Gap indicator (pattern #23) from Encyclopedia of Chart Patterns by Thomas N. Bulkowski. Parameters: Alerts - show alert when an arrow appears   Push - send a push notification when an arrow appears (requires configuration in the terminal) GapSize - minimum gap size in points ArrowType - a symbol from 1 to 17 ArrowVShift - vertical shift of arrows in pixels   Auto5Digits - automatic multiplication of GapSize by 10 when working with 5 and 3 digit quotes. Note. Arrows appear at the opening of a ne
이 제품의 구매자들이 또한 구매함
Trend Screener Pro MT5
STE S.S.COMPANY
4.89 (72)
트렌드 표시기, 트렌드 트레이딩 및 필터링을 위한 획기적인 고유 솔루션, 하나의 도구 안에 내장된 모든 중요한 트렌드 기능! Forex, 상품, 암호 화폐, 지수 및 주식과 같은 모든 기호/도구에 사용할 수 있는 100% 다시 칠하지 않는 다중 시간 프레임 및 다중 통화 표시기입니다. Trend Screener는 차트에 점이 있는 화살표 추세 신호를 제공하는 효율적인 지표 추세 추종 지표입니다. 추세 분석기 표시기에서 사용할 수 있는 기능: 1. 트렌드 스캐너. 2. 최대 이익 분석이 있는 추세선. 3. 추세 통화 강도 측정기. 4. 경고가 있는 추세 반전 점. 5. 경고가 있는 강력한 추세 점. 6. 추세 화살표 Trend Screener Indicator가 있는 일일 분석 예, 일일 신호 성능...등은 여기에서 찾을 수 있습니다. 여기를 클릭하십시오. LIMITED TIME OFFER : Trend Screener Indicator는 50$ 및 평생 동안만 사용할 수 있습니다.
Golden Trend Indicator MT5
Noha Mohamed Fathy Younes Badr
4.86 (14)
Golden Trend indicator  is The best indicator for predicting trend movement this indicator never lags and never repaints and never back paints    and give  arrow buy and sell    before the candle appear  and it will help you and  will make your trading decisions clearer its work on all currencies and  gold and crypto and all time frame This unique  indicator uses very secret algorithms to catch the  trends, so you can trade using this indicator and see the trend clear on charts  manual guide and
FX Volume MT5
Daniel Stein
4.82 (17)
FX Volume: 브로커 시각에서 바라보는 진짜 시장 심리 간단 요약 트레이딩 접근 방식을 한층 더 향상시키고 싶으신가요? FX Volume 는 소매 트레이더와 브로커의 포지션을 실시간으로 파악할 수 있게 해 줍니다. 이는 COT 같은 지연된 보고서보다 훨씬 빠릅니다. 꾸준한 수익을 추구하는 분이든, 시장에서 더 깊은 우위를 원하시는 분이든, FX Volume 을 통해 대규모 불균형을 찾아내고, 돌파 여부를 확인하며 리스크 관리를 정교화할 수 있습니다. 지금 시작해 보세요! 실제 거래량 데이터가 의사결정을 어떻게 혁신할 수 있는지 직접 경험해 보시기 바랍니다. 1. 트레이더에게 FX Volume이 매우 유익한 이유 탁월한 정확도를 지닌 조기 경보 신호 • 다른 사람들보다 훨씬 앞서, 각 통화쌍을 매수·매도하는 트레이더 수를 거의 실시간으로 파악할 수 있습니다. • FX Volume 은 여러 리테일 브로커에서 추출한 실제 거래량 데이터를 종합해 명확하고 편리한 형태로 제공하는
FX Power MT5 NG
Daniel Stein
5 (10)
FX Power: 통화 강세 분석으로 더 스마트한 거래 결정을 개요 FX Power 는 어떤 시장 상황에서도 주요 통화와 금의 실제 강세를 이해하기 위한 필수 도구입니다. 강한 통화를 매수하고 약한 통화를 매도함으로써 FX Power 는 거래 결정을 단순화하고 높은 확률의 기회를 발견합니다. 트렌드를 따르거나 극단적인 델타 값을 사용해 반전을 예측하고자 한다면, 이 도구는 귀하의 거래 스타일에 완벽히 적응합니다. 단순히 거래하지 말고, FX Power 로 더 스마트하게 거래하세요. 1. FX Power가 거래자에게 매우 유용한 이유 통화와 금의 실시간 강세 분석 • FX Power 는 주요 통화와 금의 상대적 강세를 계산하고 표시하여 시장 역학에 대한 명확한 통찰력을 제공합니다. • 어떤 자산이 앞서고 있고 어떤 자산이 뒤처지는지 모니터링하여 보다 현명한 거래 결정을 내릴 수 있습니다. 포괄적인 멀티 타임프레임 뷰 • 단기, 중기 및 장기 타임프레임에서 통화와 금의 강세를
Quantum TrendPulse
Bogdan Ion Puscasu
5 (13)
SuperTrend   ,   RSI   ,   Stochastic   의 힘을 하나의 포괄적인 지표로 결합하여 트레이딩 잠재력을 극대화하는 궁극의 트레이딩 도구   인 Quantum TrendPulse를   소개합니다. 정밀성과 효율성을 추구하는 트레이더를 위해 설계된 이 지표는 시장 추세, 모멘텀 변화, 최적의 진입 및 종료 지점을 자신 있게 식별하는 데 도움이 됩니다. 주요 특징: SuperTrend 통합:   주요 시장 추세를 쉽게 따라가고 수익성의 물결을 타세요. RSI 정밀도:   매수 과다 및 매도 과다 수준을 감지하여 시장 반전 시점을 파악하는 데 적합하며 SuperTrend 필터로 사용 가능 확률적 정확도:   변동성이 큰 시장에서 숨겨진 기회를 찾기 위해 확률적 진동   을 활용하고 SuperTrend의 필터로 사용 다중 시간대 분석:   M5부터 H1 또는 H4까지 다양한 시간대에 걸쳐 시장을 최신 상태로 유지하세요. 맞춤형 알림:   맞춤형 거래 조건이 충족되면
IX Power MT5
Daniel Stein
4.83 (6)
IX Power: 지수, 원자재, 암호화폐 및 외환 시장 통찰력을 발견하세요 개요 IX Power 는 지수, 원자재, 암호화폐 및 외환 시장의 강도를 분석할 수 있는 다목적 도구입니다. FX Power 는 모든 가용 통화 쌍 데이터를 사용하여 외환 쌍에 대해 가장 높은 정확도를 제공하는 반면, IX Power 는 기초 자산 시장 데이터에만 초점을 맞춥니다. 이로 인해 IX Power 는 비외환 시장에 이상적이며, 다중 쌍 분석이 필요하지 않은 간단한 외환 분석에도 신뢰할 수 있는 도구입니다. 모든 차트에서 매끄럽게 작동하며, 거래 결정을 향상시키기 위한 명확하고 실행 가능한 통찰력을 제공합니다. 1. IX Power가 트레이더에게 유용한 이유 다양한 시장 강도 분석 • IX Power 는 지수, 원자재, 암호화폐 및 외환 심볼의 강도를 계산하여 각 시장에 맞는 통찰력을 제공합니다. • US30, WTI, 금, 비트코인 또는 통화 쌍과 같은 자산을 모니터링하여 거래 기회를 발견
FX Levels MT5
Daniel Stein
5 (2)
FX Levels: 모든 시장을 위한 뛰어난 정확도의 지지와 저항 간단 요약 통화쌍, 지수, 주식, 원자재 등 어떤 시장이든 믿을 만한 지지·저항 레벨을 찾고 싶나요? FX Levels 는 전통적인 “Lighthouse” 기법과 첨단 동적 접근을 결합해, 거의 보편적인 정확성을 제공합니다. 실제 브로커 경험을 반영하고, 자동화된 일별 업데이트와 실시간 업데이트를 결합함으로써 FX Levels 는 가격 반전 포인트를 파악하고, 수익 목표를 설정하며, 자신 있게 트레이드를 관리할 수 있게 돕습니다. 지금 바로 시도해 보세요—정교한 지지/저항 분석이 어떻게 여러분의 트레이딩을 한 단계 끌어올릴 수 있는지 직접 확인하세요! 1. FX Levels가 트레이더에게 매우 유용한 이유 뛰어난 정확도의 지지·저항 존 • FX Levels 는 다양한 브로커 환경에서도 거의 동일한 존을 생성하도록 설계되어, 데이터 피드나 시간 설정 차이로 인한 불일치를 해소합니다. • 즉, 어떤 브로커를 사용하
TPSpro RFI Levels MT5
Roman Podpora
4.53 (19)
지침         러시아   -        영어       표시기와 함께 사용하는 것이 좋습니다   .       -       TPSpro   트렌드 프로 -   MT4 버전         거래에서 핵심 요소는 거래 상품을 매수 또는 매도하기로 결정하는 구역 또는 수준입니다. 주요 업체가 시장에서 자신의 존재를 숨기려는 시도에도 불구하고, 그들은 필연적으로 흔적을 남깁니다. 우리의 과제는 이러한 흔적을 식별하고 올바르게 해석하는 방법을 배우는 것이었습니다. 주요 기능:: 판매자와 구매자를 위한 활성 영역을 표시합니다! 이 지표는 매수 및 매도를 위한 모든 올바른 초기 임펄스 레벨/존을 보여줍니다. 진입점 검색이 시작되는 이러한 레벨/존이 활성화되면 레벨의 색상이 바뀌고 특정 음영으로 채워집니다. 또한 상황을 보다 직관적으로 이해하기 위해 화살표가 나타납니다. 더 높은 시간대의 레벨/존 표시(MTF 모드) 더 높은 시간 간격을 사용하여 레벨/존을 표시하는 기능을 추가했습니다.
TPSproTREND PrO MT5
Roman Podpora
4.47 (17)
TPSpro TREND PRO  - is a trend indicator that automatically analyzes the market and provides information about the trend and each of its changes, as well as giving signals for entering trades without redrawing! The indicator uses each candle, analyzing them separately. referring to different impulses - up or down impulse. Exact entry points into transactions for currencies, crypto, metals, stocks, indices!  ИНСТРУКЦИЯ RUS         INSTRUCTIONS  ENG       R ecommended to use with an indicator   -
RelicusRoad Pro MT5
Relicus LLC
4.78 (18)
이제 $ 147 (몇 가지 업데이트 후 $ 499 증가) - 무제한 계정 (PCS 또는 MACS) RelicusRoad 사용 설명서 + 교육 비디오 + 비공개 Discord 그룹 액세스 + VIP 상태 시장을 보는 새로운 방법 RelicusRoad는 외환, 선물, 암호화폐, 주식 및 지수에 대한 세계에서 가장 강력한 거래 지표로서 거래자에게 수익성을 유지하는 데 필요한 모든 정보와 도구를 제공합니다. 우리는 초보자부터 고급까지 모든 거래자가 성공할 수 있도록 기술적 분석 및 거래 계획을 제공합니다. 미래 시장을 예측할 수 있는 충분한 정보를 제공하는 핵심 거래 지표입니다. 우리는 차트에서 말이 안 되는 여러 지표 대신 완전한 솔루션을 믿습니다. 타의 추종을 불허하는 매우 정확한 신호, 화살표 + 가격 조치 정보를 표시하는 올인원 표시기입니다. 강력한 AI를 기반으로 하는 RelicusRoad는 누락된 정보와 도구를 제공하여 교육하고 성공적인 트레이더인 트레이딩 전문가가 되도
Support And Resistance Screener는 하나의 지표 안에 여러 도구를 제공하는 MetaTrader에 대한 하나의 레벨 지표입니다. 사용 가능한 도구는 다음과 같습니다. 1. 시장 구조 스크리너. 2. 완고한 후퇴 영역. 3. 약세 후퇴 영역. 4. 일일 피벗 포인트 5. 주간 피벗 포인트 6. 월간 피벗 포인트 7. 고조파 패턴과 볼륨에 기반한 강력한 지지와 저항. 8. 은행 수준 구역. LIMITED TIME OFFER : HV 지원 및 저항 표시기는 50 $ 및 평생 동안만 사용할 수 있습니다. ( 원래 가격 125$ ) MQL5 블로그에 액세스하면 분석 예제와 함께 모든 프리미엄 지표를 찾을 수 있습니다. 여기를 클릭하십시오. 주요 특징들 고조파 및 볼륨 알고리즘을 기반으로 하는 강력한 지원 및 저항 영역. Harmonic 및 Volume 알고리즘을 기반으로 한 강세 및 약세 풀백 영역. 시장 구조 스크리너 일간, 주간 및 월간 피벗 포인트. 실제 거래의
Bill Williams Advanced
Siarhei Vashchylka
5 (9)
Bill Williams Advanced is designed for automatic chart analysis using Bill Williams' "Profitunity" system. The indicator analyzes four timeframes at once. Manual (Be sure to read before purchasing) Advantages 1. Automatically analyzes the chart using the "Profitunity" system of Bill Williams. The found signals are placed in a table in the corner of the screen. 2. Equipped with a trend filter based on the Alligator indicator. Most of the system signals are recommended to be used only according t
Basic Harmonic Patterns Dashboard MT5
Mehran Sepah Mansoor
4.57 (7)
이 대시보드는 선택한 심볼에 대해 사용 가능한 최신 고조파 패턴을 표시하므로 시간을 절약하고 더 효율적으로 사용할 수 있습니다 /   MT4 버전 . 무료 인디케이터:   Basic Harmonic Pattern 인디케이터 열 Symbol :   선택한 심볼이 나타납니다 Trend :   강세 또는 약세 Pattern :   패턴 유형(가틀리, 나비, 박쥐, 게, 상어, 사이퍼 또는 ABCD) Entry :   진입 가격 SL:   스톱로스 가격 TP1:   1차 테이크프로핏 가격 TP2:   2차 테이크프로핏 가격 TP3:   3차 테이크프로핏 가격 Current price:   현재 가격 Age (in bars):   마지막으로 그려진 패턴의 나이 주요 입력 Symbols :   "28개 주요 통화쌍" 또는 "선택한 심볼" 중에서 선택합니다. Selected Symbols :   쉼표로 구분하여 모니터링하려는 원하는 심볼("EURUSD,GBPUSD,XAUUSD")을 선택
우선적으로, 이 거래 도구는 전문적인 거래에 이상적인 비-다시 그리기 및 지연되지 않는 지표입니다.  온라인 강좌, 사용자 매뉴얼 및 데모. 스마트 가격 액션 컨셉트 인디케이터는 신규 및 경험 많은 트레이더 모두에게 매우 강력한 도구입니다. Inner Circle Trader Analysis 및 Smart Money Concepts Trading Strategies와 같은 고급 거래 아이디어를 결합하여 20가지 이상의 유용한 지표를 하나로 결합합니다. 이 인디케이터는 스마트 머니 컨셉트에 중점을 두어 대형 기관의 거래 방식을 제공하고 이동을 예측하는 데 도움을 줍니다.  특히 유동성 분석에 뛰어나 기관이 어떻게 거래하는지 이해하는 데 도움을 줍니다. 시장 트렌드를 예측하고 가격 변동을 신중하게 분석하는 데 탁월합니다. 귀하의 거래를 기관 전략에 맞추어 시장의 동향에 대해 더 정확한 예측을 할 수 있습니다. 이 인디케이터는 시장 구조를 분석하고 중요한 주문 블록을 식별하고 다양
Entry Points Pro for MT5
Yury Orlov
4.46 (129)
다시 색을 칠하지 않고 거래에 진입할 수 있는 정확한 신호를 제공하는 MT5용 지표입니다. 외환, 암호화폐, 금속, 주식, 지수 등 모든 금융 자산에 적용할 수 있습니다. 매우 정확한 추정값을 제공하고 매수와 매도의 가장 좋은 시점을 알려줍니다. 하나의 시그널로 수익을 내는 지표의 예와 함께 비디오 (6:22)시청하십시오! 대부분의 거래자는 Entry Points Pro 지표의 도움으로 첫 거래 주 동안 트레이딩 결과를 개선합니다. 저희의   Telegram Group 을 구독하세요! Entry Points Pro 지표의 좋은점. 재도색이 없는 진입 신호 신호가 나타나고 확인되면(시그널 캔들이 완성된 경우) 신호는 더 이상 사라지지 않습니다. 여타 보조지표의 경우 신호를 표시한 다음 제거되기 때문에 큰 재정적 손실로 이어집니다. 오류 없는 거래 게시 알고리즘을 통해 트레이드(진입 또는 청산)를 할 이상적인 순간을 찾을 수 있으며, 이를 통해 이를 사용하는 모든 거래자의 성공률이
FX Dynamic: 맞춤형 ATR 분석으로 변동성과 트렌드를 파악하세요 개요 FX Dynamic 는 Average True Range(ATR) 계산을 활용하여 트레이더에게 일간 및 일중 변동성에 대한 뛰어난 인사이트를 제공하는 강력한 도구입니다. 80%, 100%, 130%와 같은 명확한 변동성 임계값을 설정함으로써 시장이 평소 범위를 초과할 때 빠르게 경고를 받고, 유망한 수익 기회를 재빨리 식별할 수 있습니다. FX Dynamic 는 브로커의 시간대를 인식하거나 수동으로 조정할 수 있으며, 변동성 측정 기준을 일관되게 유지하며, MetaTrader 플랫폼과 완벽하게 연동되어 실시간 분석을 지원합니다. 1. FX Dynamic이 트레이더에게 매우 유용한 이유 실시간 ATR 인사이트 • 하루 및 일중 변동성을 한눈에 모니터링하세요. ATR의 80%, 100%, 130% 임계값이 도달 또는 초과되면, 시장의 중요한 지점에 있음을 알 수 있습니다. • 변동성이 완전히 폭발하기
Gold Stuff mt5
Vasiliy Strukov
4.92 (173)
Gold Stuff mt5는 금을 위해 특별히 설계된 추세 지표이며 모든 금융 상품에서도 사용할 수 있습니다. 표시기가 다시 그려지지 않고 지연되지 않습니다. 권장 기간 H1. 설정 및 개인 보너스를 받으려면 구매 후 즉시 저에게 연락하십시오!     강력한 지원 및 트렌드 스캐너 표시기의 무료 사본을 받으실 수 있습니다. 메시지를 보내주세요. 나!   설정 화살표 그리기 - 켜기 끄기. 차트에 화살표 그리기. 경고 - 가청 경고를 끕니다. 이메일 알림 - 켜기 끄기. 이메일 알림. Puch-notification - 켜기 끄기. 푸시 알림. 다음으로 색 영역을 조정합니다. Gold Stuff mt5는 금을 위해 특별히 설계된 추세 지표이며 모든 금융 상품에서도 사용할 수 있습니다. 표시기가 다시 그려지지 않고 지연되지 않습니다. 권장 기간 H1. 설정 및 개인 보너스를 받으려면 구매 후 즉시 저에게 연락하십시오!   설정 화살표 그리기 - 켜기 끄기. 차트에 화살표 그
소개       Quantum Breakout PRO   , 브레이크아웃 존 거래 방식을 변화시키는 획기적인 MQL5 지표! 13년 이상의 거래 경험을 가진 숙련된 트레이더 팀이 개발한       퀀텀 브레이크아웃 PRO       혁신적이고 역동적인 브레이크아웃 존 전략으로 거래 여정을 새로운 차원으로 끌어올리도록 설계되었습니다. Quantum Breakout Indicator는 5개의 이익 목표 영역이 있는 브레이크아웃 영역의 신호 화살표와 브레이크아웃 상자를 기반으로 한 손절 제안을 제공합니다. 초보자 거래자와 전문 거래자 모두에게 적합합니다. Quantum EA 채널:       여기를 클릭하세요 중요한! 구매 후 설치 매뉴얼을 받으려면 개인 메시지를 보내주십시오. 추천: 기간: M15 통화쌍: GBPJPY, EURJPY, USDJPY,NZDUSD, XAUUSD 계정 유형: 스프레드가 매우 낮은 ECN, Raw 또는 Razor 브로커 시간: GMT +3 중개인 :
Matrix Arrow Indicator MT5
Juvenille Emperor Limited
5 (13)
매트릭스 화살표 표시기 MT5 는 외환, 상품, 암호 화폐, 지수, 주식과 같은 모든 기호/도구에 사용할 수 있는 100% 다시 칠하지 않는 다중 기간 표시기를 따르는 고유한 10 in 1 추세입니다.  Matrix Arrow Indicator MT5 는 다음과 같은 최대 10개의 표준 지표에서 정보와 데이터를 수집하여 초기 단계에서 현재 추세를 결정합니다. 평균 방향 이동 지수(ADX) 상품 채널 지수(CCI) 클래식 하이켄 아시 캔들 이동 평균 이동 평균 수렴 발산(MACD) 상대 활력 지수(RVI) 상대 강도 지수(RSI) 포물선 SAR 스토캐스틱 오실레이터 윌리엄스의 백분율 범위 모든 지표가 유효한 매수 또는 매도 신호를 제공하면 강력한 상승/하락 추세를 나타내는 다음 캔들/막대가 시작될 때 해당 화살표가 차트에 인쇄됩니다. 사용자는 사용할 표시기를 선택하고 각 표시기의 매개변수를 개별적으로 조정할 수 있습니다. 매트릭스 화살표 표시기 MT5는 선택한 표시기에서만 정보를 수
Easy Breakout MT5
Mohamed Hassan
5 (3)
After your purchase, feel free to contact me for more details on how to receive a bonus indicator called VFI, which pairs perfectly with Easy Breakout for enhanced confluence!     Easy Breakout MT5   is a powerful price action trading system built on one of the most popular and widely trusted strategies among traders: the   Breakout strategy ! This indicator delivers crystal-clear Buy and Sell signals based on breakouts from key support and resistance zones. Unlike typical breakout indicators
Gartley Hunter Multi
Siarhei Vashchylka
5 (9)
Gartley Hunter Multi - An indicator for searching for harmonic patterns simultaneously on dozens of trading instruments and on all possible timeframes. Manual (Be sure to read before purchasing) | Version for MT4 Advantages 1. Patterns: Gartley, Butterfly, Shark, Crab. Bat, Alternate Bat, Deep Crab, Cypher 2. Simultaneous search for patterns on dozens of trading instruments and on all possible timeframes 3. Search for patterns of all possible sizes. From the smallest to the largest 4. All fou
Royal Scalping Indicator M5
Vahidreza Heidar Gholami
5 (6)
Royal Scalping Indicator is an advanced price adaptive indicator designed to generate high-quality trading signals. Built-in multi-timeframe and multi-currency capabilities make it even more powerful to have configurations based on different symbols and timeframes. This indicator is perfect for scalp trades as well as swing trades. Royal Scalping is not just an indicator, but a trading strategy itself. Features Price Adaptive Trend Detector Algorithm Multi-Timeframe and Multi-Currency Trend Low
Trade smarter, not harder: Empower your trading with Harmonacci Patterns Special Offer: Purchase now to receive free bonuses worth $165! (Read more for details) This is arguably the most complete harmonic price formation auto-recognition indicator you can find for the MetaTrader Platform. It detects 19 different patterns, takes fibonacci projections as seriously as you do, displays the Potential Reversal Zone (PRZ) and finds suitable stop-loss and take-profit levels. [ Installation Guide | Upd
Basic Supply Demand Dashboard MT5
Mehran Sepah Mansoor
5 (1)
이 대시보드는 선택한 기호에 대한 거래 전략에 따라 스캘핑 모드와 장기 모드 모두에서 차트의 공급 및 수요 영역을 검색하고 표시합니다. 또한 대시보드의 스캐너 모드를 통해 원하는 모든 기호를 한눈에 확인하고 적합한 위치를 놓치지 않도록 도와줍니다 / MT4 버전 . 무료 보조지표:   Basic Supply Demand 특징 여러 통화쌍에 대한 거래 기회를 볼 수 있으며, 공급 및 수요 영역에 대한 근접성에 따라 순위가 매겨진 모든 쌍을 명확하고 간결하게 볼 수 있습니다. 색상부터 감지 매개변수까지 특정 요구에 맞게 사용자 지정 설정 가능 주요 입력 Indicator mode :   표시기 모드 또는 새로운 기능이 포함된 패널 모드 중에서 선택 가능 Symbols :   "28개 주요 통화쌍" 또는 "선택한 심볼" 중에서 선택 Selected Symbols :   쉼표로 구분하여 모니터링하려는 원하는 심볼("EURUSD, GBPUSD, XAUUSD")을 선택합니다. 브로
QM Pattern Scanner MT5
Reza Aghajanpour
5 (4)
Contact me  to send you instruction and add you in group. QM (Quasimodo) Pattern is based on Read The Market(RTM) concepts. The purpose of this model is to face the big players of the market (financial institutions and banks), As you know in financial markets, big traders try to fool small traders, but RTM prevent traders from getting trapped. This style is formed in terms of price candles and presented according to market supply and demand areas and no price oscillator is used in it. RTM conc
Auto Order Block with break of structure based on ICT and Smart Money Concepts (SMC) Futures Break of Structure ( BoS )             Order block ( OB )            Higher time frame Order block / Point of Interest ( POI )    shown on current chart           Fair value Gap ( FVG ) / Imbalance   -  MTF      ( Multi Time Frame )    HH/LL/HL/LH  -  MTF      ( Multi Time Frame )  Choch  MTF      ( Multi Time Frame )  Volume Imbalance     ,  MTF          vIMB Gap’s Power of 3 Equal High / Low’s  
Volumatic VIDyA MT5
Duc Hoan Nguyen
5 (1)
Special offer : ALL TOOLS , just $35 each! New tools   will be   $30   for the   first week   or the   first 3 purchases !  Trading Tools Channel on MQL5 : Join my MQL5 channel to update the latest news from me Volumatic VIDYA (Variable Index Dynamic Average) 는 트렌드를 추적하고 각 트렌드 단계에서 매수 및 매도 압력을 분석하기 위해 설계된 고급 지표입니다. 가변 지수 동적 평균(Variable Index Dynamic Average)을 핵심 동적 평활화 기술로 활용하여 이 도구는 주요 시장 구조 수준에서 가격 및 거래량 역학에 대한 중요한 통찰력을 제공합니다. MT4 버전 보기:  Volumatic VIDyA MT4 다른 제품 보기:    모든 제품 To use iCustom
Dark Absolute Trend   is an Indicator for intraday trading. This Indicator is based on   Trend Following  strategy but use also candlestick patterns and Volatility. We can enter in good price with this Indicator, in order to follow the main trend on the current instrument. It is advised to use low spread ECN brokers. This Indicator does   Not repaint   and   N ot lag . Recommended timeframes are M5, M15 and H1. Recommended working pairs: All. I nstallation and  Update Guide   -  Troubleshooting
CONTACT US  after purchase to get the Indicator Manual. Try Now—Limited 50% Discount for First 10 Buyers! Download the  Metatrader 4 Version Due to regulatory restrictions, our service is unavailable in certain countries such as India, Pakistan, and Bangladesh. William Delbert Gann (W.D. Gann) was an exceptional market analyst, whose trading technique was based on a complex blend of mathematics, geometry, astrology, and ancient mathematics which proved to be extremely accurate. A Note from t
Suleiman Levels
Suleiman Alhawamdah
5 (2)
중요 사항: 스크린샷에 표시된 이미지는 제가 사용하는 2가지 지표인 "술레이만 레벨(Suleiman Levels)" 지표와 "RSI 트렌드 V(RSI Trend V)" 지표입니다. "RSI Trend V1" 지표와 함께 사용하는 것을 권장했습니다. 특히 색상 구름을 확인하고 일치시키며 화살표 신호를 위해, 그리고 피보나치 지표와 그에 첨부된 우수한 수준의 중요성을 고려하여 사용하는 것이 좋습니다 : https://www.mql5.com/en/market/product/132080 "술레이만 레벨(Suleiman Levels)" 지표는 고급 올인원 전문 분석 도구입니다. 약 9,800줄의 코드로 구성된 이 지표는 혁신, 정확성, 단순성을 결합하여 차트를 이전보다 더 명확하게 만들어줍니다. 이는 단순한 지표가 아닙니다. "술레이만 레벨(Suleiman Levels)"을 차별화하는 강력한 기능: 노란색 상자(자금 흐름 감지): 특정 캔들에서 은행 및 기관의 자금 유입을 감지합니다. 이
제작자의 제품 더 보기
SORS Osw
William Oswaldo Mayorga Urduy
THE SORS COMPLEXES This indicator is designed to draw the SORS lines on the graph, these are the modern way of calculating market points that it usually respects, they are comprised of supports and resistance, but unlike the classics, these are calculated from volatility endogenous and standard deviation, In the configuration you can change the color of each level linear and hide the ones that are not needed. A = Annual. M = Monthly. W = Weekly D = Daily.
Harmonic Patterns Osw MT5
William Oswaldo Mayorga Urduy
고조파 패턴 OSW MT5 이 표시기는 고조파 패턴을 감지하여 작업할 수 있도록 신호를 제공하여 주문을 받는지 여부에 따라 수동 분석을 추가할 수 있도록 합니다. 표시기가 감지하는 고조파 패턴은 다음과 같습니다. >가틀리 >박쥐 >나비 >게 >상어 찾을 수 있는 기능은 다음과 같습니다. > 메일, 모바일 및 PC에 대한 경고 생성 > 구매 및 판매 모두에서 고조파의 색상을 변경합니다. > "허용된 각도"를 결정합니다. 즉, 고조파가 38.2에 도달해야 하고 "허용된 각도"가 5인 경우 가격이 정확히 38.2에 닿지 않기 때문에 가격이 33.2와 43.2 사이가 되도록 허용합니다. > 1000개의 구성 가능한 양초 후에 고조파를 삭제하여 이전 그래픽 개체로 그래프를 로드하지 않도록 합니다. >지표가 움직임을 읽는 방법을 알기 위해 분석 중인 선 또는 충동 및 좌절을 표시합니다. >지그재그 구성으로 가격 변동을 측정하고 하모닉 패턴을 검색할 수 있습니다.
RSI Alarm Osw MT4
William Oswaldo Mayorga Urduy
RSI ALARM (For Metatrader 4) This indicator works like a normal RSI with all its settings (Periodicity, colors, levels, etc), but additionally, alarms can be set in the upper and lower level (Example 70 and 30), with the possibility of adjusting these levels by moving the upper and lower lines found on the indicator. You can also activate and deactivate an additional function that puts an arrow on the chart when the expected upper or lower RSI is met.
SORS Osw MT4
William Oswaldo Mayorga Urduy
THE SORS COMPLEXES (For Metatrader 4) This indicator is designed to draw the SORS lines on the graph, these are the modern way of calculating market points that it usually respects, they are comprised of supports and resistance, but unlike the classics, these are calculated from volatility endogenous and standard deviation, In the configuration you can change the color of each level linear and hide the ones that are not needed. A = Annual. M = Monthly. W = Weekly D = Daily.
Divergence Osw Metatrader 4
William Oswaldo Mayorga Urduy
DIVERGENCE OSW  (For Metatrader 4) This indicator works on divergences and has the following functions: Generate an alert when a divergence occurs. Create lines by calculating the Stoploss and Takeprofit according to projection waves of inverse waves. Create an arrow indicating the possible direction of the market. The signals sent by the indicator are given when the candle ends. The Trader must evaluate each divergence to take entries. Settings: Activation and deactivation of alerts. Alert inte
Trading Sesions MT4
William Oswaldo Mayorga Urduy
COMMERCIAL SESSIONS This indicator shows in the selected graph divided by tables each of the sessions ASIA, JAPAN, LONDON, NEW YORK: Allows you to configure: Session Color  ASIA, JAPON, LONDRES, NEW YORK Hide and show each session It works in the lowest timeframes on the market, among which H4, H1, M15, M5 and M1 are recommended. (Don't forget to check out our other indicators)
Automatic Support and Resistance Osw MT4 This Indicator graphs lines at the possible support and resistance points of the selected asset. it works in multiple temporalities. allows you to configure: Color of the lines. Width of the lines. Type of lines. When the indicator begins its operation, it analyzes the supports and resistances of higher levels for the temporality in which it is working.
Round Numbers Osw MT4
William Oswaldo Mayorga Urduy
ROUND NUMBERS (For Metatrader 4) This indicator allows you to add horizontal lines according to the round numbers that the asset contains. Unlike other indicators, this one calculates the closest levels dynamically and automatically as the price moves. works on currency pairs, indices, metals, stocks, etc. Round with 5 digits, 3 digits and integers of 10 100 or 1000. lines can be adjusted in parameters like: Hide the line or round number that you do not want to display. line color. line
SUPPORT LINES AND RESISTORS + COMMAND BLOCKS for METATRADER 4 A much more pleasant visual way to locate supports and resistance, unlike normal horizontal lines, these can be located from a specific point, without extending backwards, making the graph not look good, it also shows the name of the temporality in which it was created so that when you are operating, you can know to which temporality it belongs. You can also create order blocks in a comfortable and visual way, where you can also se
Whatch and Candle Alarm Osw MT4
William Oswaldo Mayorga Urduy
Osw Watch for METATRADER 4 This is an indicator that shows the remaining time for the current candle to expire on a watch, this is always located next to the last candle following the price, the numbers are shown the same as in the images, and can be modified both in size and color. between your settings you can set: the size of the numbers showing the time. the color of the numbers showing the time. Also within the configuration you can activate and deactivate so that an alarm sounds each
Alert Up Down MT4
William Oswaldo Mayorga Urduy
METATRADER 5에 대한 경고 위아래 이 표시기는 가격이 UP과 DOWN 라인 사이의 영역을 벗어날 때 경고를 생성합니다. 다음과 같은 다양한 유형의 경고를 생성할 수 있습니다. > 사운드 > 메시지 상자 > 전문가 상자의 메시지 > 메일(이전 구성) > PUSH 알림(이전 구성) 선은 선 속성이 아니라 표시기 속성에서 구성해야 합니다. 선 속성에서 구성하면 피노나치가 영향을 받을 수 있기 때문입니다. 설정 중 색상, 선 스타일 및 너비를 변경할 수 있습니다. 선은 선 속성이 아니라 표시기 속성에서 구성해야 합니다. 선 속성에서 구성하면 피노나치가 영향을 받을 수 있기 때문입니다. 설정 중 색상, 선 스타일 및 너비를 변경할 수 있습니다. 선은 선 속성이 아니라 표시기 속성에서 구성해야 합니다. 선 속성에서 구성하면 피노나치가 영향을 받을 수 있기 때문입니다. 설정 중 색상, 선 스타일 및 너비를 변경할 수 있습니다.
Break Out Signal Osw
William Oswaldo Mayorga Urduy
탈주 신호 OSW (메타트레이더 4) 최고점과 최저점을 깨고 일하고 싶습니까? 이는 이러한 유형의 항목에서 신호를 받는 데 완벽한 지표입니다. 지표가 시작되자마자 어떤 신호도 표시하지 않지만 가격이 상승함에 따라 완벽한 패턴을 찾을 때까지 시장을 읽을 것입니다. 최고점과 최저점을 읽는 지표는 지그재그를 위한 특별한 구성을 가지고 있어 가장 적합한 것만 취할 수 있습니다. 다른 지표와 마찬가지로 완벽한 항목을 제공하지는 않지만 결과적으로 제공하는 많은 항목이 승자이며 우수한 기술적 분석과 함께 매우 좋은 결과를 제공합니다. 강세 항목은 파란색으로 표시되고 약세 항목은 빨간색으로 표시되며, 각 항목에는 제안된 손절매 및 이익실현이 있으며 버퍼는 읽을 수 있도록 완벽하게 설정되어 있고 신호 알림을 켜고 끌 수 있습니다.
Automatic OrderBlocks Osw MT4
William Oswaldo Mayorga Urduy
자동 주문 블록 OSW (메타트레이더 5) 이 표시기는 다음과 같은 사전 설정된 규칙에 따라 주문 블록을 표시하는 역할을 합니다. >이전의 충동을 깨뜨리는 충동이 있다는 것. > 발견되면 형성된 촛대 패턴을 찾아 가장 효율적인 방법으로 장소의 고저를 계산하고 Order Block의 고저를 생성하는 역할을 합니다. > 오더 블록이 생성된 후 인디케이터는 캔들이 오더 블록의 위아래 라인을 교차하는지 지속적으로 확인하여 가능한 신호가 있음을 나타내는 경고 신호를 생성합니다. >지표가 제공하는 신호는 다른 전략과 같이 100% 효과적이지 않으므로 수동 기술 분석을 동반하는 것이 좋습니다. > PC, 모바일 및 이메일의 세 가지 유형의 알림이 생성됩니다. 자동 주문 블록 OSW (메타트레이더 5) 이 표시기는 다음과 같은 사전 설정된 규칙에 따라 주문 블록을 표시하는 역할을 합니다. >이전의 충동을 깨뜨리는 충동이 있다는 것. > 발견되면 형성된 촛대 패턴을 찾아 가장
RSI Alarm Osw
William Oswaldo Mayorga Urduy
RSI ALARM (For Metatrader 5) This indicator works like a normal RSI with all its settings (Periodicity, colors, levels, etc), but additionally, alarms can be set at the upper and lower level (Example 70 and 30), with the possibility of adjusting these levels by moving the blue and red lines to establish the upper and lower levels. You can also turn on and off an additional function that creates an arrow on the chart when the expected upper or lower RSI is met.
Automatic Support and Resistance Osw MT5 This Indicator graphs lines at the possible support and resistance points of the selected asset. it works in multiple temporalities. allows you to configure: Color of the lines. Width of the lines. Type of lines. When the indicator begins its operation, it analyzes the supports and resistances of higher levels for the temporality in which it is working.
Round Number Osw MT5
William Oswaldo Mayorga Urduy
ROUND NUMBERS (For Metatrader 5) This indicator allows you to add horizontal lines according to the round numbers that the asset contains. Unlike other indicators, this one calculates the closest levels dynamically and automatically as the price moves. works on currency pairs, indices, metals, stocks, etc. Round with 5 digits, 3 digits and integers of 10 100 or 1000. lines can be adjusted in parameters like: Hide the line or round number that you do not want to display. line color. line
SUPPORT LINES AND RESISTORS + COMMAND BLOCKS for METATRADER 5 A much more pleasant visual way to locate supports and resistance, unlike normal horizontal lines, these can be located from a specific point, without extending backwards, making the graph not look good, it also shows the name of the temporality in which it was created so that when you are operating, you can know to which temporality it belongs. You can also create order blocks in a comfortable and visual way, where you can also se
Whatch and Candle Alarm Osw MT5
William Oswaldo Mayorga Urduy
Osw Watch for METATRADER 5 This is an indicator that shows the remaining time for the current candle to expire on a watch, this is always located next to the last candle following the price, the numbers are shown the same as in the images, and can be modified both in size and color. between your settings you can set: the size of the numbers showing the time. the color of the numbers showing the time. Also within the configuration you can activate and deactivate so that an alarm sounds each
Alert Up Down MT5
William Oswaldo Mayorga Urduy
METATRADER 5에 대한 경고 위아래 이 표시기는 가격이 UP과 DOWN 라인 사이의 영역을 벗어날 때 경고를 생성합니다. 다음과 같은 다양한 유형의 경고를 생성할 수 있습니다. > 사운드 > 메시지 상자 > 전문가 상자의 메시지 > 메일(이전 구성) > PUSH 알림(이전 구성) 선은 선 속성이 아니라 표시기 속성에서 구성해야 합니다. 선 속성에서 구성하면 피노나치가 영향을 받을 수 있기 때문입니다. 설정 중 색상, 선 스타일 및 너비를 변경할 수 있습니다. 선은 선 속성이 아니라 표시기 속성에서 구성해야 합니다. 선 속성에서 구성하면 피노나치가 영향을 받을 수 있기 때문입니다. 설정 중 색상, 선 스타일 및 너비를 변경할 수 있습니다. 선은 선 속성이 아니라 표시기 속성에서 구성해야 합니다. 선 속성에서 구성하면 피노나치가 영향을 받을 수 있기 때문입니다. 설정 중 색상, 선 스타일 및 너비를 변경할 수 있습니다.
Master Calendar Osw
William Oswaldo Mayorga Urduy
OSW 마스터 캘린더 이 지표는 처음에는 개인적인 용도로 만들어졌지만 조금씩 개선해 나가고 있으며 일상적인 거래에 도움이 되는 기능을 구현하고 있으며 유용하다면 계속해서 기능을 구현할 예정입니다. 달력 세부정보. > 날짜, 국가, 통화, 뉴스 분야, 뉴스 이름, 이전, 예측 및 현재 데이터와 같은 데이터가 포함된 현재 날짜에 가까운 뉴스의 모바일 및 상세 캘린더입니다. >캘린더는 5분마다 자동으로 업데이트됩니다. > 메뉴에서 색상, 거래 세션 및 시작 시간을 구성하여 중요도에 따라 보고 싶은 뉴스를 선택할 수 있습니다. 색상 변경 >캘린더에는 색상을 변경하는 내부 기능이 있습니다. 현재 값이 이전 값보다 크면 파란색으로 변하고, 그렇지 않으면 빨간색으로 변하고, 중립은 회색으로 변합니다. >뉴스의 색상과 중요도에 따라 뉴스 설명 텍스트의 색상을 메뉴에서 구성할 수 있습니다. > 뉴스로 인해 통화가 강화되면 통화 이름과 국가가 파란색으로 설정되고, 그렇지 않으면 빨간색
Volumes Direction MT5
William Oswaldo Mayorga Urduy
볼륨 방향 MT5 일반적으로 현재 볼륨이 이전 볼륨보다 높을 때 볼륨 표시기의 기본 색상 변경이 있습니다. 중요하지만 그다지 유용하지는 않습니다. 이러한 이유로 이 지표는 정상적인 볼륨 외에도 양초가 강세 또는 약세일 때 다른 색상으로 칠하도록 만들어졌습니다. 기본적으로 강세는 파란색이고 약세는 빨간색이지만 이러한 색상은 사용자 정의할 수 있습니다. 상인의 취향. 귀하의 거래를 개선하는 데 도움이 될 다른 지표를 확인하는 것을 잊지 마십시오. 볼륨 방향 MT5 일반적으로 현재 볼륨이 이전 볼륨보다 높을 때 볼륨 표시기의 기본 색상 변경이 있습니다. 중요하지만 그다지 유용하지는 않습니다. 이러한 이유로 이 지표는 정상적인 볼륨 외에도 양초가 강세 또는 약세일 때 다른 색상으로 칠하도록 만들어졌습니다. 기본적으로 강세는 파란색이고 약세는 빨간색이지만 이러한 색상은 사용자 정의할 수 있습니다. 상인의 취향. 귀하의 거래를 개선하는 데 도움이 될 다른 지표를 확인하는 것
Trade Panel Osw MT5
William Oswaldo Mayorga Urduy
무역 패널 OSW METATRADE 5 이 패널은 시장 주문을 하는 데 도움이 되며 계정에 설정된 통화에 따라 각 작업의 비용을 볼 수 있습니다. 기능 설명서: 1) 버튼을 사용하거나 서면으로 STOPLOSS를 선택합니다(옵션을 활성화하거나 비활성화하여 넣을 수 있습니다). 2) 버튼으로 TAKEPROFIT를 선택하거나 서면으로 (옵션을 활성화하거나 비활성화하여 넣을 수 있습니다). 3) 또는 버튼으로 VOLUME을 선택합니다. 4) "시장별"을 선택하면 시장별로 주문이 실행됩니다. 5) 주문이 프로그래밍될 경우 "프로그램"을 선택합니다. 6) "프로그램" 옵션이 활성화된 경우 가격 레이블이 생성되어 작업을 프로그래밍할 가격을 선택할 수 있습니다(레이블의 위치에 따라 버튼이 LIMIT와 STOP 사이에서 변경됩니다. . 7) 셀렉터에 주문이 SELL인지 BUY인지 입력해야 하며, 마켓에 의해 실행되는지 또는 예정된 시간에 실행되는지 여부에 따라 버튼이 자동으로 변경
GAPS Indicator MT5
William Oswaldo Mayorga Urduy
GAPS 지표 메타 트레이더 5 지수, 주식 및 기타 자산에 사용되는 일부 전략의 경우 일반적으로 각 캔들스틱의 GAP를 측정하지만 수동으로 수행하려는 경우 계산 오류가 발생할 수 있습니다. 이러한 이유로 각 양초 사이에 표시되는 각 GAPS의 PIPS 값을 자동으로 표시하고 옵션이 활성화된 경우 촛불이 나타날 때 알람을 생성하는 "GAP 표시기"가 생성되었습니다. GAPS 지표 메타 트레이더 5 지수, 주식 및 기타 자산에 사용되는 일부 전략의 경우 일반적으로 각 캔들스틱의 GAP를 측정하지만 수동으로 수행하려는 경우 계산 오류가 발생할 수 있습니다. 이러한 이유로 각 양초 사이에 표시되는 각 GAPS의 PIPS 값을 자동으로 표시하고 옵션이 활성화된 경우 촛불이 나타날 때 알람을 생성하는 "GAP 표시기"가 생성되었습니다.
Signal Indicator to Expert MT5
William Oswaldo Mayorga Urduy
신호를 제공하는 표시기가 있고 이를 Expert로 변환하고 싶습니까? 이 전문가를 사용하면 지표를 다시 프로그래밍하거나 조정하지 않고도 지표를 변환할 수 있습니다. 다음 단계에 따라 올바르게 구성하기만 하면 됩니다. 1) 지표는 지표 폴더에 있어야 합니다. 2) 지표에서 제공하는 BUY 및 SELL 버퍼를 신중하게 선택해야 합니다. 3) 모든 작업을 수행할지 아니면 BUY 또는 SELL 유형의 작업만 수행할지 선택합니다. 4) 작업에 따라 SL 및 TP 또는 만료 시간으로 작업을 마감할 방법을 선택합니다. 5) 선택 항목에 따라 시간 필드 또는 SL 및 TP 필드를 채웁니다. 6) 필요한 경우에만 Volume, Comments, Magic 및 Deviation 필드를 작성하십시오. 7) 지표가 제공하는 입력을 관리하려는 경우에만 최대 이익과 최대 손실을 설정할 수 있으며 EARNING MANAGER 필드를 활성화하고 채울 수 있습니다. 8) Trailing Stop
Local Copy Trading Osw
William Oswaldo Mayorga Urduy
로컬 카피 트레이딩 OSW 이것은 한 계정에서 다른 계정으로 거래를 복사하려는 경우 훌륭한 도구입니다. 전문가를 구성하려면 다음 단계를 따라야 합니다. 1) SLAVE 단말기에서 자동매매가 활성화되어 있는지 확인합니다. 2) EA가 SLAVE 터미널에서 거래 권한을 가지고 있는지 확인하십시오. 3) MASTER 차트에 전문가를 추가하고 MASTER로 구성합니다. 4) SLAVE 그래프에 Expert를 추가하고 SLAVE(1,2,3,4,5)로 구성 5) SLAVE에서 개인화된 볼륨을 원하는 경우 볼륨 유형을 FIXED, AS THE MASTER'S, FOR EACH 1000 OF BALANCE, MULTIPLIER 또는 AS THE RISK OF THE MASTER 중에서 선택해야 합니다. 이 마지막 것은 1000 usd의 MASTER 계정이 0.01을 보내고 SLAVE 1 계정이 10000 usd로 받으면 0.10으로 열립니다. 6) 자산에 접두사 또는 접미사가 있
Microlots Deriv
William Oswaldo Mayorga Urduy
파생 마이크로 이 패널은 브로커가 최소 볼륨 미만의 볼륨 단계를 제공하는 조건에서만 브로커가 배치를 허용하지 않을 때 마이크로 로트를 입력할 수 있는 기존 패널을 대체합니다. 예를 들어: 최소 거래량이 0.20이고 단계가 0.01이고 0.02를 입력하려는 경우 일반적으로 할 수 없지만 이 도구는 미결 주문이 현재 상태로 유지되도록 주문 전송을 관리합니다. 0.02의 값. 이 도구를 보완하기 위한 제안을 환영합니다. 파생 마이크로 이 패널은 브로커가 최소 볼륨 미만의 볼륨 단계를 제공하는 조건에서만 브로커가 배치를 허용하지 않을 때 마이크로 로트를 입력할 수 있는 기존 패널을 대체합니다. 예를 들어: 최소 거래량이 0.20이고 단계가 0.01이고 0.02를 입력하려는 경우 일반적으로 할 수 없지만 이 도구는 미결 주문이 현재 상태로 유지되도록 주문 전송을 관리합니다. 0.02의 값. 이 도구를 보완하기 위한 제안을 환영합니다.
Heat Map OSW
William Oswaldo Mayorga Urduy
헤드맵 OSW 이 표시기는 모든 통화 조합의 현재 상태를 파악하고 그 변동을 파악하는 데 이상적입니다. 변동은 현재 가격에서 24시간 전 또는 메뉴에 구성된 모든 가격의 백분율 이동으로 계산됩니다. 통화의 변동을 알기 위해서는 기본 통화를 살펴보기만 하면 됩니다. 예를 들면 다음과 같습니다. EUR에서는 다른 통화와 비교하기 위해 수직으로 살펴봐야 하며 결국 이러한 모든 변동 값의 평균을 찾습니다. 브로커가 기호 또는 통화 쌍(예: EURUSD.pro)에 둘 때 접두사와 접미사가 사용됩니다. 접미사는 .pro가 됩니다. 헤드맵 OSW 이 표시기는 모든 통화 조합의 현재 상태를 파악하고 그 변동을 파악하는 데 이상적입니다. 변동은 현재 가격에서 24시간 전 또는 메뉴에 구성된 모든 가격의 백분율 이동으로 계산됩니다. 통화의 변동을 알기 위해서는 기본 통화를 살펴보기만 하면 됩니다. 예를 들면 다음과 같습니다. EUR에서는 다른 통화와 비교하기 위해 수직으로 살펴봐야
ESS Enguifing Strategy Signals
William Oswaldo Mayorga Urduy
ESS 엔지니어링 상태 신호 이 표시기는 필터가 적용된 봉투형 양초를 감지하며, 이 필터는 3가지 전략으로 함께 구성되어 측정 가능한 매개변수 내에서 가능한 최대의 효과를 식별할 수 있습니다. 신호는 각 방향에 대해 위쪽 및 아래쪽 화살표로 표시되며 모바일로 알림, 이메일 및 푸시 메시지를 활성화하거나 비활성화할 수도 있습니다. 100% 효과적인 지표는 없다는 점을 언급할 가치가 있습니다. 따라서 기술 분석이나 다른 지표의 도움을 받아 자신의 전략의 효율성을 향상시켜야 합니다. ESS 엔지니어링 상태 신호 이 표시기는 필터가 적용된 봉투형 양초를 감지하며, 이 필터는 3가지 전략으로 함께 구성되어 측정 가능한 매개변수 내에서 가능한 최대의 효과를 식별할 수 있습니다. 신호는 각 방향에 대해 위쪽 및 아래쪽 화살표로 표시되며 모바일로 알림, 이메일 및 푸시 메시지를 활성화하거나 비활성화할 수도 있습니다. 100% 효과적인 지표는 없다는 점을 언급할 가치가 있습니다. 따라서
MultiTimeFrame Moving Average Osw
William Oswaldo Mayorga Urduy
다중 시간 프레임 이동 평균 OSW (메타트레이더 5) 이 표시기를 사용하면 모든 유형의 구성에 대한 이동 평균을 추가할 수 있습니다. 단, 시간 프레임에 있는 경우 더 높은 수준에서 추가할 수 있다는 차이점이 있습니다(예: 5분 시간 프레임에 있는 경우). 15분, 1시간, 4시간의 시간성 20의 이동 평균 지수를 보고 싶다면 지표 메뉴에서 올바른 매개변수를 구성해야만 지표 이미지에 표시된 대로 볼 수 있습니다. 다중 시간 프레임 이동 평균 OSW (메타트레이더 5) 이 표시기를 사용하면 모든 유형의 구성에 대한 이동 평균을 추가할 수 있습니다. 단, 시간 프레임에 있는 경우 더 높은 수준에서 추가할 수 있다는 차이점이 있습니다(예: 5분 시간 프레임에 있는 경우). 15분, 1시간, 4시간의 시간성 20의 이동 평균 지수를 보고 싶다면 지표 메뉴에서 올바른 매개변수를 구성해야만 지표 이미지에 표시된 대로 볼 수 있습니다.
Points Candles Osw
William Oswaldo Mayorga Urduy
포인트 캔들 OSW (메타트레이더 5) 이 지표를 사용하면 차트에서 처리되고 있는 각 양초의 크기를 포인트 단위로 알 수 있으며 각 양초의 크기와 방향에 대한 정보를 제공합니다. 지표는 강세일 경우 위를 가리키고 약세일 경우 아래를 가리킵니다. . 또한 모든 양초를 숨기거나 표시할 수도 있습니다. 강세만 또는 약세만 표시할 수 있습니다. 이는 Deriv와 같이 한 방향으로 더 강한 양초를 제공하는 자산을 관리하는 중개인을 위한 것입니다. 브로커가 정상인 경우 이렇게 해서는 안됩니다. 개발할 전략이 없다면? 포인트 캔들 OSW (메타트레이더 5) 이 지표를 사용하면 차트에서 처리되고 있는 각 양초의 크기를 포인트 단위로 알 수 있으며 각 양초의 크기와 방향에 대한 정보를 제공합니다. 지표는 강세일 경우 위를 가리키고 약세일 경우 아래를 가리킵니다. . 또한 모든 양초를 숨기거나 표시할 수도 있습니다. 강세만 또는 약세만 표시할 수 있습니다. 이는 Deriv와 같이 한 방향으로
필터:
리뷰 없음
리뷰 답변
버전 1.3 2023.12.16
Selection of graphic scales.

Menu organization.
버전 1.2 2021.11.05
Mejora en rendimiento
버전 1.1 2021.04.12
Correccion de error en la ventana