Moving Averages Swing Strategy
- 지표
- Nikolaos Nikolis
- 버전: 1.2
- 업데이트됨: 10 4월 2021
- 활성화: 5
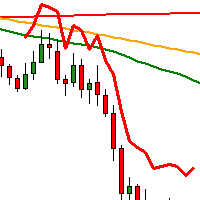
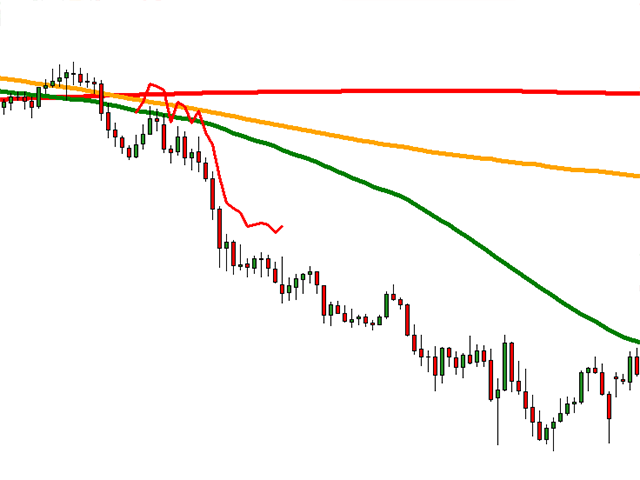
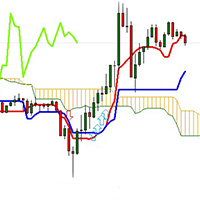
This Indicator is using 3MA's with different periods.
A Buy Signal occurs when Green on the top, yellow in the middle, red at the bottom.
A Sell Signal occurs when Red on the top, yellow in the middle, green at the bottom.
When there is buy signal the indicator draws a blue line below price.
When there is sell signal the indicator draws a red line above price.
In the comments section you may find a template file with the 3 MAs.
You can use this strategy alone or compined with another indicator with great results.
You may customize the mas and the min max distance between them.
You can trade this strategy with the Moving Average Swing Strategy EA.
Join the Discord Eas Community for support, recommedations etc. Eas Trading.


사용자가 평가에 대한 코멘트를 남기지 않았습니다