Price Line
- 지표
- Nikolay Likhovid
- 버전: 1.1
- 업데이트됨: 18 11월 2021
High, Low, Open, Close — isn't this too much? Sometimes you need a unique history of prices. But if choose one thing, you lose the rest. Smoothing also leads to data loss. Often you lose one of the most important market details: information about extremes. It is due to the preservation of information about the highs and lows, the correct "smoothing" for the history of price is a zigzag. But zigzags also have drawbacks — they do not provide intermediate values.
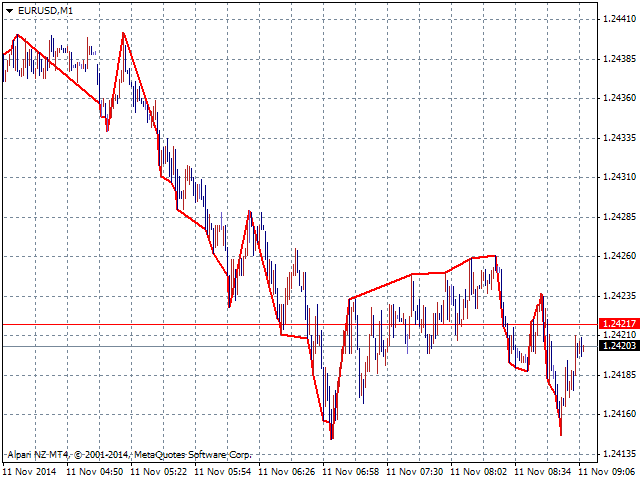
The Price Line indicator solves this problem by drawing a line at highs or at lows depending in what you need. Similar to the delays in smoothing, there may be some delay, but it is not constant. Often, the indicator can put another point immediately after the bar is closed, but sometimes you have to wait longer.
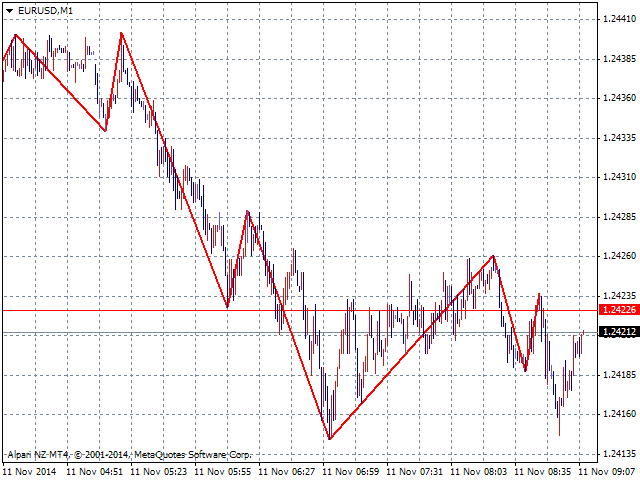
Treat this line the same way as traditionally smooth ones (for example moving average), although it might seem unusual at first. The result can also be displayed in the form of a zigzag.
Parameters
- Price Line Order — sets the method of "smoothing";
- Show as ZigZag — sets the display type;
- HistoryDepth — sets the depth of history in bars (if 0 — the whole history, if below 0 — the specified date range);
- StartDate — sets the calculation start date (for HistoryDepth < 0);
- StopDate — sets the calculation end date (for HistoryDepth < 0).












사용자가 평가에 대한 코멘트를 남기지 않았습니다