• 미리보기
  • 리뷰 (6)
  • 코멘트
  • 새 소식

VR Pivot

VR Pivot is an indicator of key pivot points.

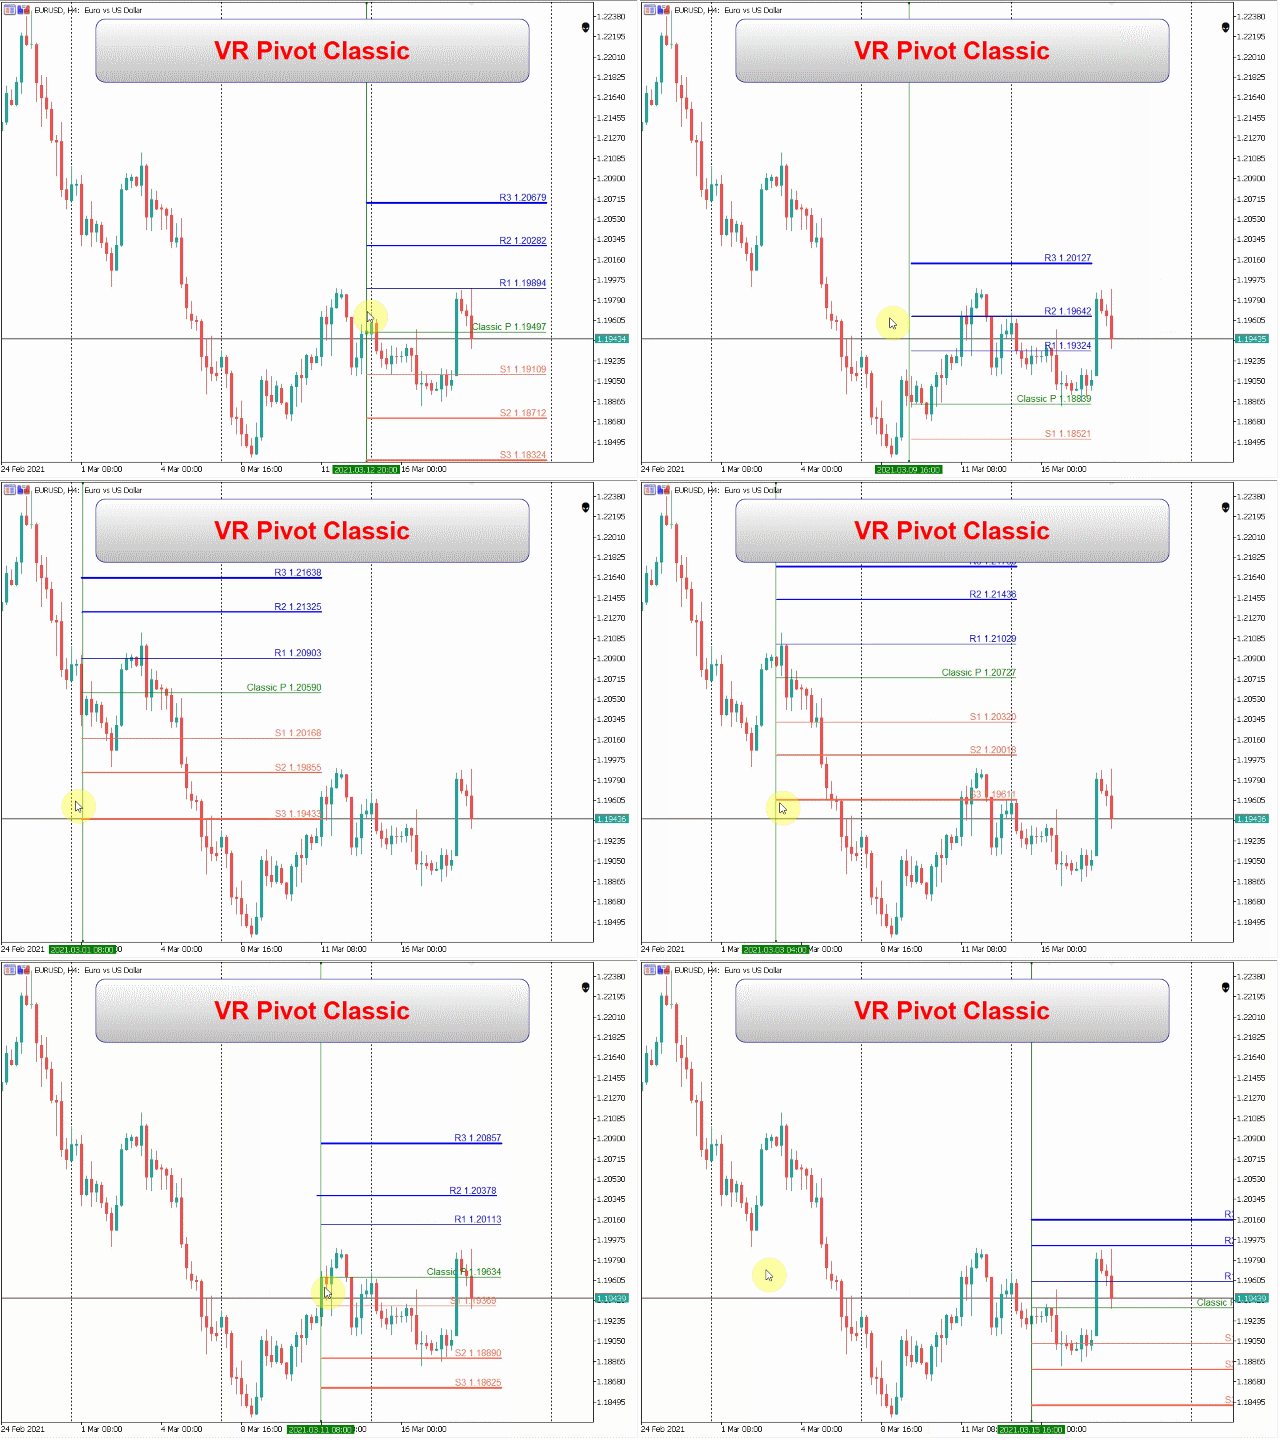
Pivot points are a special type of support and resistance levels that are used to determine the strongest price zones. Professional traders use pivot levels to determine prices at which there is a high probability of a price reversal. The levels are calculated using special mathematical formulas, which include the closing, opening, high, and low prices of the previous time period. The most effective is the daily period. It is important to note that at first glance it may seem that there is nothing special about these levels, but if you analyze the price movement using pivot levels, you can clearly see that in most cases these levels show good, accurate results.

You can request technical support, settings and demo versions of programs in the author's profile.

Pivot levels can be used not only as pivot points, but also as levels at which Take Profit can be used as efficiently as possible to maximize profit, Stop Loss to minimize losses as much as possible, and transfer positions to a no-loss zone to reduce risks.

Advantages of the VR Pivot Indicator:

  • The indicator supports the calculation of several formulas:
    • Classic Pivot - the classic formula for pivot points
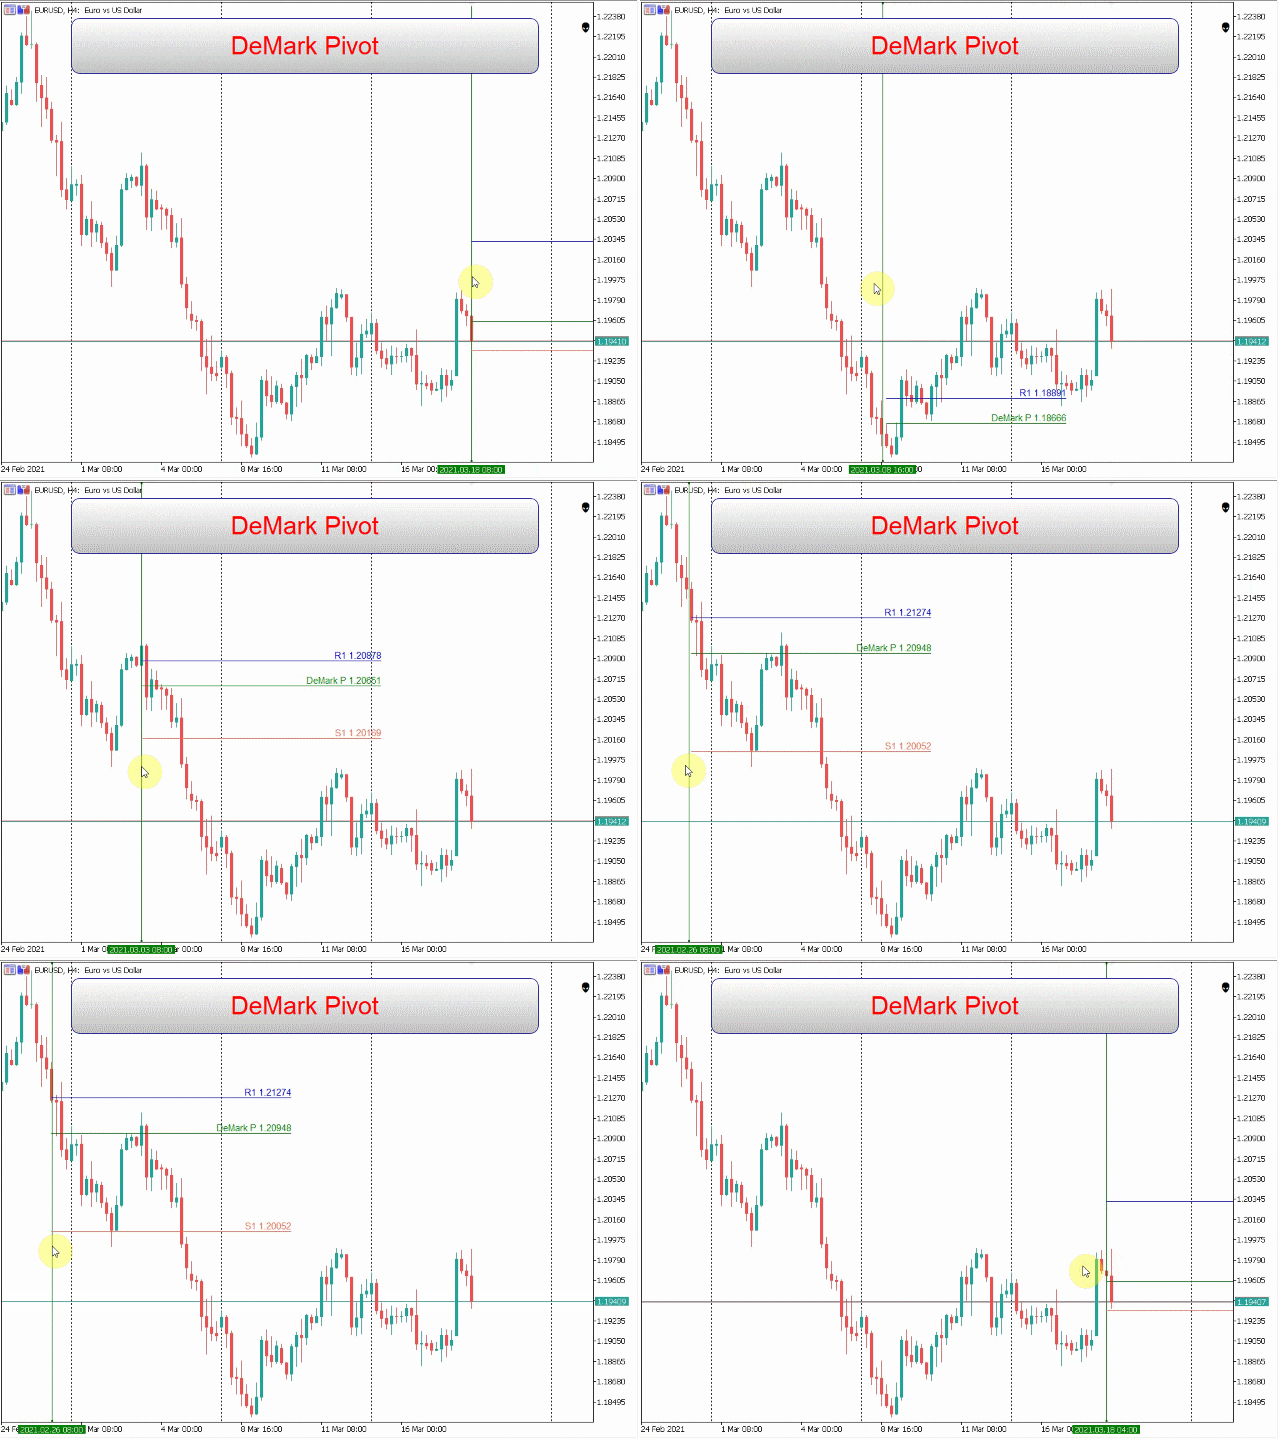
    • DeMark Pivot - DeMark formula
    • Woodie Pivot - Woodie Formula
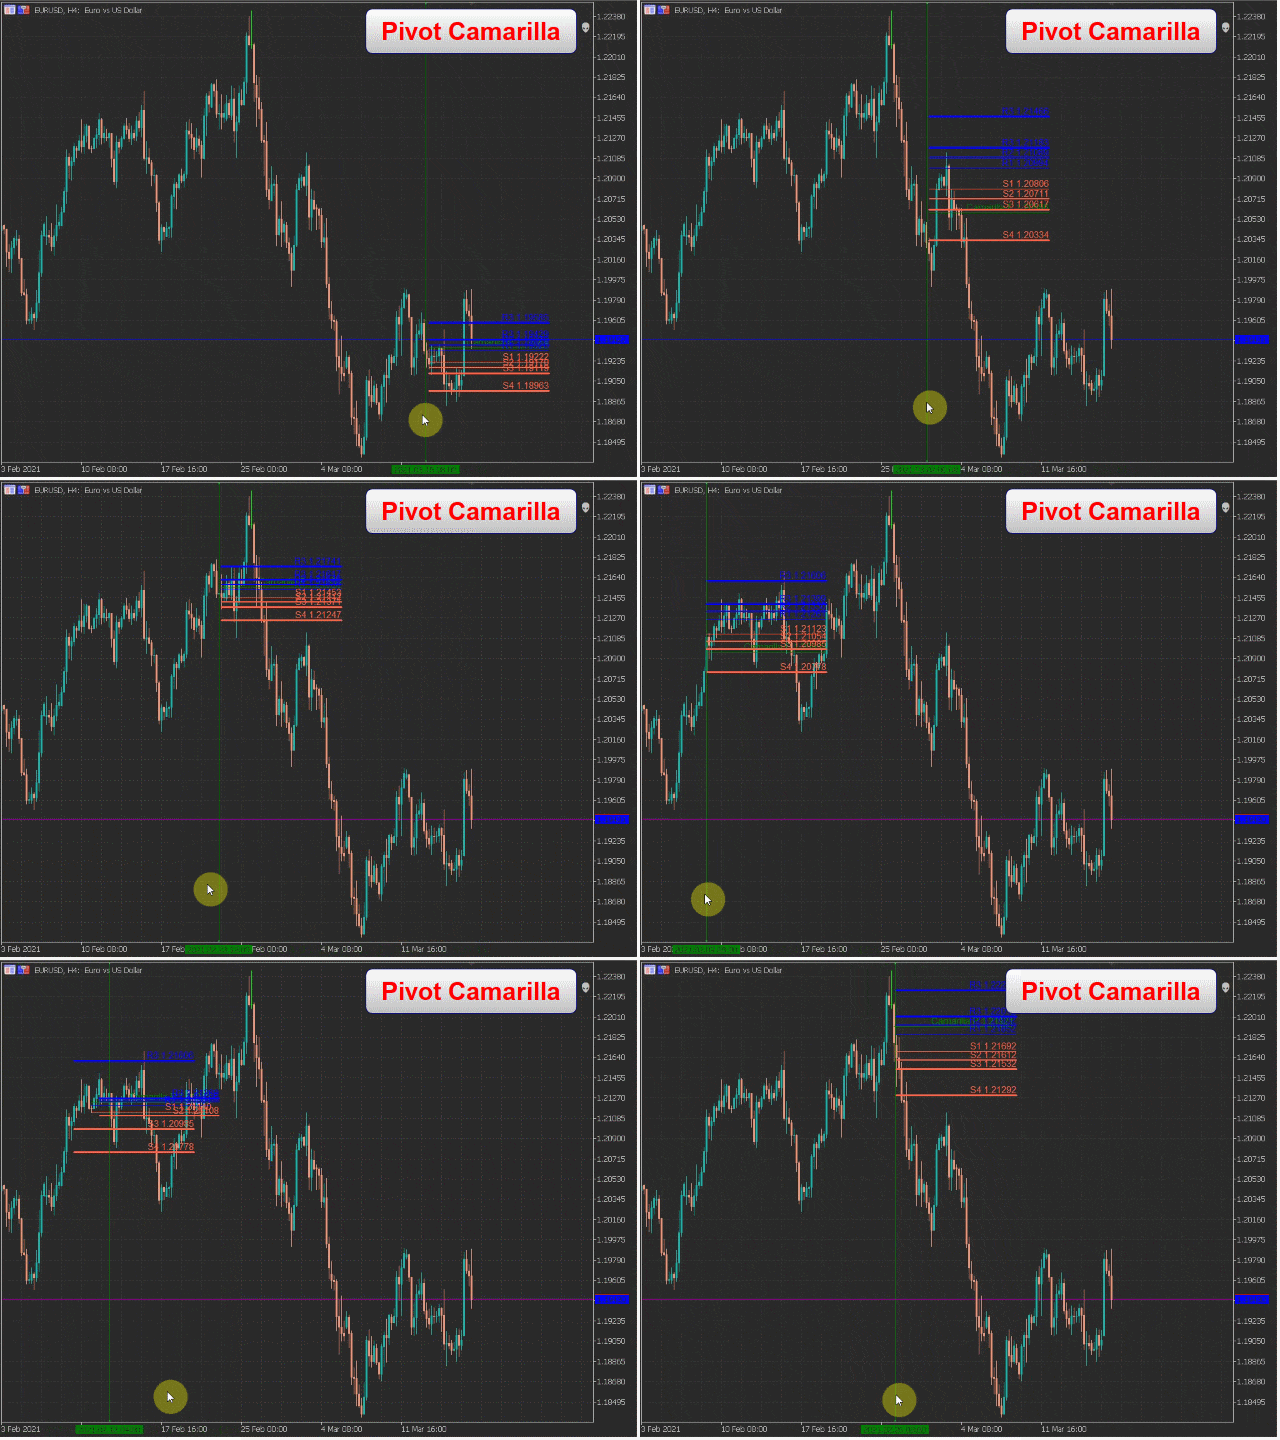
    • Camarilla Pivot - Camarilla Formula
    • Fibonacci Pivot - Fibonacci Formula
  • The program is implemented as an indicator and can work together with your Expert Advisors and other indicators
  • It is possible to analyze historical data
  • The program is written in such a way that it displays information for the period set by the user and does not clutter the chart with historical data.
  • The indicator can calculate losses for any financial instruments (Forex, Crypto, CFD, Futures, Metals)
  • The trader can choose any time frames for the calculation
  • The indicator has a large number of settings that allows you to customize it in any style

Indicator operation algorithm

After you drag the indicator from the navigator to the chart, you will see a settings window where you can select the calculation formula and adjust the colors of the levels. After you click the "Ok" button, the chart will display horizontal levels and one vertical level. Using the vertical level, the trader can move the starting point of the calculations. Use the vertical level to study the historical data. To calculate new key levels, move the vertical level to the current period.

Indicator Settings

  • Main settings - main indicator settings
  • Type Pivot - type of pivots
    • Classic Pivot - the classic formula for pivot points
    • DeMark Pivot - DeMark formula
    • Woodie Pivot - Woodie Formula
    • Camarilla Pivot - Camarilla Formula
    • Fibonacci Pivot - Fibonacci Formula
  • Length of lines - the length of horizontal levels in bars
  • Show Price - display prices on levels
  • Time Frame - The period for calculating the levels, must be greater than the period for which the indicator is set
  • Prefix - prefix for indicator objects
  • Color settings - indicator color settings
Versions for MetaTrader 5 Versions for MetaTrader 4
추천 제품
Pivot Points MT4
KEENBASE SOFTWARE SOLUTIONS
KT Pivot Points automatically plots the daily, weekly, and monthly pivot levels on a chart with the precise calculation based on the latest data. Pivot points is a widely used indicator in technical analysis, particularly in the Forex market. Features Send alerts when the price touches the pivot level.  It offers complete customization for each kind of pivot level.   Shows daily, weekly, and monthly pivot levels without any fuss. It uses minimum CPU resources for faster calculation. Compati
Auto AndrewFork
Noor Ghani Rahman
1 (1)
Auto Pitchfork Indicator The indicator calculate the Pitch fork for the previous Day (Selectable) with multiple Support and Resistance lines from the Median price which acts as Magnet for the Price that if price touch the above warning (1) or below warning (1) lines and not cross up or down then there is maximum possibilities that it will return to the Median Line, and thus maintain the Price Action in Cyclic Pattern to the Market Move. You are able to select how many warning lines you want to k
Grapic ByArrowTrend Pro
Truong Cong Truc
1 (1)
Indicator support for only: Entry Point to Trend Pro Link indicator  support   :   https://www.mql5.com/en/market/product/70867 Supports all currency pairs declared in the definition. Help investors do not need to open many charts. Notice the DEAL:  multiple time frames confluence   M15, H1, H4. Entry Point to Trend Pro The indicator helps investors to identify the earliest and perfect reversal point. Easy to make decision to trade with the trend   Price action trading. support resistance
FREE
VJ Pivot Levels
Vijayaratna Kumar Boda
4.25 (4)
Introduction: Whatever trading method you use, it is important to know the Pivot levels to take the key attention for your entries & exits. This indicator has been made using the standard classic formula for Auto drawing the Pivot levels. Also based on the previous day trading range, the probable expected today trading range has been highlighted in a different color for your reference. Output of the Indicator: This Indicator gives the Pivot level Different resistance Levels Different Support l
The   Pivot Point indicator   automatically calculates and displays the pivot point line and support and resistance levels. Pivot can be calculated according to the Classic, Floor, Fibonacci, Woodie, Camarilla or DeMark formula. It is also possible to select the period for calculating the indicator. A trader can choose from daily, weekly, monthly, or user-defined periods. Types of pivots Classic Floor Fibonacci Woodie Camarilla DeMark Main features The indicator shows the current and histor
FREE
FiboZag
Andriy Sydoruk
Indicator FiboZag - transfer the indicator to the chart and the Fibonacci levels will be built automatically on the last ZigZag turn. The main advantage lies in the correct construction of Fibonacci levels and markup of price levels. Simple, visual and effective use. The indicator is not redrawn and does not lag. Works on all currency pairs and on all timeframes.
MP Demark Pivot Levels
Pierre Ksachikian
4.5 (2)
This indicator is stand alone version from  MP Pivot Levels  (All in one) containing Demark's Pivots. Calculations:     PP = X / 4     R1 = X / 2 - LOWprev     S1 = X / 2 - HIGHprev Uses: When the pair currency price may change the direction of movement. Possible constraints of support and resistance that creates plateaus for the currency pair prices. Tendency identification by comparing the present prices according to current day's pivot point and also the prior day's pivot points. ___________
FREE
KT Auto Trendline MT4
KEENBASE SOFTWARE SOLUTIONS
KT Auto Trendline draws the upper and lower trendlines automatically using the last two significant swing highs/lows. Trendline anchor points are found by plotting the ZigZag over X number of bars. Features No guesswork requires. It instantly draws the notable trendlines without any uncertainty. Each trendline is extended with its corresponding rays, which helps determine the area of breakout/reversal. It can draw two separate upper and lower trendlines simultaneously. It works on all timefr
BeST_ Classic Pivot Points is an MT4 Indicator that is based on the widely known and definitely classic Pivot Point of a market prices activity. A pivot point is calculated as an average of significant prices (high,low,close) from the performance of a market in the prior trading period. If the market in the following period trades above the pivot point it is usually evaluated as a bullish sentiment, whereas trading below the pivot point is seen as bearish. A pivot point and the associated suppo
FREE
Gold Indicator
Ahmed Alaaeldin Abdulrahman Ahmed Elherzawi
5 (1)
This indicator uses horizontal lines to identify support and resistance levels based on Zigzag legs and On-Balance Volume (OBV) analysis. Here is a summary of how the indicator works: Resistance and Support Lines : A horizontal line above the current price level indicates resistance. A horizontal line below the current price level indicates support. Drawing Horizontal Lines : Draw horizontal lines on every Zigzag leg within the last X legs, where X is a specified number (e.g., 10). Only the most
FREE
The price is moving between two curve tunnel lines in a trend. The two lines of a tunnel represent support and resistance. In an uptrend, for instance, a trade might be entered at the support of the trend line (shown by the red line in the chart) and exited at resistance of the upper tunnel line (shown by the blue line). Tunnel show trend direction for any timeframe (if you have enough bars on the chart for higher timeframes). Trend, or price tunnel, can be up, down or sideways. If the current p
Fibonacci Magic Pivot Levels
Savia Forex Software Solutions
Fibonacci Magic Pivot Levels The  Fibonacci Magic Pivot Levels  is a  powerful yet easy to use indicator . It   continuously monitor s intra-day  price action  and uses complex algorithms to calculate and detect key support, resistance and pivot levels, using the D1 timeframe as a filter.  The    Fibonacci Magic Pivot Levels is optimized for H4, H1, M30, M15, M5 & M1 timeframes and  can be used on ALL Currencies, Indices, Commodities, and Cryptocurrency pairs . Trade with improved confidence an
The indicator allows to find consolidations. It is meant for channel breakthrough. Easy to use, it has only three parameters: Minimum number of bars to analyze Consolidation tunnel Indicator color It works on all timeframes . Approximate settings are adjusted for H1 by default. Works on all currency pairs. This indicator does not repaint and is not recalculated. All screenshots are real!
This is a Multi-Time-Frame Zigzag indicator You can change parameters of Zigzag, include Zigzag Depth, Zigzag Deviation, Zigzag Backstep. You can choose which Time Frame to display Zigzag by turn ShowXXX to true or false (ShowXXX = ShowM1, ShowM5, ShowM15...). Noted: Lower Time Frame Zigzag will not display on Higher Time Frame. Example: Your current Time Frame is H1, you can not see Zigzag of M1 to M30 even you turn them on.
PLUTO MASTER TURTLE (Binary Option)   The indicator allows you to trade binary options. The recommended timeframe is М5 and the expiration time is 5 minutes. The indicator works on any currency pairs. Trading time is not limited. A possible signal is specified as a arrow above/under a candle. If the arrow remains on the previous candle, you can enter the trade immediately. Arrows are not re-painted! The trading strategy is based on the correlation of the statistical RSI, STO and Candlestick body
Update:ver1.53 (2023/08/16) ・ Overview and required environment Generate a duplicate limit order reservation for manual orders or orders from other tools, etc. This is specialized to "simplify the ordering operation". For the analysis to decide ordering, please do your best by yourself, such as fishing for materials, deriving a rule of thumb, using other analysis tools and EA together, etc. Since version 1.28, the function of "automatically re-order after settlement" has been implemented. (This
FREE
Classic Fractals indicator for MT4, with additional Trendlines connecting the latest couples of fractals ( fractals are showing highest high, and lowest low on each period) Rules for trendlines: -if new top fractal is below the last one = new resistance line -if new bot fractal is above the last one = new support line -Trendlines can be hidden -Fractals can be hidden Fractal Period = can be both even or uneven number, as it is setting for half (one side) of the bars sequence
What is a Pivot? A pivot is a significant price level known in advance which traders view as important and may make trading decisions around that level. As a technical indicator, a pivot price is similar to a resistance or support level. If the pivot level is exceeded, the price is expected to continue in that direction. Or the price could reverse at or near that level. What does a Pivot Tell You? There are pivots and pivot points. These terms may mean different things to different people
Pivot Pro
Igor Semyonov
Description Pivot Pro  is a universal color indicator of the  Pivot Points  levels systems. You can select one of its three versions:  Standard   Old , Standard New  and  Fibo . The system will automatically calculate the  Pivot Point  on the basis of market data for the previous day ( PERIOD_D1 ) and the system of support and resistance levels, three in each. It can also display price tags for each level. You can color the indicator lines. Only a method of calculation of the third level of supp
VaviStar is an indicator based on trend retracements determined by ZigZag segments. It is theorized, and statistics confirm, that stocks react to certain retracement levels. Many use Fibonacci retracement levels (23.6%, 38.2%, 61.8%). It is assumed that once the price goes beyond the 61.8% retracement, we can already speak of a trend reversal. This indicator allows you to comfortably chart a segment of the ZigZag with the relative operating levels chosen. With a reversal mindset , you can use it
Scalping indicator. Points show the price reversal places on the chart. Not redrawn. Minimum delay. Works on M1, M5, M30, H1, H4 timeframes. You can work on all currency pairs. The indicator can also work on gold, silver and cryptocurrencies. This indicator can also be used for binary options. How to trade (an example of a strategy for GBPUSD)? When a blue dot appears, buy. When a red dot appears, sell. TakeProfit set to 25 points. StopLoss set 35 points. TrelingStop is set at 15 pips. Benefi
Multi Timeframe ZigZag Indicator
Salman A A A T Bakhash
5 (2)
Description: This indicator draw ZigZag Line in multiple time frame also search for Harmonic patterns before completion of the pattern. Features: Five instances of ZigZag indicators can be configured to any desired timeframe and inputs. Draw Harmonic pattern before pattern completion. Display Fibonacci retracement ratios. Configurable Fibonacci retracement ratios. Draw AB=CD based on Fibonacci retracement you define. You can define margin of error allowed in Harmonic or Fibonacci calculatio
FREE
PP Super Trend MT4
Mohammad Taher Halimi Tabrizi
Pivot Point Super Trend is another type of famous super trend indicator which is equipped with pivot points in different way. this indicator used to be available in the Trading view and this is converted from there to the MT4 language. MT5 version of the indicator is also available and you can find in my products. there are also buy/sell signals shown on the screen.
SR indicator
Alexander Chertnik
SR is a support and resistance indicator, it shows major highs and lows by different colors. The color of a level is changing if the last high or low are touching it. After the closing of a bar above or below level, it will delete it. extern inputs: loop for candles / colors / drawing time *This indicator signal is not perfect and have to be used with other market analysis and confirmations.
FREE
Introducing the Consecutive Green/Red Candle Alert Indicator for MT4 - Your Trend Spotting Companion! Are you ready to take your trading to the next level? We present the Consecutive Green/Red Candle Alert Indicator, a powerful tool designed to help you spot trends and potential reversals with ease. Whether you're a new trader looking for clarity in the market or an experienced pro seeking additional confirmation, this indicator is your trusted companion. Key Features of the Consecutive Green/Re
FREE
Update:ver1.53 (2023/08/16) ・概要と必要環境 手動発注もしくは他ツール等からの発注に対し、指値発注予約の複製を生成します。こちらは「発注操作の簡易化」に特化したものになります。発注判断となる分析は、資料を漁る、経験則を導く、他の分析ツールやEAを併用する等、利用者ご自身で頑張ってください。なお、ver1.28より、「決済後、自動で再発注する」機能が実装されました。(有償版でのみ有効化できます) ・導入と導入後の操作 導入そのものは簡単です。「自動売買可能なEA」として、適当なチャートにて動作させるだけです。(チャートの対象相場は問いません。このEAは、チャートを見ていません)。あとは、「このEAでのローカルコピー以外の発注」があれば、それに応じて「損失が出た場合に備えての追加取引の予約」という形で、指値発注が自動生成されます。 導入操作上の注意として、「本EAを、複数のチャートで動作」はできません。EAがチャート自体を見ておらず、注文状況だけを見ているため、複数のチャートで動かす意味もありません。また、ターミナルとEAの設定として「自動売買」を許可しな
FREE
The Auto Super Pivot indicator is an indicator designed to calculate support points and resistance points for pivot points. this indicator has the ability to calculate standard pivot, fibonacci, camarilla, woodie and demark pivot points. It also allows you to use all time zones with the time frame feature. Another feature of the indicator is the auto time slice feature. This feature allows automatic calculations without having to set any time zone. Features 6 different pivot calculation modes
Capital Pivot
Mr Nisit Noijeam
Pivot Points และระดับ (Support) และ(Resistance) บนแผนภูมิการเทรดใน MetaTrader 4 สำหรับตลาด Forex : คำนวณ Pivot Points : สคริปต์คำนวณจุด Pivot โดยใช้ข้อมูลราคาประวัติศาสตร์ เช่น ราคาเปิด, ราคาสูงสุด, ราคาต่ำสุด, และราคาปิด จากช่วงเวลาที่กำหนด (เช่น วัน, ชั่วโมง, ฯลฯ) จุด Pivot และระดับต่างๆ เช่น R1, R2, R3 (ระดับการต้านทาน) และ S1, S2, S3 (ระดับการสนับสนุน) ถูกคำนวณออกมา แสดงบนแผนภูมิ : หลังจากคำนวณจุด Pivot และระดับต่างๆ, สคริปต์จะแสดงเส้นเหล่านี้บนแผนภูมิ MT4 เพื่อช่วยให้นักเทรดสามารถเห็นจุดที่
Major Support and Resistance Indicator
Ahmad Ar Abedalaziz Alazaizeh
This indicator filters the Zigzag indicator to calculate the main support and resistance levels. Variables minimum gap between peaks : is the distance (GAP) between the peaks of the Zigzag peaks sensitivity : Minimum number of nearby peaks look back: it means that it has to test the last 50 peaks in the Zigzag object name perfix: a prefix for level’s line name on chart
FREE
Key level wedge pro
Presley Annais Tatenda Meck
5 (1)
We have combined all of our beloved indicators the likes of: Key level order block , Key level supply and demand , Key level liquidity grab and Key level wedge into one single indicator and dashboard. Whats new Dashboard : There is an easy access dashboard for all your needs. Multi-timeframe button : There is now a multi-timeframe option for Order Blocks and Supply and demand zones, making it easy to see higher timeframe zones easily on the current timeframe by just clicking the desired timefr
이 제품의 구매자들이 또한 구매함
Gann Made Easy
Oleg Rodin
4.83 (92)
Gann Made Easy 는 mr.의 이론을 사용하여 최고의 거래 원칙을 기반으로 하는 전문적이고 사용하기 쉬운 Forex 거래 시스템입니다. W.D. 간. 이 표시기는 Stop Loss 및 Take Profit Levels를 포함하여 정확한 BUY 및 SELL 신호를 제공합니다. PUSH 알림을 사용하여 이동 중에도 거래할 수 있습니다. 구매 후 연락주세요! 내 거래 팁과 훌륭한 보너스 지표를 무료로 공유하겠습니다! 아마도 Gann 거래 방법에 대해 이미 여러 번 들었을 것입니다. 일반적으로 Gann의 이론은 초보자 거래자뿐만 아니라 이미 거래 경험이 있는 사람들에게도 매우 복잡한 것입니다. Gann의 거래 방식은 이론적으로 적용하기 쉽지 않기 때문입니다. 나는 그 지식을 연마하고 Forex 지표에 최고의 원칙을 적용하기 위해 몇 년을 보냈습니다. 표시기는 적용하기가 매우 쉽습니다. 차트에 첨부하고 간단한 거래 권장 사항을 따르기만 하면 됩니다. 지표는 지속적으로 시장 분석 작업
Bull versus Bear
Mohamed Hassan
4.55 (11)
Official Release price of $65 for the first 97 /100   copies ( 3  copies left). Next price is $120 !  Send us a message after your purchase to receive more information on how to get your  BONUS  for FREE  that works in great combination with Bull vs Bear ! Bull versus Bear is an easy-to-use Forex indicator that gives traders clear and accurate signals based on clear trend retests . Forget about lagging indicators or staring at charts for hours because  Bull vs Bear provides real-time entrie
- Real price is 80$ - 40% Discount ( It is 49$ now ) Contact me for instruction, add group and any questions! Related Products:  Bitcoin Expert , Gold Expert Introduction The breakout and retest strategy is traded support and resistance levels. it involves price breaking through a previous level.  The break and retest strategy is designed to help traders do two main things, the first is to avoid false breakouts. Many false breakouts start with a candlestick that breaks out of a level but ends w
Golden Trend Indicator
Noha Mohamed Fathy Younes Badr
5 (1)
Golden Trend indicator  is The best indicator for predicting trend movement this indicator never lags and never repaints and never back paints    and give  arrow buy and sell    before the candle appear  and it will help you and  will make your trading decisions clearer its work on all currencies and  gold and crypto and all time frame This unique  indicator uses very secret algorithms to catch the  trends, so you can trade using this indicator and see the trend clear on charts  manual guide and
FX Power MT4 NG
Daniel Stein
5 (14)
FX 파워 NG의 모든 기능을 활용하세요: 궁극의 통화 강도 측정기 FX Power는 8년 이상 전 세계 트레이더에게 믿을 수 있고 정확한 통화 강세 분석을 제공해 왔습니다. 이제 FX Power NG는 이 신뢰할 수 있는 도구를 한 단계 더 발전시켜 거래에 탁월한 정확성, 사용자 지정 및 통찰력을 제공하는 고급 기능을 제공합니다. FX Power NG가 진지한 트레이더에게 필수품인 이유는 무엇인가요? FX Power NG는 기존 FX Power에서 좋아했던 모든 기능을 기반으로 주요 기능을 추가하고 개선했습니다: 금 강도 분석(XAU): 이제 통화쌍과 함께 금의 강세를 추적하여 더욱 폭넓은 시장 인사이트를 얻을 수 있습니다. 정교한 계산: 모든 분석에서 더욱 정확하고 신뢰할 수 있는 결과를 경험하세요. 사용자 지정 가능한 분석 기간: 일중부터 장기 인사이트까지 트레이딩 전략에 맞게 분석 기간을 조정할 수 있습니다. 고급 다중 인스턴스 설정: 여러 인스턴스를 실행하여 종합적으
FX Volume
Daniel Stein
4.58 (33)
FX 볼륨으로 외환 거래에서 진정한 우위를 점하세요: 최고의 거래량 지표 FX 거래량은 내부자 관점에서 진정한 시장 심리를 보여주는 최초이자 유일한 거래량 지표입니다. FX 거래량은 기관 시장 참여자와 브로커의 포지션에 대한 고유한 인사이트를 제공함으로써 일반적으로 메이저 플레이어에게만 있는 선견지명을 가지고 거래할 수 있게 해줍니다. FX 볼륨은 차트에서 이 중요한 정보를 즉시 제공하므로 더 빠르고 현명한 트레이딩 결정을 내릴 수 있습니다. FX 볼륨이 트레이딩에 필수적인 이유 FX 거래량을 사용하면 고유한 시장 데이터에 비할 데 없이 접근할 수 있어 일반적인 거래량 지표가 제공하지 못하는 인사이트를 얻을 수 있습니다. 차트에서 직접 추적할 수 있는 항목은 다음과 같습니다: 포지션 비율: 통화별 롱/숏 포지션 비율을 확인하여 시장 심리를 명확하게 파악하세요. 비율 변화: 선택한 기간 동안 매수 포지션의 비율 변화를 확인하세요. 총 거래량: 통화별 총 거래량(매수 및 매도)을
Trend Screener
STE S.S.COMPANY
4.81 (89)
트렌드 표시기, 트렌드 트레이딩 및 필터링을 위한 획기적인 고유 솔루션, 하나의 도구 안에 내장된 모든 중요한 트렌드 기능! Forex, 상품, 암호 화폐, 지수 및 주식과 같은 모든 기호/도구에 사용할 수 있는 100% 다시 칠하지 않는 다중 시간 프레임 및 다중 통화 표시기입니다. 기간 한정 특가: 지원 및 저항 스크리너 지표는 단 100달러에 평생 제공됩니다. (원래 가격 50 달러) (제안 연장) Trend Screener는 차트에 점이 있는 화살표 추세 신호를 제공하는 효율적인 지표 추세 추종 지표입니다. 추세 분석기 표시기에서 사용할 수 있는 기능: 1. 트렌드 스캐너. 2. 최대 이익 분석이 있는 추세선. 3. 추세 통화 강도 측정기. 4. 경고가 있는 추세 반전 점. 5. 경고가 있는 강력한 추세 점. 6. 추세 화살표 Trend Screener Indicator가 있는 일일 분석 예, 일일 신호 성능...등은 여기에서 찾을 수 있습니다.   여기를 클릭하십시오.
TPSproTREND PrO
Roman Podpora
4.79 (19)
TPSpro TREND PRO는   시장을 자동으로 분석하여 추세와 각 변화에 대한 정보를 제공할 뿐만 아니라 다시 그리지 않고도 거래에 진입할 수 있는 신호를 제공하는 추세 지표입니다! 지표는 각 양초를 사용하여 개별적으로 분석합니다. 다른 임펄스를 언급합니다 - 업 또는 다운 임펄스. 통화, 암호화폐, 금속, 주식, 지수 거래의 정확한 진입점! 버전 MT5                   표시기에 대한 전체 설명       표시기   와 함께 사용하는 것이 좋습니다   -   RFI LEVELS 주요 기능: 렌더링 없이 정확한 입력 신호! 신호가 나타나면 관련성은 유지됩니다! 이는 신호를 제공한 후 변경하여 예금 자금 손실을 초래할 수 있는 다시 그리기 지표와의 중요한 차이점입니다. 이제 더 큰 확률과 정확도로 시장에 진입할 수 있습니다. 화살표가 나타난 후 목표에 도달(이익실현)하거나 반전 신호가 나타날 때까지 캔들을 색칠하는 기능도 있습니다. STOP LOSS / TAK
Trend Punch
Mohamed Hassan
4.95 (21)
This indicator is unstoppable when combined with our other indicator called  Support & Resistance . After purchase, send us a message and you will get it   for  FREE as a BONUS! Introducing Trend Punch , the revolutionary forex trend indicator that will transform the way you trade! Trend Punch is uniquely designed to provide precise buy and sell arrows during strong market trends, making your trading decisions clearer and more confident. Whether you're trading major currency pairs or exotic sym
MetaBands M4
Vahidreza Heidar Gholami
5 (3)
MetaBands uses powerful and unique algorithms to draw channels and detect trends so that it can provide traders with potential points for entering and exiting trades. It’s a channel indicator plus a powerful trend indicator. It includes different types of channels which can be merged to create new channels simply by using the input parameters. MetaBands uses all types of alerts to notify users about market events. Features Supports most of the channel algorithms Powerful trend detection algorith
Atomic Analyst
Issam Kassas
5 (2)
우선적으로 언급할 점은이 거래 지표가 다시 그리지 않고 지연되지 않으며 이를 통해 수동 및 로봇 거래 모두에 이상적이라는 점입니다. 사용자 매뉴얼: 설정, 입력 및 전략. Atomic Analyst는 가격의 강도와 모멘텀을 활용하여 시장에서 더 나은 이점을 찾는 PA Price Action Indicator입니다. 고급 필터를 장착하여 잡음과 거짓 신호를 제거하고 거래 잠재력을 높이는 데 도움이 됩니다. 복잡한 지표의 다중 레이어를 사용하여 Atomic Analyst는 차트를 스캔하고 복잡한 수학적 계산을 간단한 신호와 색상으로 변환하여 초보 트레이더가 이해하고 일관된 거래 결정을 내릴 수 있도록합니다. "Atomic Analyst"는 새로운 및 경험이 풍부한 트레이더를위한 종합적인 거래 솔루션입니다. 프리미엄 지표와 최고 수준의 기능을 하나의 거래 전략에 결합하여 모든 종류의 트레이더에 대한 다재다능한 선택지가되었습니다. 인트라데이 거래 및 스캘핑 전략 : 빠르고 정확한
Quantum Breakout Indicator PRO
Bogdan Ion Puscasu
4.96 (26)
소개       Quantum Breakout PRO   , 브레이크아웃 존 거래 방식을 변화시키는 획기적인 MQL5 지표! 13년 이상의 거래 경험을 가진 숙련된 트레이더 팀이 개발한   Quantum Breakout PRO는   혁신적이고 역동적인 브레이크아웃 영역 전략으로 거래 여정을 새로운 차원으로 끌어올리도록 설계되었습니다. Quantum Breakout Indicator는 5개의 이익 목표 영역이 있는 브레이크아웃 영역의 신호 화살표와 브레이크아웃 상자를 기반으로 한 손절 제안을 제공합니다. 초보자 거래자와 전문 거래자 모두에게 적합합니다. Quantum EA 채널:       여기를 클릭하세요 MT5 버전 :   여기를 클릭하세요 중요한! 구매 후 설치 매뉴얼을 받으려면 개인 메시지를 보내주십시오. 추천: 기간: M15 통화쌍: GBPJPY, EURJPY, USDJPY,NZDUSD, XAUUSD 계정 유형: 스프레드가 매우 낮은 ECN, Ra
TrendMaestro
Stefano Frisetti
5 (3)
note: this indicator is for METATRADER4, if you want the version for METATRADER5 this is the link:  https://www.mql5.com/it/market/product/108106 TRENDMAESTRO ver 2.4 TRENDMAESTRO recognizes a new TREND in the bud, he never makes mistakes. The certainty of identifying a new TREND is priceless. DESCRIPTION TRENDMAESTRO identifies a new TREND in the bud, this indicator examines the volatility, volumes and momentum to identify the moment in which there is an explosion of one or more of these data a
Gold Stuff
Vasiliy Strukov
4.87 (243)
Gold Stuff는 금을 위해 특별히 설계된 추세 지표이며 모든 금융 상품에서도 사용할 수 있습니다. 표시기가 다시 그려지지 않고 지연되지 않습니다. 권장 기간 H1. 표시기에서 완전 자동 Expert Advisor EA Gold Stuff를 작동합니다. 내 프로필에서 찾을 수 있습니다. 설정 및 개인 보너스를 받으려면 구매 후 즉시 저에게 연락하십시오!   강력한 지원 및 트렌드 스캐너 표시기의 무료 사본을 받으실 수 있습니다. 메시지를 보내주세요. 나!   설정 화살표 그리기 - 켜기 끄기. 차트에 화살표 그리기. 경고 - 가청 경고를 끕니다. 이메일 알림 - 켜기 끄기. 이메일 알림. Puch-notification - 켜기 끄기. 푸시 알림. 다음으로 색 영역을 조정합니다. Gold Stuff는 금을 위해 특별히 설계된 추세 지표이며 모든 금융 상품에서도 사용할 수 있습니다. 표시기가 다시 그려지지 않고 지연되지 않습니다. 권장 기간 H1. 표시기에서 완
Dynamic Forex28 Navigator
Bernhard Schweigert
5 (2)
Dynamic Forex28 Navigator - 차세대 외환 거래 도구. 현재 49% 할인. Dynamic Forex28 Navigator는 오랫동안 인기 있는 지표의 진화형으로, 세 가지의 힘을 하나로 결합했습니다. 고급 통화 Strength28 지표(695개 리뷰) + 고급 통화 IMPULSE with ALERT(520개 리뷰) + CS28 콤보 신호(보너스). 지표에 대한 자세한 정보 https://www.mql5.com/en/blogs/post/758844 차세대 Strength 지표는 무엇을 제공합니까?  원래 지표에서 좋아했던 모든 것이 새로운 기능과 더 높은 정확도로 강화되었습니다. 주요 기능: 독점적인 통화 Strength 공식.  모든 시간대에 걸쳐 부드럽고 정확한 강도선. 추세와 정확한 진입을 식별하는 데 이상적입니다. 역동적인 시장 피보나치 수준(시장 피보나치).  이 지표에만 있는 고유한 기능. 가격 차트가 아닌 통화 강도에 피보나치가 적용
Scalper Inside PRO
Alexey Minkov
4.73 (56)
An exclusive indicator that utilizes an innovative algorithm to swiftly and accurately determine the market trend. The indicator automatically calculates opening, closing, and profit levels, providing detailed trading statistics. With these features, you can choose the most appropriate trading instrument for the current market conditions. Additionally, you can easily integrate your own arrow indicators into Scalper Inside Pro to quickly evaluate their statistics and profitability. Scalper Inside
Scalper Vault
Oleg Rodin
5 (27)
Scalper Vault 는 성공적인 스캘핑에 필요한 모든 것을 제공하는 전문 스캘핑 시스템입니다. 이 표시기는 외환 및 바이너리 옵션 거래자가 사용할 수 있는 완전한 거래 시스템입니다. 권장 시간 프레임은 M5입니다. 시스템은 추세 방향으로 정확한 화살표 신호를 제공합니다. 또한 상단 및 하단 신호와 Gann 시장 수준을 제공합니다.  이 시스템은 사용하기가 매우 쉽습니다. 원하는 시장 지역의 화살표만 따라가면 됩니다. 엑시트는 가격이 적정 수준에 도달하거나 시장의 고점 또는 저점 신호가 나타날 때 수행됩니다.  표시기는 PUSH 알림을 포함한 모든 유형의 경고를 제공합니다. 인디케이터 구매 후 연락주세요. 내 개인 거래 권장 사항과 훌륭한 보너스 지표를 무료로 공유합니다! 나는 당신에게 행복하고 유익한 거래를 기원합니다!
현재 20% 할인 ! 초보자 또는 전문가 트레이더를 위한 최고의 솔루션! 이 대시보드 소프트웨어는 28개의 통화 쌍에서 작동합니다. 2가지 주요 지표(Advanced Currency Strength 28 및 Advanced Currency Impulse)를 기반으로 합니다. 전체 Forex 시장에 대한 훌륭한 개요를 제공합니다. 고급 통화 강도 값, 통화 이동 속도 및 모든(9) 시간대의 28 Forex 쌍에 대한 신호를 보여줍니다. 추세 및/또는 스캘핑 기회를 정확히 파악하기 위해 차트의 단일 지표를 사용하여 전체 시장을 볼 수 있을 때 거래가 어떻게 개선될지 상상해 보십시오! 잠재적인 거래를 식별하고 확인하면서 강력한 통화와 약한 통화를 더욱 쉽게 식별할 수 있도록 이 지표에 기능을 내장했습니다. 이 표시기는 통화의 강세 또는 약세가 증가 또는 감소하는지 여부와 모든 시간대에서 수행되는 방식을 그래픽으로 보여줍니다. 추가된 새로운 기능은 현재 시장 조건 변화에 적
Chart Patterns All in One
Davit Beridze
4.45 (11)
구매 후 댓글을 남기시면 고품질의 인디케이터 4개를 보너스로 받으실 수 있습니다. Chart Patterns All-in-One 지표는 트레이더가 기술 분석에서 흔히 사용되는 다양한 차트 패턴을 시각화하는 데 도움을 줍니다. 이 지표는 잠재적인 시장 움직임을 식별하는 데 도움이 되지만, 수익성을 보장하지는 않습니다. 구매 전에 데모 모드에서 지표를 테스트하는 것이 좋습니다. 현재 할인 : "Chart Patterns All in One" 지표 50% 할인 중. 포함된 패턴 : 1-2-3 패턴 : 세 가지 주요 지점(고점 또는 저점)을 사용하여 시장 반전을 감지합니다. 매수 : 연속된 두 저점 이후, 이전 고점보다 낮은 고점이 발생할 때. 매도 : 연속된 두 고점 이후, 이전 저점보다 높은 저점이 발생할 때. 시각화 : 선과 화살표가 감지된 지점을 연결합니다. 더블 탑과 더블 바텀 : 가격이 두 개의 연속된 고점(더블 탑) 또는 저점(더블 바텀)을 형성할 때, 반전의 가능성을 나타냅니
TakePropips Donchian Trend Pro
Eric John Pajarillaga Aldana
4.44 (16)
TakePropips Donchian Trend Pro   (MT4)는 Donchian 채널을 사용하여 추세의 방향을 자동으로 감지하고 진입 및 퇴장 거래 신호를 제공하는 강력하고 효과적인 도구입니다! 이 다기능 지표에는 추세 스캐너, 거래 신호, 통계 패널, 스크리너, 거래 세션 및 경고 내역 대시보드가 포함됩니다. 거래 신호를 제공하고 차트 분석 시간을 절약하도록 설계되었습니다! 다음 블로그 게시물에서 사용자 설명서 및 설치 가이드를 다운로드할 수 있습니다.   https://www.mql5.com/en/blogs/post/751368 오늘 50% 할인을 받으세요! 가격이 $98에서 $49로 인하되었습니다! 전략 테스터에서 이 지표를 테스트할 수 있습니다(비주얼 모드 활성화).  자세한 내용은 설명 아래에 비디오 자습서도 제공됩니다. 질문이 있거나 도움이 필요하면 저에게 연락하십시오. TakePropips Donchian Trend Pro 지표는 모든 Forex 쌍, 금속
FX Levels MT4
Daniel Stein
FX 레벨 알아보기: 트레이딩 성공을 위한 궁극적인 지지 및 저항 지표 FX 레벨은 단순한 지지 및 저항 지표가 아니라 통화쌍, 지수, 주식, 원자재 등 모든 거래 기호에 대해 정확성, 신뢰성, 원활한 기능을 원하는 진지한 트레이더를 위한 게임 체인저입니다. 입증된 라이트하우스 방식을 기반으로 하고 동적 실시간 적응성으로 강화된 FX 레벨은 차트에 바로 시장 반전 포인트를 표시해 정확한 수익 목표를 설정하고 거래 진입을 최적화하는 데 적합합니다. 왜 FX 레벨을 선택해야 하나요? 스타인 인베스트먼트 팀은 브로커와 다양한 데이터 피드에 대한 다년간의 경험을 활용하여 정확성과 일관성이 뛰어난 FX 레벨을 만들었습니다. 여러 브로커에서 거의 100% 동일한 레벨을 제공하는 FX 레벨은 다른 지표가 제공할 수 없는 탁월한 수준의 신뢰성을 제공합니다. FX 레벨을 향상시키는 것은 세부 사항에 대한 우리의 약속이며, 기대치를 충족시킬뿐만 아니라지지 및 저항 분석에 접근하는 방식을 변화시
TPSpro RFI Levels
Roman Podpora
4.82 (22)
지침         러시아   -        영어       표시기와 함께 사용하는 것이 좋습니다   .       -       TPSpro   트렌드 프로 -   MT4 버전         거래에서 핵심 요소는 거래 상품을 매수 또는 매도하기로 결정하는 구역 또는 수준입니다. 주요 업체가 시장에서 자신의 존재를 숨기려는 시도에도 불구하고, 그들은 필연적으로 흔적을 남깁니다. 우리의 과제는 이러한 흔적을 식별하고 올바르게 해석하는 방법을 배우는 것이었습니다. 주요 기능:: 판매자와 구매자를 위한 활성 영역을 표시합니다! 이 지표는 매수 및 매도를 위한 모든 올바른 초기 임펄스 레벨/존을 보여줍니다. 진입점 검색이 시작되는 이러한 레벨/존이 활성화되면 레벨의 색상이 바뀌고 특정 음영으로 채워집니다. 또한 상황을 보다 직관적으로 이해하기 위해 화살표가 나타납니다. 더 높은 시간대의 레벨/존 표시(MTF 모드) 더 높은 시간 간격을 사용하여 레벨/존을 표시하는 기능을 추가했습니다.
Connect Indicator
Sukunthakan Ngernbamrung
Connect Indicator is a tool used for connecting indicators between the MQL market and MT4. The connected indicators are made by our group and can be used for other applications, such as sending messages to the Line application or Telegram application. If you have any questions, please don't hesitate to ask us to receive support. Function and indicator buffer Buffer one is the high price of the previous candle. Buffer two is the high price of the previous candle. Usage To connect indicators to fu
Stratos Pali
Michela Russo
5 (1)
Stratos Pali Indicator   is a revolutionary tool designed to enhance your trading strategy by accurately identifying market trends. This sophisticated indicator uses a unique algorithm to generate a complete histogram, which records when the trend is Long or Short. When a trend reversal occurs, an arrow appears, indicating the new direction of the trend. Important Information Revealed Leave a review and contact me via mql5 message to receive My Top 5 set files for Stratos Pali at no cost! D
Entry Arrow Alerts: Finds market entry opportunities then notifies you via mobile or desktop alerts The key features include: Conservative mode . One entry signal per direction. Ideal for the patient trader looking to capture longer term moves. Aggressive mode . Multiple possible entry signals per direction. Ideal for the active trader looking to capture multiple moves within the same trend. Trigger Line . Price entry line helps cut down on false signals. Display Window . Allows you to instantly
Market Reversal Alerts
LEE SAMSON
4.19 (113)
가격이 역전되고 후퇴함에 따라 시장 구조가 변경됩니다. 시장 구조 반전 경고 표시기는 추세 또는 가격 움직임이 고갈에 가까워지고 반전할 준비가 되었음을 식별합니다. 일반적으로 반전이나 큰 하락이 일어나려고 할 때 발생하는 시장 구조의 변화를 알려줍니다. 지표는 가능한 고갈 지점 근처에서 새로운 고점 또는 저점이 형성될 때마다 초기에 돌파와 가격 모멘텀을 식별합니다. 표시기는 반대쪽에 있는 마지막 촛불에 직사각형을 그립니다. 그런 다음 현재의 단기 추세에서 계속 움직이기 때문에 가격과 함께 직사각형을 따라갈 것입니다. 가격이 사각형 위나 아래로 다시 닫힐 정도로 약해지면 시장 구조에 잠재적인 변화가 일어나고 있음을 나타냅니다. 그런 다음 표시기는 방향의 잠재적인 이동과 추세 또는 주요 하락의 가능한 반전 시작에 대해 경고합니다. 작동 방식을 보려면 아래의 작동 표시기를 참조하십시오! 여기에서 모든 쌍 및 기간을 모니터링하기 위한 선택적 대시보드 추가 기능: https://
Advanced Supply Demand
Bernhard Schweigert
4.91 (295)
현재 33% 할인! 초보자나 전문 트레이더를 위한 최고의 솔루션! 이 보조지표는 우리가 다수의 독창적 기능과 새로운 공식을 통합한 독특하고 고품질이며 저렴한 거래 도구입니다. 이 업데이트를 통해 이중 시간대를 표시할 수 있습니다. 더 높은 TF를 표시할 수 있을 뿐만 아니라 차트 TF와 더 높은 TF 모두를 표시할 수 있습니다: 중첩 영역 표시. 모든 Supply Demand 트레이더들이 좋아할 것입니다. :) 중요한 정보 공개 Advanced Supply Demand의 잠재력을 극대화하려면 다음을 방문하십시오. https://www.mql5.com/ko/blogs/post/720245   진입 또는 목표의 명확한 트리거 포인트를 정확히 찾아냄으로 해서 거래가 어떻게 개선될지 상상해 보십시오. 새로운 알고리즘을 기반으로 매수자와 매도자 간의 잠재적인 불균형을 훨씬 더 쉽게 분간할 수 있습니다. 왜냐하면 가장 강한 공급영역과 가장 강한 수요 영역과 과거에 어떻게 진행 되었는지를(이
Supply and Demand Dashboard PRO
Bernhard Schweigert
4.8 (20)
현재 20% 할인! 이 대시보드는 여러 기호와 최대 9개의 타임프레임에서 작동하는 매우 강력한 소프트웨어입니다. 주요 지표(최상의 리뷰: 고급 공급 수요)를 기반으로 합니다.   Advanced Supply Demand 대시보드는 훌륭한 개요를 제공합니다. 다음과 같이 표시됩니다.  영역 강도 등급을 포함하여 필터링된 공급 및 수요 값, 영역에 대한/및 영역 내 Pips 거리, 중첩된 영역을 강조 표시하고 모든 (9) 시간 프레임에서 선택한 기호에 대해 4가지 종류의 경고를 제공합니다. 그것은 당신의 개인적인 필요에 맞게 고도로 구성 가능합니다! 당신의 혜택! 모든 트레이더에게 가장 중요한 질문: 시장에 진입하기에 가장 좋은 수준은 무엇입니까? 최고의 성공 기회와 위험/보상을 얻으려면 강력한 공급/수요 영역 내 또는 그 근처에서 거래를 시작하십시오. 손절매를 위한 최적의 장소는 어디입니까? 가장 안전하려면 강력한 수요/공급 구역 아래/위에 정
Graf Mason
Alexandr Lapin
5 (5)
Graf Mason is a tool that will make you a professional analyst! The method of determining wave movements using inclined channels qualitatively conveys the schematics of the movement of any instrument, showing not only possible reversals in the market, but also the goals of further movements!Destroys the myth that the market is alive , clearly showing the schematics of movements from one range to another! A professional tool, suitable for the medium term with the definition of the current trend!
Trend Pulse
Mohamed Hassan
5 (4)
Promotion   for   24 hours only   with a   40%   discount on the original price!  Please contact me after purchase to immediately get your PDF strategy + documentation for Trend Pulse !  Introducing Trend Pulse , a unique and robust indicator capable of detecting bullish, bearish, and even ranging trends! Trend Pulse uses a special algorithm to filter out market noise with real precision. If the current symbol is moving sideways, Trend Pulse will send you a ranging signal, letting you kno
제작자의 제품 더 보기
VR Smart Grid MT5
Vladimir Pastushak
4.32 (25)
VR Smart Grid는 적은 수익으로 다수의 시장 포지션을 부분적으로 청산할 수 있는 스마트 트레이딩 어드바이저입니다. 작은 부품을 닫으면 손실 위치를 빠르고 효율적으로 줄일 수 있습니다. 여러 가지 신중한 거래 전략이 고문의 알고리즘에 프로그래밍되어 있습니다. 주요 거래 전략은 포지션 네트워크를 구축하고 주어진 이익으로 작은 부분에서 포지션을 마감하는 것을 기반으로 합니다. 어드바이저는 시장 포지션을 분석하고 해당 로트를 여러 부분으로 나눕니다. 결과적으로 해당 포지션의 마감 부분에 대한 최소 평균 가격을 계산합니다. 이 접근 방식 덕분에 평균 가격은 현재 시장 가격에 최대한 가깝고 작은 가격 변동으로 인해 계산된 위치의 일부가 종료됩니다. set 파일, 지침, 멋진 보너스를 받으시려면 저한테 문자 하세요 어드바이저의 작업 모니터링은 저자 프로필 에서 확인하실 수 있습니다 VR Smart Grid Expert 어드바이저의 거래 전략에 프로그래밍된 시장 포지션을 청산하는 방법
VR Alert MT5
Vladimir Pastushak
5 (1)
지표의 형태로 만들어진 VR 경고 유틸리티는 특정 수준에 도달하는 가격이나 지표에 대해 상인에게 알리기 위해 가격 또는 기타 지표를 모니터링하도록 설계되었습니다. 신호 레벨은 수평뿐만 아니라 비스듬하게 설정할 수 있다. 따라서 거래자는 금융 분야에서 최신 도구를 얻을 수 있는 새로운 기회와 기회를 얻는다. 가상현실 알림 유틸리티 덕분에 더 이상 모니터 근처에 오래 앉아 있을 필요가 없다. 당신은 안전하게 당신의 가정 집안일에 대해 갈 수 있습니다, 작업 의무를 수행, 가족과 함께 시간을 보내고. 당신의 임무는 단순히 레벨을 설정하고 정보의 네 가지 방법 중 하나를 선택하는 것이다. 유틸리티는 스마트폰, 이메일로 알림을 보내고 표준 알림 창과 소리를 표시하며 그래프를 빨간색으로 칠할 수 있다. 유틸리티의 모든 제어는 차트의 마우스로 수행된다. 출시 당시 유틸리티는 차트에서 다른 지표에 대해 검사합니다. VR 경고의 감독하에 차트에 표시되는 부분이 있는 지표입니다. 추적할 수 있는 모
VR Lollipop
Vladimir Pastushak
4.6 (10)
수익을 키우는 것 은 트레이딩 로봇 VR 롤리팝 의 주요 전략입니다. 추세 방향으로 거래하고, 추세 방향으로 포지션을 추가하고, 포지션을 무손실로 전환하고, 가능한 한 빨리 손실을 줄이는 것이 VR 롤리팝의 거래 전략의 원칙이었습니다. 추세 방향 거래는 동적 추적 손절매 와 결합하여 모든 추세 움직임을 수집하는 가장 효과적인 방법입니다. 트레이딩 로봇은 실제 손절매 및 이익실현 레벨을 설정합니다.  설정, 설정 파일, 데모, 지침, 문제 해결은 [블로그] 에서 피드백 읽기 또는 쓰기 [링크] 버전 [MetaTrader 5] 트레이딩 로봇은 주기적으로 작동합니다. 사이클이란 프로그램이 시작되는 순간, 트레이딩 로봇이 이전에 개설한 포지션이 전혀 없거나 모든 포지션이 무손실로 전환된 순간, 모든 포지션이 청산되거나 무손실로 전환되는 순간을 말합니다. 트레이딩 로봇은 동일한 거래량의 두 포지션, 즉 매수 포지션과 매도 포지션으로 동시에 시장에 진입하여 사이클을 시작합니다. VR 롤
VR Locker MT5
Vladimir Pastushak
3.5 (4)
포렉스 전문가 조언자 VR Locker 는 포지티브 잠금을 사용하는 거래 네트워크를 기반으로 하는 자동 거래 전략입니다. 양의 자물쇠는 매도 포지션보다 매수 포지션보다 높고, 양쪽 포지션이 같은 로트로 열려 있는 경우의 거래 계좌 상황입니다. set 파일, 지침, 멋진 보너스를 받으시려면 저한테 문자 하세요 어드바이저의 작업 모니터링은 저자 프로필 에서 확인하실 수 있습니다 전문가 조언자는 EURUSD 통화 쌍을 위해 개발되었지만 다른 통화 및 금융 상품에 대해 작업할 수 있습니다. 조언자의 원리를 이해하려면 전략 테스터 또는 데모 계정으로 실행하기만 하면 됩니다. VR Locker 는 두 개의 시장 포지션을 동일한 양으로 반대 방향으로 엽니다. 가격이 어디로 가는지에 따라 어드바이저는 시작 위치를 '확장', 포지티브 잠금을 작성합니다. 위치 간 거리가 설정으로 지정된 거리 이상이 된 후 어드바이저는 새로운 성을 만드는 작업을 진행합니다. 자물쇠로 작업할 경우 고정되지 않은 이익
VR Black Box MT5
Vladimir Pastushak
1 (1)
EA VR Black Box는 – 엄격한 가격 추적에 바탕을 둔 강력한 무역 전략이다. 프로그램 알고리즘은 다음과 같은 상황에서 가격 움직임을 분석합니다: 가격이 상승할 때 EA가 금융 도구 구입을 위해 거래하는데; Stop Loss 포지션이 닫히면 거래가 역전되고 EA는 판매를 위해 거래를 계속합니다. 모든 거래는 트레이더의 개입 없이 자동으로 이루어집니다. 이 EA는 실제 폐쇄 포지션의 가격을 실제 Stop Loss 및 Take Profit 수준에서 능숙하게 숨길 수 있으며, 이는 중개인이 암거래를 사용할 경우 거래 수익성에 상당한 영향을 미칩니다. set 파일, 지침, 멋진 보너스를 받으시려면 저한테 문자 하세요 어드바이저의 작업 모니터링은 저자 프로필 에서 확인하실 수 있습니다 VR Black Box EA는 몇 년 동안 실제 계좌에서 거래하는 방식으로 개발되었습니다. 정기적인 업데이트, 새로운 아이디어 테스트, 지표별 거래 구현으로 인해 VR Black Box는 초보 트레
VR Donchian MT5
Vladimir Pastushak
4.87 (15)
VR Donchian 표시기는 Donchian 채널의 향상된 버전입니다. 개선 사항은 채널의 거의 모든 기능에 영향을 주었지만 주요 운영 알고리즘과 채널 구성은 그대로 유지되었습니다. 현재 추세에 따라 볼 표시기에 레벨 색상 변경이 추가되었습니다. 이는 거래자에게 추세 또는 플랫의 변화를 명확하게 보여줍니다. 스마트폰, 이메일 또는 MetaTrader 터미널 자체를 통해 두 채널 수준 중 하나의 돌파에 대해 거래자에게 알리는 기능이 추가되었습니다. 가격표가 추가되어 거래자가 차트에서 가격 수준을 볼 수 있습니다. 고전적인 Donchian 지표의 작동 알고리즘은 트레이더가 지표가 계산할 기간 수를 직접 설정할 수 있다는 사실로 인해 최적화되고 가속화되었습니다. 고전적인 Donchian 지표는 MetaTrader 터미널에서 사용할 수 있는 전체 내역을 계산하며, 이는 MetaTrader 터미널에 수학적 계산을 많이 로드합니다. VR Donchian 지표는 트레이더가 설정에 설정한 금액만
FREE
VR Calculate Martingale 지표는 위험 없이 모든 거래 전략을 사전 계산하기 위한 강력한 도구입니다. 지표가 가상 주문을 사용한다는 사실로 인해 거래자는 거래 계좌의 이벤트 진행 상황을 미리 계산할 수 있습니다. 더 이상 EXCEL 테이블과 계산기가 필요하지 않으며, 다양한 거래 로트의 다방향 포지션 평균을 구하는 공식을 알 필요도 없습니다. VR Calculate Martingale은 모든 것을 계산하는 데 도움이 됩니다. 설정, 세트 파일, 데모 버전, 지침, 문제 해결 등은 다음에서 얻을 수 있습니다. [블로그] 다음에서 리뷰를 읽거나 작성할 수 있습니다. [링크] 버전 [MetaTrader 4] 이 지표는 포지션 네트워크의 거래를 계산할 목적으로 2015년에 개발되었으며 현재 전 세계적으로 주요 업데이트를 받았습니다. 많은 리뷰와 제안 덕분에 지표가 개선되고 업데이트되었습니다. VR Calculate Martingale 계산기의 주요 기능 가상 주문 생
VR Smart Grid
Vladimir Pastushak
4.31 (166)
VR Smart Grid는 적은 수익으로 다수의 시장 포지션을 부분적으로 청산할 수 있는 스마트 트레이딩 어드바이저입니다. 작은 부품을 닫으면 손실 위치를 빠르고 효율적으로 줄일 수 있습니다. 여러 가지 신중한 거래 전략이 고문의 알고리즘에 프로그래밍되어 있습니다. 주요 거래 전략은 포지션 네트워크를 구축하고 주어진 이익으로 작은 부분에서 포지션을 마감하는 것을 기반으로 합니다. 어드바이저는 시장 포지션을 분석하고 해당 로트를 여러 부분으로 나눕니다. 결과적으로 해당 포지션의 마감 부분에 대한 최소 평균 가격을 계산합니다. 이 접근 방식 덕분에 평균 가격은 현재 시장 가격에 최대한 가깝고 작은 가격 변동으로 인해 계산된 위치의 일부가 종료됩니다. set 파일, 지침, 멋진 보너스를 받으시려면 저한테 문자 하세요 어드바이저의 작업 모니터링은 저자 프로필 에서 확인하실 수 있습니다 VR Smart Grid Expert 어드바이저의 거래 전략에 프로그래밍된 시장 포지션을 청산하는 방법
VR Sync Charts MT5
Vladimir Pastushak
5 (3)
VR Sync Charts는 창 간의 레이아웃을 동기화하는 유틸리티입니다. VR Sync Charts를 사용하여 추세 수준, 수평 수준, 피보나치 표시가 모든 차트와 동기화됩니다. 본 유틸리티를 사용하여 MetaTrader 터미널에서 모든 표준 그래픽 개체를 동기화할 수 있으며 모든 추세, Gann 라인 및 기타 개체가 인접 차트에 정확하게 복사됩니다. 더 이상 괘선과 표시를 수동으로 복사할 필요가 없습니다. 아래 그림과 비디오에서 VR Sync Charts 유틸리티의 작업을 보고 평가할 수 있습니다. 권장 사항: 모든 차트에 지표를 설정하기. 터미널 설정에서 «더블 클릭으로 개체 선택» 기능을 설정하기. 본 프로그램을 전략 시험에서 테스트할 수 없습니다. 아래 비디오를 보십시오. 혜택 모든 그래픽 개체를 동기화함. 모든 시간대와 차트 동기화 모든 업데이트는 무료입니다 초보자뿐만 아니라 전문 트레이더 모두에게 적합함 설정이 많지 않아 선택적으로 동기화를 할 수 있음. 모든 금융 상품
VR 컬러 레벨은 추세선, 직사각형, 텍스트 등의 요소를 사용하여 기술적 분석을 적용하는 사람들에게 편리한 도구입니다. 차트에 직접 텍스트를 추가하고 스크린샷을 찍는 것이 가능합니다. 설정, 세트 파일, 데모 버전, 지침, 문제 해결 등은 다음에서 얻을 수 있습니다. [블로그] 다음에서 리뷰를 읽거나 작성할 수 있습니다. [링크] 버전 [MetaTrader 4] 표시기 작업은 한 번의 클릭 으로 수행됩니다. 이렇게 하려면 선이 있는 버튼을 클릭하세요. 그러면 커서 아래에 추세선이 나타납니다. 그런 다음 커서를 움직여 선 위치 를 선택하고 다시 클릭하여 수정하면 됩니다. 표시기 의 특징은 스타일과 색상의 모든 변경 사항이 자동으로 저장되고 나중에 새로 생성된 모든 그래픽 개체에 적용된다는 것입니다. 이 지표에는 서로 다른 스타일의 추세선을 설정하기 위한 두 개의 독립 버튼, 서로 다른 스타일의 두 개의 독립 직사각형, 자체 스타일이 있는 하나의 텍스트 필드 및 스크린샷 생성용
FREE
VR Donchian
Vladimir Pastushak
4.85 (13)
VR Donchian 표시기는 Donchian 채널의 향상된 버전입니다. 개선 사항은 채널의 거의 모든 기능에 영향을 주었지만 주요 운영 알고리즘과 채널 구성은 그대로 유지되었습니다. 현재 추세에 따라 볼 표시기에 레벨 색상 변경이 추가되었습니다. 이는 거래자에게 추세 또는 플랫의 변화를 명확하게 보여줍니다. 스마트폰, 이메일 또는 MetaTrader 터미널 자체를 통해 두 채널 수준 중 하나의 돌파에 대해 거래자에게 알리는 기능이 추가되었습니다. 가격표가 추가되어 거래자가 차트에서 가격 수준을 볼 수 있습니다. 고전적인 Donchian 지표의 작동 알고리즘은 트레이더가 지표가 계산할 기간 수를 직접 설정할 수 있다는 사실로 인해 최적화되고 가속화되었습니다. 고전적인 Donchian 지표는 MetaTrader 터미널에서 사용할 수 있는 전체 내역을 계산하며, 이는 MetaTrader 터미널에 수학적 계산을 많이 로드합니다. VR Donchian 지표는 트레이더가 설정에 설정한 금액만
FREE
VR Locker
Vladimir Pastushak
4 (4)
포렉스 전문가 조언자 VR Locker 는 포지티브 잠금을 사용하는 거래 네트워크를 기반으로 하는 자동 거래 전략입니다. 양의 자물쇠는 매도 포지션보다 매수 포지션보다 높고, 양쪽 포지션이 같은 로트로 열려 있는 경우의 거래 계좌 상황입니다. set 파일, 지침, 멋진 보너스를 받으시려면 저한테 문자 하세요 어드바이저의 작업 모니터링은 저자 프로필 에서 확인하실 수 있습니다 전문가 조언자는 EURUSD 통화 쌍을 위해 개발되었지만 다른 통화 및 금융 상품에 대해 작업할 수 있습니다. 조언자의 원리를 이해하려면 전략 테스터 또는 데모 계정으로 실행하기만 하면 됩니다. VR Locker 는 두 개의 시장 포지션을 동일한 양으로 반대 방향으로 엽니다. 가격이 어디로 가는지에 따라 어드바이저는 시작 위치를 '확장', 포지티브 잠금을 작성합니다. 위치 간 거리가 설정으로 지정된 거리 이상이 된 후 어드바이저는 새로운 성을 만드는 작업을 진행합니다. 자물쇠로 작업할 경우 고정되지 않은 이익
VR Watch list and Linker MT5
Vladimir Pastushak
4.86 (7)
VR 감시 목록 및 링커 - 터미널용 스크리너 애플리케이션 메타트레이더 . 가장 흥미롭고 기술적인 금융 상품을 더 쉽게 찾을 수 있습니다. 이 스크리너는 bybit, Moscow Exchange, American Exchange, 외환 및 암호화폐 시장, 금속 시장 등의 거래소에서 트레이더가 거래하는 데 사용되며 소품 회사에서 거래하는 데 사용됩니다. 금융상품의 선택은 수동으로 수행됩니다. 스크리너는 MetaTrader 터미널의 오픈 차트를 연결하고, 금융상품 변경 시 각 차트의 데이터를 별도로 표시합니다. 설정, 파일 설정, 데모 버전, 지침, 문제 해결 등은 다음에서 얻을 수 있습니다. [블로그] 다음에서 리뷰를 읽거나 작성할 수 있습니다. [링크] 버전: [메타트레이더4] 스크리너를 사용하면 거래자가 가장 기술적인 금융 상품을 찾고 유동성이 낮고 위험이 높은 상품에 대한 거래를 제외하는 데 도움이 됩니다. 스크리너를 사용하면 티커가 포함된 시트를 쉽고 빠르게 생성 및 변
FREE
VR Assistant Charts MT5
Vladimir Pastushak
5 (3)
VR Assistant Charts — 이는 MetaTrader 거래 터미널 창에서 그래픽 개체로 작업하는 거래자를 위한 편리한 도구입니다. 이 프로그램을 사용하면 한 번의 마우스 클릭으로 MetaTrader 터미널에서 추세선, 피보나치 수준, Gann 팬 및 기타 그래픽 요소의 색상, 스타일, 두께 및 기타 특성을 변경할 수 있습니다. 설정, 세트 파일, 데모 버전, 지침, 문제 해결 등은 다음에서 얻을 수 있습니다. [블로그] 다음에서 리뷰를 읽거나 작성할 수 있습니다. [링크] 버전 [MetaTrader 4] 이 유틸리티는 그래픽 개체를 사용하여 금융 상품을 분석할 때 거래자의 단조로운 작업을 크게 촉진합니다. 모든 작업은 차트에서 직접 컴퓨터 마우스를 사용하여 수행됩니다. 이 프로그램은 MetaTrader 4 및 MetaTrader 5 거래 플랫폼에 대한 기술 지표 형태로 구현되므로 다른 지표, 조언자 및 스크립트와 동시에 사용할 수 있습니다. 제어는 컴퓨터 마우스를
FREE
VR Ticks MT5
Vladimir Pastushak
4.33 (3)
VR Ticks는   스캘핑 기반 전략에 대한 특별한 지표입니다. 이 지표 덕분에 거래자는 금융상품의 메인 차트에서 직접 틱 차트를 볼 수 있습니다. 틱 차트를 사용하면 가능한 한 정확하게 시장에 포지션을 입력하거나 시장에서 포지션을 청산할 수 있습니다. VR Ticks는 방향에 따라 색상이 변하는 선 형태로 진드기 데이터를 표시합니다. 이를 통해 진드기의 상황을 시각적으로 이해하고 평가할 수 있습니다. 틱 차트의 장점은 기간을 고려하지 않고 가격 변동을 기반으로 작성된다는 것입니다. VR Ticks는 가능한 가장 최소한의 차트를 구축합니다. 설정, 세트 파일, 데모 버전, 지침, 문제 해결 등은   [블로그]   에서 확인할 수 있습니다. [링크]   에서 리뷰를 읽거나 작성할 수 있습니다. [MetaTrader 4]   용 버전 틱은 하나의 가격 변동입니다. 한 번의 가격 변동에 대해 가격은 하나 또는 여러 포인트만큼 변경될 수 있습니다.   진드기가 움직임이라는   것을 이
FREE
VR Calculate Martingale
Vladimir Pastushak
5 (5)
VR Calculate Martingale 지표는 위험 없이 모든 거래 전략을 사전 계산하기 위한 강력한 도구입니다. 지표가 가상 주문을 사용한다는 사실로 인해 거래자는 거래 계좌의 이벤트 진행 상황을 미리 계산할 수 있습니다. 더 이상 EXCEL 테이블과 계산기가 필요하지 않으며, 다양한 거래 로트의 다방향 포지션 평균을 구하는 공식을 알 필요도 없습니다. VR Calculate Martingale은 모든 것을 계산하는 데 도움이 됩니다. 설정, 세트 파일, 데모 버전, 지침, 문제 해결 등은 다음에서 얻을 수 있습니다. [블로그] 다음에서 리뷰를 읽거나 작성할 수 있습니다. [링크] 버전 [MetaTrader 5] 이 지표는 포지션 네트워크의 거래를 계산할 목적으로 2015년에 개발되었으며 현재 전 세계적으로 주요 업데이트를 받았습니다. 많은 리뷰와 제안 덕분에 지표가 개선되고 업데이트되었습니다. VR Calculate Martingale 계산기의 주요 기능 가상 주문 생
VR Grid Mt5
Vladimir Pastushak
3.43 (7)
VR 그리드 표시기는 사용자 정의 설정으로 그래픽 그리드를 생성하도록 설계 되었습니다. 표준 그리드 와 달리 VR 그리드는 원형 레벨 을 구축하는 데 사용됩니다. 사용자의 선택에 따라 라운드 수준 사이의 단계는 임의적일 수 있습니다. 또한 VR Grid는 다른 인디케이터나 유틸리티와는 달리 기간이 바뀌거나 단말기를 재부팅해도 그리드의 위치 를 유지합니다. 설정, 세트 파일, 데모 버전, 지침, 문제 해결 등은 다음에서 얻을 수 있습니다. [블로그] 다음에서 리뷰를 읽거나 작성할 수 있습니다. [링크] 버전 [MetaTrader 4] 수직 수준 은 실제 시간 간격을 기준으로 하며 누락 또는 존재하지 않는 기간은 무시 합니다. 따라서 레벨 사이의 단계는 사용자가 선택한 값과 엄격하게 일치합니다. VR 그리드 표시기를 사용할 때 트레이더는 모든 수준에서 스타일 , 수직선 및 수평선의 색상 및 두께를 변경할 수 있습니다. 이를 통해 금융 상품의 라운드 수준 을 제어할 수 있습니다.
FREE
VR Black Box
Vladimir Pastushak
3.67 (3)
EA VR Black Box는 – 엄격한 가격 추적에 바탕을 둔 강력한 무역 전략이다. 프로그램 알고리즘은 다음과 같은 상황에서 가격 움직임을 분석합니다: 가격이 상승할 때 EA가 금융 도구 구입을 위해 거래하는데; Stop Loss 포지션이 닫히면 거래가 역전되고 EA는 판매를 위해 거래를 계속합니다. 모든 거래는 트레이더의 개입 없이 자동으로 이루어집니다. 이 EA는 실제 폐쇄 포지션의 가격을 실제 Stop Loss 및 Take Profit 수준에서 능숙하게 숨길 수 있으며, 이는 중개인이 암거래를 사용할 경우 거래 수익성에 상당한 영향을 미칩니다. set 파일, 지침, 멋진 보너스를 받으시려면 저한테 문자 하세요 어드바이저의 작업 모니터링은 저자 프로필 에서 확인하실 수 있습니다 VR Black Box EA는 몇 년 동안 실제 계좌에서 거래하는 방식으로 개발되었습니다. 정기적인 업데이트, 새로운 아이디어 테스트, 지표별 거래 구현으로 인해 VR Black Box는 초보 트레
VR Watch list and Linker
Vladimir Pastushak
4.63 (8)
VR 감시 목록 및 링커 - 터미널용 스크리너 애플리케이션 메타트레이더 . 가장 흥미롭고 기술적인 금융 상품을 더 쉽게 찾을 수 있습니다. 이 스크리너는 bybit, Moscow Exchange, American Exchange, 외환 및 암호화폐 시장, 금속 시장 등의 거래소에서 트레이더가 거래하는 데 사용되며 소품 회사에서 거래하는 데 사용됩니다. 금융상품의 선택은 수동으로 수행됩니다. 스크리너는 MetaTrader 터미널의 오픈 차트를 연결하고, 금융상품 변경 시 각 차트의 데이터를 별도로 표시합니다. 설정, 파일 설정, 데모 버전, 지침, 문제 해결 등은 다음에서 얻을 수 있습니다. [블로그] 다음에서 리뷰를 읽거나 작성할 수 있습니다. [링크] 버전: [메타트레이더5] 스크리너를 사용하면 거래자가 가장 기술적인 금융 상품을 찾고 유동성이 낮고 위험이 높은 상품에 대한 거래를 제외하는 데 도움이 됩니다. 스크리너를 사용하면 티커가 포함된 시트를 쉽고 빠르게 생성 및 변
FREE
VR Assistant Charts — 이는 MetaTrader 거래 터미널 창에서 그래픽 개체로 작업하는 거래자를 위한 편리한 도구입니다. 이 프로그램을 사용하면 한 번의 마우스 클릭으로 MetaTrader 터미널에서 추세선, 피보나치 수준, Gann 팬 및 기타 그래픽 요소의 색상, 스타일, 두께 및 기타 특성을 변경할 수 있습니다. 설정, 세트 파일, 데모 버전, 지침, 문제 해결 등은 다음에서 얻을 수 있습니다. [블로그] 다음에서 리뷰를 읽거나 작성할 수 있습니다. [링크] 버전 [MetaTrader 5] 이 유틸리티는 그래픽 개체를 사용하여 금융 상품을 분석할 때 거래자의 단조로운 작업을 크게 촉진합니다. 모든 작업은 차트에서 직접 컴퓨터 마우스를 사용하여 수행됩니다. 이 프로그램은 MetaTrader 4 및 MetaTrader 5 거래 플랫폼에 대한 기술 지표 형태로 구현되므로 다른 지표, 조언자 및 스크립트와 동시에 사용할 수 있습니다. 제어는 컴퓨터 마우스를
FREE
VR Grid
Vladimir Pastushak
5 (2)
VR 그리드 표시기는 사용자 정의 설정으로 그래픽 그리드를 생성하도록 설계 되었습니다. 표준 그리드 와 달리 VR 그리드는 원형 레벨 을 구축하는 데 사용됩니다. 사용자의 선택에 따라 라운드 수준 사이의 단계는 임의적일 수 있습니다. 또한 VR Grid는 다른 인디케이터나 유틸리티와는 달리 기간이 바뀌거나 단말기를 재부팅해도 그리드의 위치 를 유지합니다. 설정, 세트 파일, 데모 버전, 지침, 문제 해결 등은 다음에서 얻을 수 있습니다. [블로그] 다음에서 리뷰를 읽거나 작성할 수 있습니다. [링크] 버전 [MetaTrader 5] 수직 수준 은 실제 시간 간격을 기준으로 하며 누락 또는 존재하지 않는 기간은 무시 합니다. 따라서 레벨 사이의 단계는 사용자가 선택한 값과 엄격하게 일치합니다. VR 그리드 표시기를 사용할 때 트레이더는 모든 수준에서 스타일 , 수직선 및 수평선의 색상 및 두께를 변경할 수 있습니다. 이를 통해 금융 상품의 라운드 수준 을 제어할 수 있습니다.
FREE
VR Sync Charts
Vladimir Pastushak
5 (6)
VR Sync Charts는 창 간의 레이아웃을 동기화하는 유틸리티입니다. VR Sync Charts를 사용하여 추세 수준, 수평 수준, 피보나치 표시가 모든 차트와 동기화됩니다. 본 유틸리티를 사용하여 MetaTrader 터미널에서 모든 표준 그래픽 개체를 동기화할 수 있으며 모든 추세, Gann 라인 및 기타 개체가 인접 차트에 정확하게 복사됩니다. 더 이상 괘선과 표시를 수동으로 복사할 필요가 없습니다. 아래 그림과 비디오에서 VR Sync Charts 유틸리티의 작업을 보고 평가할 수 있습니다. 권장 사항: 모든 차트에 지표를 설정하기. 터미널 설정에서 «더블 클릭으로 개체 선택» 기능을 설정하기. 본 프로그램을 전략 시험에서 테스트할 수 없습니다. 아래 비디오를 보십시오. 혜택 모든 그래픽 개체를 동기화함. 모든 시간대와 차트 동기화 모든 업데이트는 무료입니다 초보자뿐만 아니라 전문 트레이더 모두에게 적합함 설정이 많지 않아 선택적으로 동기화를 할 수 있음. 모든 금융 상품
VR ATR Pro
Vladimir Pastushak
4.33 (6)
가상현실 ATR Pro 지표는 금융 상품의 목표 수준을 결정하는 강력한 전문 도구이다. 지표의 효과는 실제 및 데모 계정에 대한 수천 가지 테스트를 통해 입증되었다. 실제 실제 통계를 사용하여 실제 데이터로 구동되는 가상현실 ATR Pro 지표. 통계는 고집스러운 것이며, 수학적 계산에서 실제 통계를 사용하면 금융 상품의 정확한 목표 수준을 계산할 수 있다. set 파일, 지침, 멋진 보너스를 받으시려면 저한테 문자 하세요 장점 지표에는 여러 가지 장점이 있으며 다음은 그 중 몇 가지입니다. 지표의 높은 정확도 초자연적 띠는 계산에서 제외할 수 있습니다. 차트 상에 직접 목표 수준을 단순히 표시하는 것. 모든 금융 상품(Forex, Metals, CFD, Futures, Crypto)과 함께 작동합니다. 그것은 변경되지 않으며, 그 해석을 지속적으로 저장합니다. Stop Loss 및 Take Profit 수준을 결정하는 데 효과적입니다. 스마트폰 알림, 이메일 및 MetaTrader
VR 템플릿 스위처는 메타트레이더 터미널에서 차트 템플릿 작업을 할 수 있는 강력한 유틸리티입니다. 이제는 템플릿을 업로드, 저장 및 삭제하기 위해 많은 작업을 할 필요가 없습니다. VR 템플릿 스위처 유틸리티를 사용하면 모든 지표, 레벨 및 설정으로 현재 차트 템플릿을 저장하고 한 번의 클릭으로 다른 차트 템플릿을 로드할 수 있습니다. 다른 금융 상품에 대한 템플릿이 있으십니까? VR 템플릿 스위처는 템플릿을 로드할 때 필요한 기간과 금융 상품을 설정합니다. VR 템플릿 스위처에서는 다음과 같은 추가 기능이 제공됩니다. 차트 템플릿을 자동 저장 템플릿의 백업용 사본 생성 PC의 다른 메타트레이더 터미널과 차트 템플릿 동기화 차트 템플릿 변경 시, 새 템플릿뿐만 아니라 차트의 기간 및 금융 상품 즉시 변경 유틸리티는 템플릿의 모든 설정, 지표 및 변경 사항을 저장합니다. 템플릿을 로드하면 모든 것이 복원됩니다. 이는 차트 템플릿이 녹색으로 저장된 경우, 이 차트를 로드 할 때 VR
VR Close Orders MT5
Vladimir Pastushak
1 (1)
The VR Close orders script is designed to close positions in the terminal at a profit or loss mark set by the trader. The program is written as a script and can work together on the same chart with any other indicators and expert advisors. The program has a simple visual panel and is easy to configure with the mouse. With this program's help, the trader can automatically close positions and delete orders depending on the conditions set.  There is often a situation when you need to close position
FREE
VR 컬러 레벨은 추세선, 직사각형, 텍스트 등의 요소를 사용하여 기술적 분석을 적용하는 사람들에게 편리한 도구입니다. 차트에 직접 텍스트를 추가하고 스크린샷을 찍는 것이 가능합니다. 설정, 세트 파일, 데모 버전, 지침, 문제 해결 등은 다음에서 얻을 수 있습니다. [블로그] 다음에서 리뷰를 읽거나 작성할 수 있습니다. [링크] 버전 [MetaTrader 5] 표시기 작업은 한 번의 클릭 으로 수행됩니다. 이렇게 하려면 선이 있는 버튼을 클릭하세요. 그러면 커서 아래에 추세선이 나타납니다. 그런 다음 커서를 움직여 선 위치 를 선택하고 다시 클릭하여 수정하면 됩니다. 표시기 의 특징은 스타일과 색상의 모든 변경 사항이 자동으로 저장되고 나중에 새로 생성된 모든 그래픽 개체에 적용된다는 것입니다. 이 지표에는 서로 다른 스타일의 추세선을 설정하기 위한 두 개의 독립 버튼, 서로 다른 스타일의 두 개의 독립 직사각형, 자체 스타일이 있는 하나의 텍스트 필드 및 스크린샷 생성용
FREE
VR Ticks
Vladimir Pastushak
VR Ticks는 스캘핑 기반 전략에 대한 특별한 지표입니다. 이 지표 덕분에 거래자는 금융상품의 메인 차트에서 직접 틱 차트를 볼 수 있습니다. 틱 차트를 사용하면 가능한 한 정확하게 시장에 포지션을 입력하거나 시장에서 포지션을 청산할 수 있습니다. VR Ticks는 방향에 따라 색상이 변하는 선 형태로 진드기 데이터를 표시합니다. 이를 통해 진드기의 상황을 시각적으로 이해하고 평가할 수 있습니다. 틱 차트의 장점은 기간을 고려하지 않고 가격 변동을 기반으로 작성된다는 것입니다. VR Ticks는 가능한 가장 최소한의 차트를 구축합니다. 설정, 세트 파일, 데모 버전, 지침, 문제 해결 등은 [블로그] 에서 확인할 수 있습니다. [링크] 에서 리뷰를 읽거나 작성할 수 있습니다. [MetaTrader 5] 용 버전 틱은 하나의 가격 변동입니다. 한 번의 가격 변동에 대해 가격은 하나 또는 여러 포인트만큼 변경될 수 있습니다. 진드기가 움직임이라는 것을 이해하는 것이 중요합니다.
FREE
VR Close Orders
Vladimir Pastushak
3.5 (4)
The VR Close orders script is designed to close positions in the terminal at a profit or loss mark set by the trader. The program is written as a script and can work together on the same chart with any other indicators and expert advisors. The program has a simple visual panel and is easy to configure with the mouse. With this program's help, the trader can automatically close positions and delete orders depending on the conditions set.  There is often a situation when you need to close position
FREE
VR Orders History
Vladimir Pastushak
5 (3)
The VR Orders History script is designed to upload a trade report to a csv file. This format is intended for additional analysis of trading history in programs such as EXCEL, Openoffice, and Libreoffice. Thanks to the script, it is now much easier for a trader to analyze their trading history. The program facilitates the analysis of the trading history for the MetaTrader 5 terminal. The trader sees structured trading. The entire report is based on the following principle: Position > Order on the
FREE
The VR Object Delete All script solves the problem of garbage on the chart. it is often necessary to completely clear the chart of everything that is put on it, comments, lines, objects. The script completely deletes everything, even those objects that are not visible. When working, VR Object Delete All writes everything it does in the terminal log, as well as the names of objects to delete. Displays the number of deleted objects as a separate line. in case of any errors, it will display an erro
FREE
필터:
GoodMorningg
529
GoodMorningg 2023.04.08 20:40 
 

사용자가 평가에 대한 코멘트를 남기지 않았습니다

Makarios  Yacoubian
2911
Makarios Yacoubian 2021.06.01 17:19 
 

사용자가 평가에 대한 코멘트를 남기지 않았습니다

Vladimir Pastushak
95435
개발자의 답변 Vladimir Pastushak 2021.06.01 17:41
Thank!
fcg554
24
fcg554 2021.05.03 20:40 
 

사용자가 평가에 대한 코멘트를 남기지 않았습니다

Vladimir Pastushak
95435
개발자의 답변 Vladimir Pastushak 2021.06.01 17:42
Thank!
Postoylec
14
Postoylec 2021.04.16 23:50 
 

사용자가 평가에 대한 코멘트를 남기지 않았습니다

Vladimir Pastushak
95435
개발자의 답변 Vladimir Pastushak 2021.06.01 17:42
Спасибо!
varon
503
varon 2021.03.24 20:21 
 

사용자가 평가에 대한 코멘트를 남기지 않았습니다

Vladimir Pastushak
95435
개발자의 답변 Vladimir Pastushak 2021.03.24 20:42
Thank!
AskarSar
14
AskarSar 2021.03.24 14:01 
 

사용자가 평가에 대한 코멘트를 남기지 않았습니다

Vladimir Pastushak
95435
개발자의 답변 Vladimir Pastushak 2021.03.24 20:42
Спасибо!
리뷰 답변
버전 23.20 2023.02.13
Increased the speed of the indicator;
Added the ability to select the type of price display. It can be text, or an icon;
버전 21.80 2021.08.17
The program is compiled in the latest version of the MetaTrader terminal