Market analysis dashboard MT5
- 지표
- Jan Flodin
- 버전: 1.4
- 업데이트됨: 19 11월 2023
- 활성화: 10
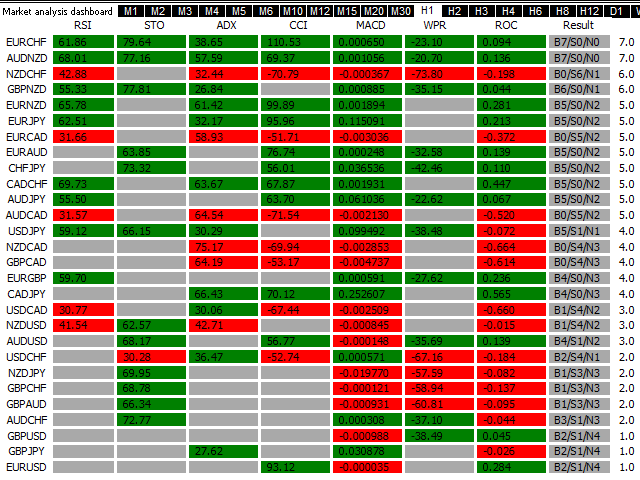
이 다중 기호 대시보드 지표는 강력한 추세가 식별되면 경고를 보낼 수 있습니다. RSI, Stochastics, ADX, CCI, MACD, WPR(Williams Percent Range, Williams %R이라고도 함), ROC(Price 변화율) 및 얼티밋 오실레이터. M1에서 MN까지 모든 시간 프레임과 함께 사용할 수 있습니다(한 번에 1개의 시간 프레임만 표시할 수 있음). 모멘텀, 변동성, 과매수/과매도 등에 대한 관점을 제공합니다. 자신의 규칙 및 기술과 결합하여 이 지표를 사용하면 자신만의 강력한 시스템을 생성(또는 향상)할 수 있습니다.
특징
- 버튼을 클릭하여 시간 프레임을 전환할 수 있습니다.
- 대시보드 내에서 추세 강도 순위 정렬을 지속적으로 수행합니다. 특정 기호를 쉽게 찾을 수 있도록 정렬을 비활성화할 수 있습니다. 그런 다음 기호는 기호 입력 매개변수에 입력한 것과 동일한 순서로 표시되거나 종합시세 창에 표시되는 순서로 표시됩니다.
- 사각형 내부를 클릭하면 해당 기호와 시간 프레임이 포함된 새 차트가 열립니다.
하나의 차트에 표시기를 배치하는 것으로 충분하며 선택한 기호의 화면 경고를 받게 됩니다. 아래 첫 번째 스크린샷에서 볼 수 있는 마지막 결과 열에는 예를 들어 'B3/S2/N1'과 같은 값이 표시됩니다. 이것은 3개의 매수(B) 신호, 2개의 매도(S) 신호 및 1개의 중립(N) 신호를 의미합니다. 중립 신호는 일부 지표의 값이 중간 영역(예: RSI의 경우 50) 또는 과매도/과매도 영역에 있을 때 생성됩니다. 더 많은 정보는 블로그 .
입력 매개변수
여기에서 입력 매개변수에 대한 설명과 설명을 찾으십시오.
중요한
지표는 대시보드를 방해할 수 있는 다른 지표나 Expert Advisors가 없는 깨끗한(빈) 차트인 M5 차트에 배치해야 합니다. 이 지표는 전략 테스터에서 지원되지 않습니다.