Volume Zone Range MT4
- 지표
- Piotr Stepien
- 버전: 1.0
- 활성화: 5
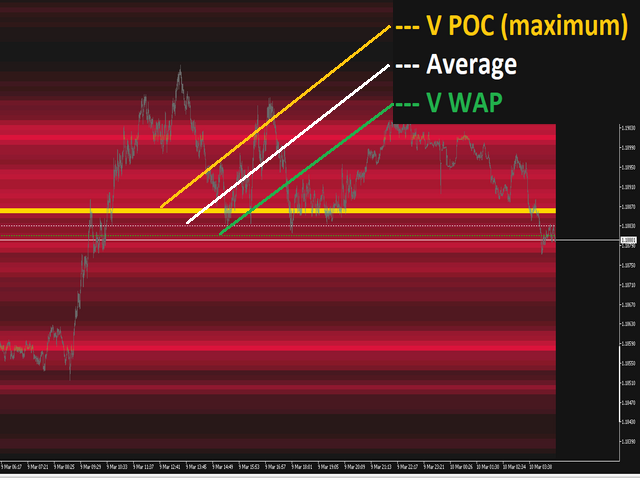
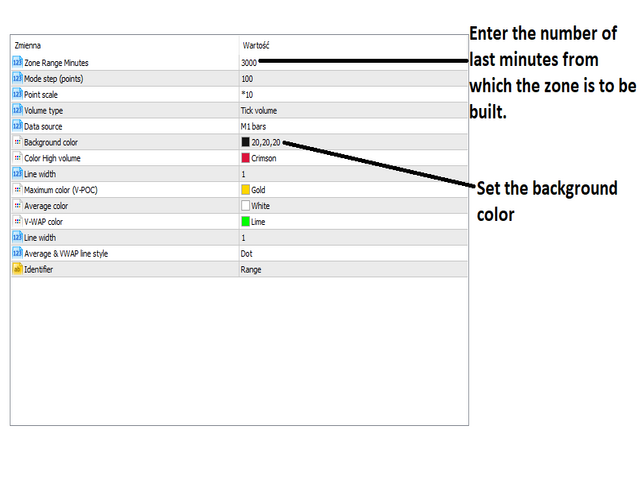
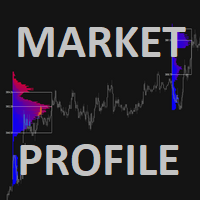
This indicator shows the high volume zone. From the last minutes that you set yourself, the image of the volume zone is generated on an ongoing basis.
The indicator also shows the V-Poc, Average Volumen and V-WAP lines.
if you are using high intervals you must enter a large number of minutes.
the zone builds itself up as the chart moves.
if you want to build a zone from:
last day - 1440 minutes,
last week - 10080 minutes,
... etc.
If you need an indicator that shows the constant volume zone time frames there is ...HERE...
Volume Zone is an advanced charting study that displays trading activity over a specified time period at specified price levels.The study (accounting for user defined parameters such as number of rows and time period) plots a histogram on the chart meant to reveal dominant and/or significant price levels based on volume. Essentially,Volume Zone takes the total volume traded at a specific price level during the specified time period and divides the total volume into either buy volume or sell volume and then makes that information easily visible to the trader.
Support and Resistance Levels
The first thing that most traders will use volume Zone for is identifying basic support and resistance levels. It is important to note that using Volume Zone as an identifier for support and resistance levels is a reactive method. This means that unlike proactive methods (such as trend lines and moving averages) which are based on current price action and analysis to predict future price movements, reactive methods rely on past price movements and volume behavior. Reactive methods can be useful in applying meaning or significance to price levels where the market has already visited. Basic technical analysis has shown that a support level is a price level which will support a price on its way down and a resistance level is a price level which will resist price on its way up. Therefore, one can conclude that a price level near the bottom of the Zone which heavily favors the buy side in terms of volume is a good indication of a support level. The opposite is also true. A price level near the top of the Zone which heavily favors sell side volume is a good indication of a resistance level.

