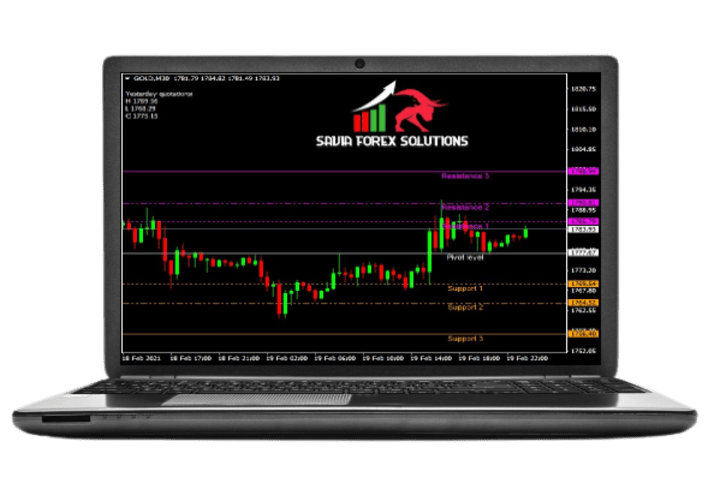
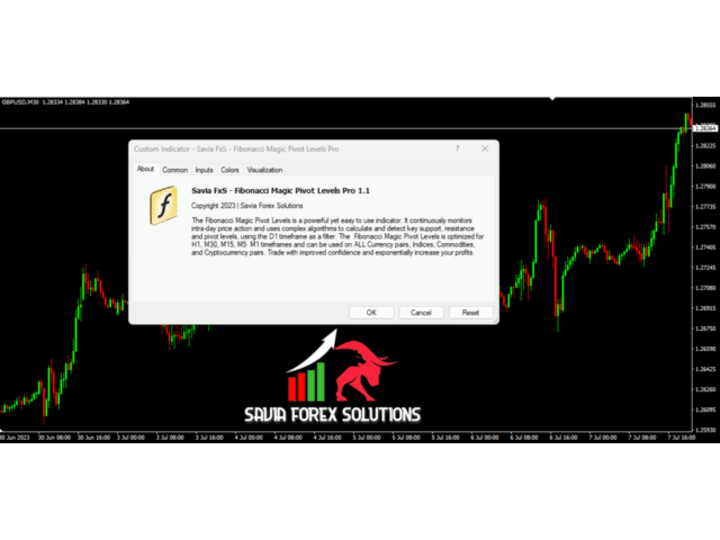
Fibonacci Magic Pivot Levels
- 지표
- Savia Forex Software Solutions
- 버전: 1.2
- 업데이트됨: 24 7월 2023
- 활성화: 10
Fibonacci Magic Pivot Levels
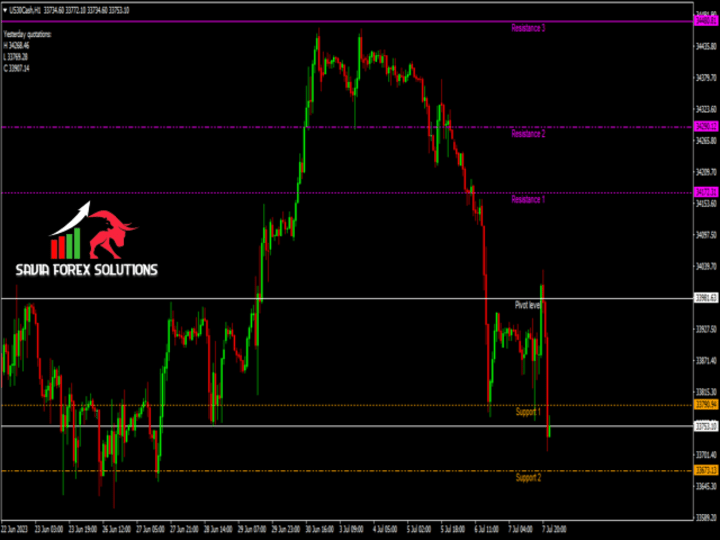
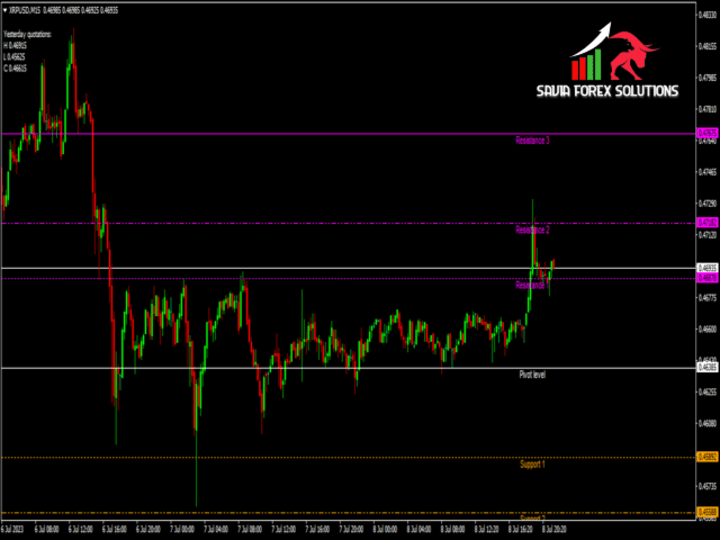
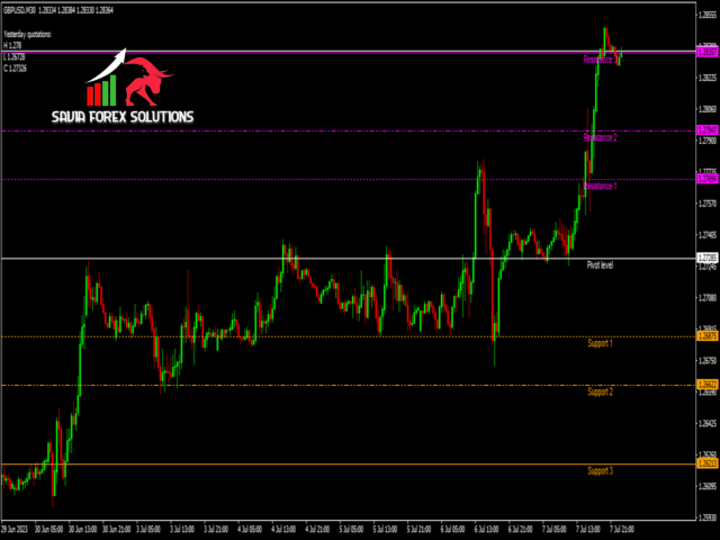
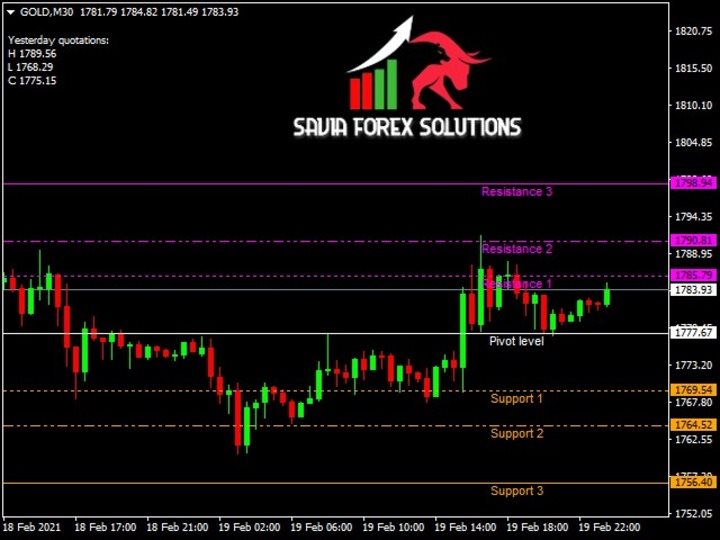
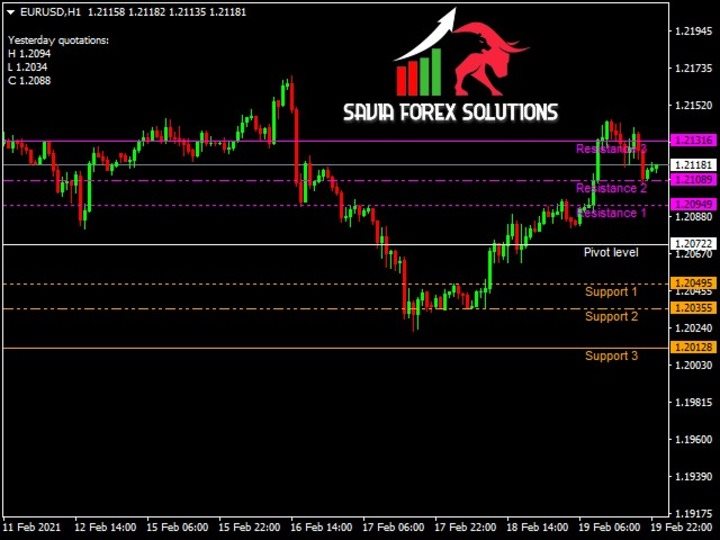
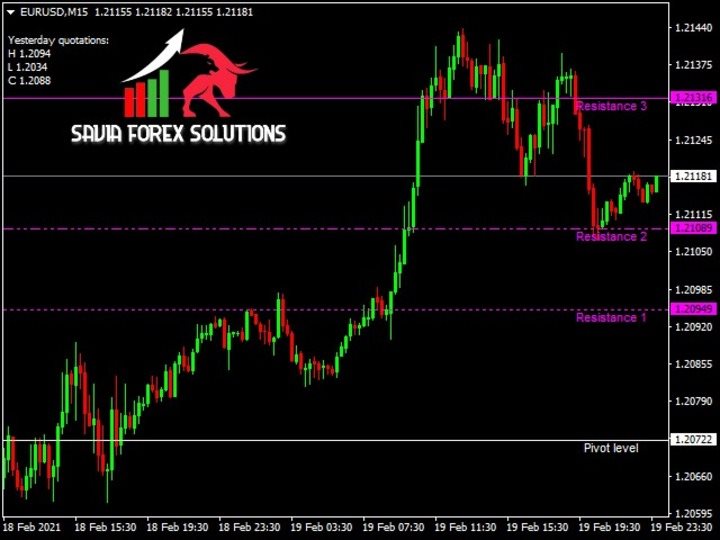
The Fibonacci Magic Pivot Levels is a powerful yet easy to use indicator. It continuously monitors intra-day price action and uses complex algorithms to calculate and detect key support, resistance and pivot levels, using the D1 timeframe as a filter. The Fibonacci Magic Pivot Levels is optimized for H4, H1, M30, M15, M5 & M1 timeframes and can be used on ALL Currencies, Indices, Commodities, and Cryptocurrency pairs. Trade with improved confidence and maximize your success rate.
Benefits
- FMPL works with any asset. It can be used on currencies, indices, commodities and stocks using the MT4 platform.
- Optimized for all chart timeframes. It is best viewed oon the H1 and lower timeframes.
- Provides signals for any direction. Whether price action is in an uptrend, downtrend or trading sideways, FMPL is always consistent.
- User friendly and suitable for beginners and experts. FMPL is a simple drag-and-drop indicator, and if you understand the basic theory of Fibonacci levels and trading strategies, this tool becomes that much more powerful
How to use
- Buy/Rent and install the indicator in your MT4 terminal.
- Select, drag and drop the indicator onto any chart.
- Adjust the colour settings of the various magic pivot levels as you wish.
- That's it! Let FMPL show you its power and reveal the magic pivot levels; The rest is up to you to use your trading knowledge and experience to maximize your success rate.
Disclaimer
Forex and synthetic indices trading involves risk. Carefully consider your investment objectives, level of experience and risk appetite. Most importantly, do not invest money you cannot afford to lose.
None of the information contained herein are a recommendation or financial advice in any meaning whatsoever, also in the meaning of any trading act or law. I am not accountable for your trading in any way.
Under no circumstance will we provide refunds for our EA's (Robots), Indicators and other software and trading tools purchased from us.