IndicateMe MT4
- 지표
- Dani Cyril Bakkum
- 버전: 1.0
- 활성화: 5
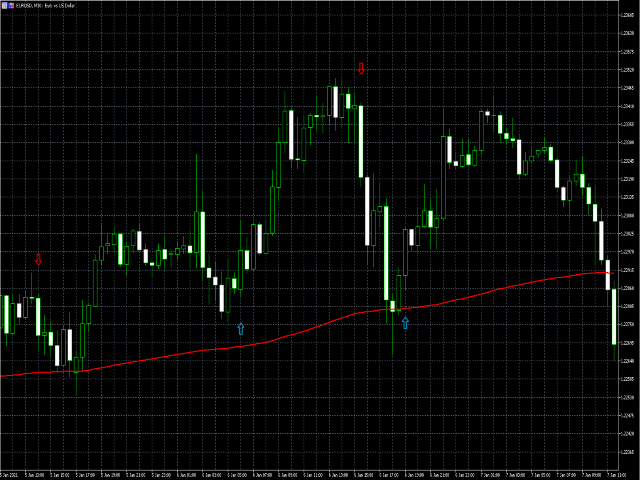
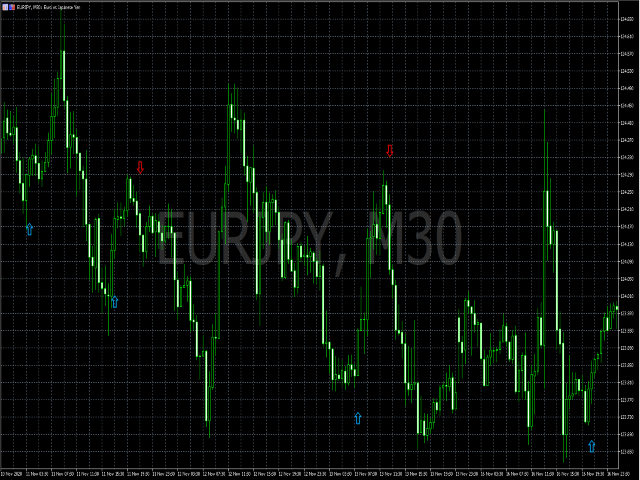
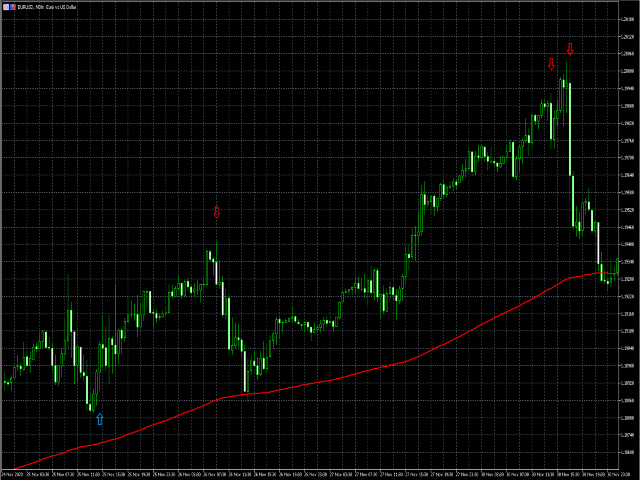
The IndicateMe indicator has been specially created to remove as much noise as possible from the signals it gives.
The indicator has been combined with several other well-known indicators. Indicators that have been used: "Moving average, stocastic indicator, relative strenght index, moving".
All indicators that are used can be adjusted by yourself. The default settings are set to the values I like to use.
Easily set alerts to always stay informed of the indicator's signals.
Important: this indicator works on a 30m chart timeframe.

Good indicator. I wish it work on smaller timeframes.