RSI Alarm Osw MT4
- 지표
- William Oswaldo Mayorga Urduy
- 버전: 1.30
- 업데이트됨: 22 10월 2021
- 활성화: 5
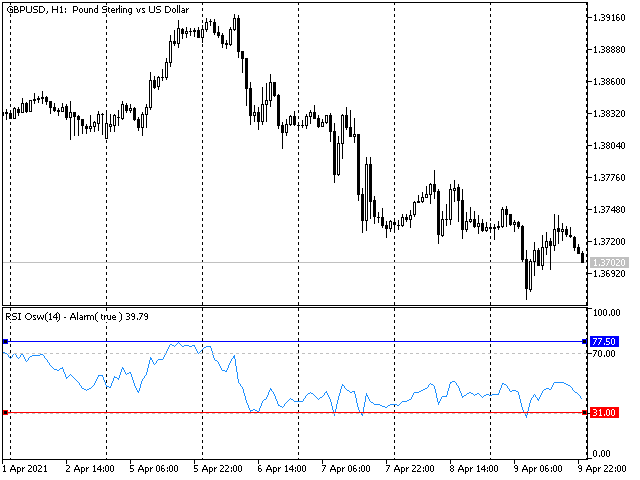
RSI ALARM (For Metatrader 4)
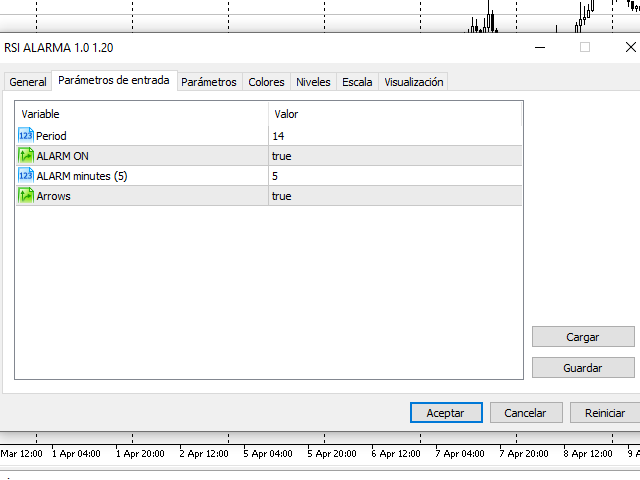
This indicator works like a normal RSI with all its settings (Periodicity, colors, levels, etc),
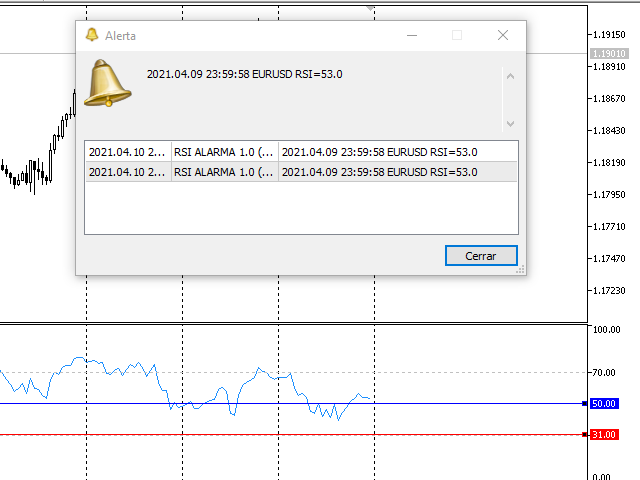
but additionally, alarms can be set in the upper and lower level (Example 70 and 30), with the possibility of adjusting these levels by moving the upper and lower lines found on the indicator.
You can also activate and deactivate an additional function that puts an arrow on the chart when the expected upper or lower RSI is met.