• 미리보기
  • 리뷰
  • 코멘트 (1)

MA and DSS Oscillator

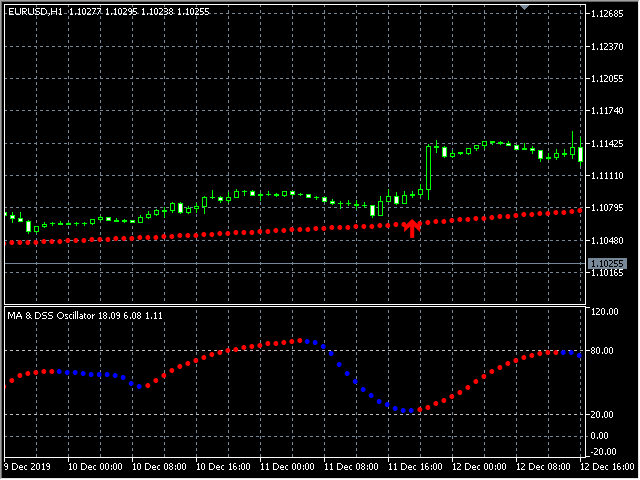
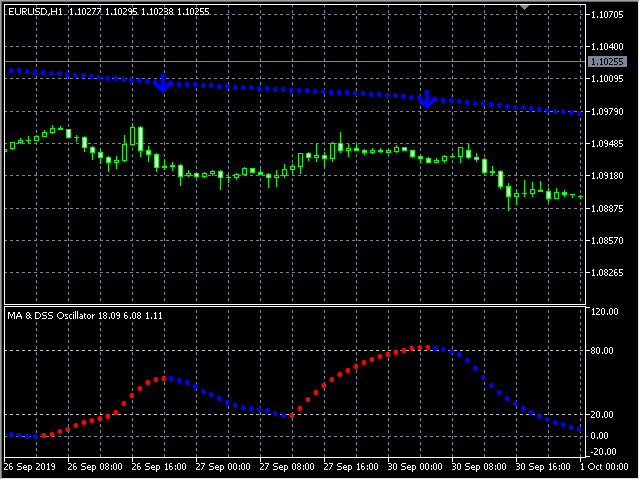
MA & DSS Oscillator is a simple system that overcomes all the market confusion by looking at the Moving Average and Double Smoothed Stochastic Oscillator. A Signal is made when the Oscillator is under 50 (A default value) and heading in same direction as the Moving Average.

The moving average is arguably the simplest but most effective tool when trading larger timeframes. We use this and the Double Smoothed Stochastic Oscillator to time our market entry.

Double Smoothed Stochastic is similar to Stochastic except for this Indicator we use what is called double exponentially smoothing.

This will give the trader a more speedy response to price changes which tends to smooth out the erratic movements of a regular Stochastic.

For those who want to know the Double Smoothed Stochastic Calculation is : 
 
DSS = EMA(r) (X - Lxn / Hxn - Lxn) x 100 
MIT = EMA(r) (close - Ln / Hn - Ln) x 100

Ln = lowest low of n periods
Hn = highest high of n periods
Lxn = lowest low of the price series X of n - periods
Hxn = highest high of the price series X of n - periods

X = latest price of the price series X

Features :

  • A method of simplifying a sometimes confusing market
  • Choose your favourite colors and size of Line and Arrow
  • Send alerts to either your PC, eMail or mobile device
  • Can be traded on any market and timeframe 
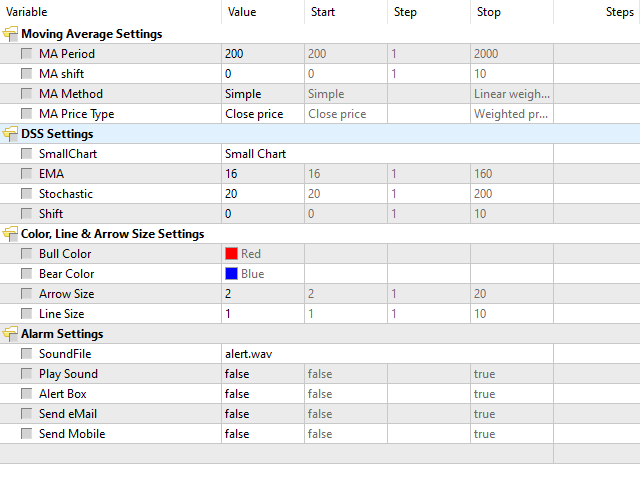
Settings : 

Moving Average 

  • MA Period - Sets the period of the moving average. Recommended at 200.
  • MA Method - Sets the method of calculation for moving average. EG 0 = SMA, 1 = EMA, 2 = SMMA, 3 = LWMA
  • MA Price Type - Sets the type of price we base our calculation on : PRICE_CLOSE, PRICE_OPEN, PRICE_HIGH, PRICE_LOW, PRICE_MEDIAN, PRICE_TYPICAL, PRICE_WEIGHTED
  • MA Smoothness - We compare a current bar the moving average is based on to the previous bar. The further back we go the more smooth the moving average direction becomes. EG 20 for smooth, 1 for choppy.
  • Point Differential For Trend Strength - Here we can set how many points of difference between the current and previous of moving average. The more points the stronger the trend must be before we get a signal.

Double Smooth Stochastic

  • EMA - EMA settings
  • Stochastic - Stochastic Settings 
  • Shift - Shift value of bar calculation is based

Color Line & Arrow

  • Bull Color - Sets the color of bull arrows and moving average direction.
  • Bear Color - Sets the color of bear arrows and moving average direction.
  • Arrow Size - Sets the size of arrows that are positioned on the moving average.
  • Line Size - Sets the size of both stochastic and moving average lines.


추천 제품
Follow The Line MT5
Oliver Gideon Amofa Appiah
4.52 (29)
This indicator obeys the popular maxim that: "THE TREND IS YOUR FRIEND" It paints a GREEN line for BUY and also paints a RED line for SELL. (you can change the colors). It gives alarms and alerts of all kinds. IT DOES NOT REPAINT and can be used for all currency pairs and timeframes. Yes, as easy and simple as that. Even a newbie can use it to make great and reliable trades. NB: For best results, get my other premium indicators for more powerful and reliable signals. Get them here: https://www.m
FREE
High-Low Liquidity Sweep ICT MT5 The HLRS (High Liquidity Resistance Sweep) and LLRS (Low Liquidity Resistance Sweep) indicators are advanced tools designed to analyze price movement within liquidity zones based on the ICT framework. An HLRS pattern emerges when the price accumulates liquidity at its lowest point before initiating an upward movement. This shift is characterized by the consistent formation of higher lows and higher highs, establishing a structured bullish trend. On the other hand
FREE
I present the well-known Moving Average indicator. This indicator is presented as a channel, where the upper and lower lines are equidistant from the main line by a percentage set by the user. The indicator is easy to use. The basic settings of the moving average have been saved and a percentage parameter (Channel%) has been added. Basic parameters: Channel% - shows how much we want to deviate from the main line. The indicator is freely available.
FREE
Технический индикатор Trend Moving Average позволяет определить глобальное направление рынка. Данный технический индикатор создан для того, чтобы определить «линию наименьшего сопротивления» рынка и понять в какую сторону направлен тренд. Помимо классического использования МА, индикатор позволяет понять направленность рынка на основе динамики его значений. Так, если значение индикатора демонстрируют переход с нисходящего значения в восходящее (и наоборот) - это является дополнительным торговым с
FREE
Mitimom
Danil Poletavkin
The indicator is based on Robert Miner's methodology described in his book "High probability trading strategies" and displays signals along with momentum of 2 timeframes. A Stochastic oscillator is used as a momentum indicator. The settings speak for themselves period_1 is the current timeframe, 'current' period_2 is indicated - the senior timeframe is 4 or 5 times larger than the current one. For example, if the current one is 5 minutes, then the older one will be 20 minutes The rest of the s
FREE
Price Momentum
Flavio Javier Jarabeck
4.92 (12)
Value Chart indicator presents the Price evolution in a new form. This indicator, Price Momentum , was developed taking all the calculations presented in the book " Dynamic Trading Indicators " by Mark W. Helweg and David Stendahl (2002). The technique involves de-trended Prices from a user-defined Period of analysis and the addition of a Volatility index correction. The result is an Oscillator with 3 zones: Fair Price Value, Overbought/Oversold and Extremely Overbought/Oversold zones. Adding th
FREE
Supports And Resistances Lines
Francisco Gomes Da Silva
4.76 (37)
지원 및 저항 구역 표시기 MT5 이 표시기는 상단과 하단을 자동으로 식별하는 방법을 알고 있습니다. 이 지지선과 저항선 표시기는 상단과 하단을 기준으로 지지선과 저항선을 만듭니다. 지지선과 저항선을 만드는 방법. 자동 지지선과 저항선을 만드는 지표입니다. 지표로 지원 수준을 찾는 방법 이 표시기는 자동으로 상단과 하단을 찾습니다. 지그재그(ZigZag)가 자동으로 바닥을 생성하거나 새로운 바닥을 이전 바닥보다 낮게 만들 때마다 표시기가 자동으로 지지선을 생성하므로 표시기가 자동으로 화면에 자동 지지선을 그립니다. 저항선을 만드는 방법. 지그재그(ZigZag)가 새로운 최고점이나 최고점을 이전 최고점보다 높게 만들 때마다 표시기가 지지선을 생성하는 것과 같은 방식으로 자동으로 저항선을 생성하므로 표시기가 자동으로 새로운 저항을 생성하므로 사용자가 상단과 하단 레벨이 어디에 있는지 걱정해야 합니다. 이 지표는 트레이더가 차트에 지지와 저항을 표시할 수 있는 쉬운 방법입니다. 상단 표시
FREE
Multi-timeframe trend indicator based on the ADX / ADXWilder indicator with Fibonacci levels The indicator shows trend areas using ADX or ADXWilder indicator data from multiple timeframes. The impulse mode of the indicator allows you to catch the beginning of a trend, and several "Screens" with different timeframes allow you to filter out market noise. Fibonacci levels are added to the price chart, which have flexible settings. How the indicator works: if PDI is greater than NDI, then   it`s
FREE
This indicator is a zero-lag indicator and displays  strength of trend change . True Trend  Oscillator Pro works best in combination with True Trend Moving Average Pro that displays exact trend as is. Oscillator value is exact price change in given direction of the trend. True Trend Moving Average Pro: https://www.mql5.com/en/market/product/103586 If you set PERIOD input parameter to 1 this indicator becomes a sharpshooter for binary options. Developers can use True Trend Oscillator in Exper
FREE
IMA Finder MT5
Mubashir Mohamed Quraish Albarakat
1 (1)
This indicator is designed based on the Moving Origin indicator When the moving origin indicator breaks the price, this indicator gives a signal It is useful for better viewing of signals and analysis on them Attributes: Can be used in all symbols Can be used in all time frames Too many signals Simple and quick settings Easy way to work Settings: period: like moving average settings alarmShow: If you want to receive an alert in Metatrader after receiving the signal, enable this setting alarmS
FREE
CrosssX Indicator Strategy
M Abdullahfaiz Rahman
A buy signal can be seen on the dashboard when the previous signal is red and the next signal is green, then the SAR is green and the RSI is green. A Sell Signal can be seen on the dashboard when the previous Signal is green and the Signal after it is red, then the SAR is red and the RSI is red. Line function - shows on the chart the lines of Opening, Stop Loss, Take Profit. With this function, it is easy to create a new order and see its additional characteristics before opening.   TP and SL
FREE
Coral Indi
Dinh Duong Luong
Coral trend is   a trend-following indicator that is widely popular among FOREX traders . It is usually used as a confluence with other indicators. It uses combinations of moving averages with complex smoothing formulas! It has two configurable parameters: Coefficient   - smoothing ratio (*) Applied price Calculation: Coral = (-0.064) * B6 + 0.672 * B5 - 2.352 * B4 + 2.744 * B3
FREE
Super Trend eu
Emin Ulucanli
4.75 (4)
SUPERTREND; It is a trend following indicator based on the SuperTrend ATR created by Olivier Seban. It can be used to detect changes in trend direction and locate stops. When the price falls below the indicator curve, it turns red and indicates a downtrend. Conversely, when the price moves above the curve, the indicator turns green, indicating an uptrend. Like other indicators, it works well on SuperTrend when used in conjunction with other indicators such as MACD, parabolik SAR, Bollinger Band
FREE
Market Momentum
Flavio Javier Jarabeck
4.33 (6)
The Market Momentum indicator is based on the Volume Zone Oscillator (VZO), presented by Waleed Aly Khalil in the 2009 edition of the International Federation of Technical Analysts journal, and presents a fresh view of this market valuable data that is oftenly misunderstood and neglected: VOLUME. With this new approach of "seeing" Volume data, traders can infer more properly market behavior and increase their odds in a winning trade. "The VZO is a leading volume oscillator; its basic usefulness
FREE
Reversal Composite Candles
MetaQuotes Ltd.
3.57 (14)
The idea of the system is to indentify the reversal patterns using the calculation of the composite candle. The reversal patterns is similar to the "Hammer" and "Hanging Man" patterns in Japanese candlestick analysis. But it uses the composite candle instead the single candle and doesn't need the small body of the composite candle to confirm the reversal. Input parameters: Range - maximal number of bars, used in the calculation of the composite candle. Minimum - minimal size of the composite can
FREE
ThreeM Quantum Tunneling
Nguyen Duc Quy
3.6 (10)
There is a science, named Quantitative Finance, that allows to study the financial derivative pricing models using the methods of theoretical and mathematical physics. Lately I came across a paper that describes a new indicator for technical analysis that combines ideas from quantum physics and brings them to finance. I got interested in it and decided I would teach how to implement indicators based on a scientific papers in MQL5.  The original Moving Mini-Max paper [2] is written by Z.K. Silaga
FREE
Micro Moving Average
Aleksandr Goryachev
Moving Average  ******************* Moving Average для платформы секундных графиков Micro . ********************* Секундный график на порядок увеличит точность ваших входов и выходов. Секундный период , в привычном формате,   позволит увидеть то, что ранее было скрыто. Бесплатные индикаторы, дополнят визуальную картину, что, в совокупности выведет вашу торговлю на новый уровень. Идеально подходит как скальперам, так и трейдерам торгующим внутри дня.  Индикатор  Moving Average для платформы Micr
FREE
Bollinger Bands B
Flavio Javier Jarabeck
4.5 (2)
John Bollinger created this indicator in 2010 as a way to read the original indicator (Bollinger Bands) in a more "technical" way, shown as an oscillator. The typical range of the Bollinger Bands %B is 0 - 0.5 - 1.0, where "0" represents the lower band, the "0.5" the middle band, and "1" the upper band. The line on the indicator represents the Closing prices. As simple as that. SETTINGS Bollinger Bands period of analysis Standard Deviation multiplier Shift Price type to be analyzed If you like
FREE
Moving line
Jun Chao Jiang
The one minute chart has a bug, but the one-day chart can still be used after deleting the bug and reloading the indicators, This indicator can be used to determine how far the indicator goes up to place an order to buy, how far it goes down to place an order to sell, and not placing an order until it reaches this distance, which is considered oscillation, open an account gift index
FREE
RSI on Moving Average Indicator for MT5 The RSI on MA Indicator integrates Moving Average Crossovers with the Relative Strength Index (RSI) to enhance trend detection and momentum analysis. By merging these technical elements, it improves precision in identifying market movements. The indicator displays two oscillating lines ranging from 0 to 100, making it easier to pinpoint buy and sell opportunities while clarifying trend directions. «Indicator Installation & User Guide» MT5 Indicator Instal
FREE
To get access to MT4 version please click   here . This is the exact conversion from TradingView: "Hammer & ShootingStar Candle Detector" by "MoriFX". This is a light-load processing and non-repaint indicator. All input options are available.  Buffers are available for processing in EAs. You can message in private chat for further changes you need. Thanks.
FREE
WaveTrend Plus
Nguyen Thanh Cong
5 (5)
Introduction WaveTrend Plus is an amazing oscillator that can detect optimal entry points in the market with high precision using complex computations of price and momentum. This version packs many improvements compared to the original WaveTrend such as cleaner visuals, oversold/overbought signals and divergence detection Signal Buy when oversold signal appear (green dot below) or when a bullish divergence is detected (green dashed line) Sell when overbought signal appear (red dot above) or
FREE
Discover the power of fractals to uncover significant market reversals! This custom Fractals Indicator for MetaTrader 5 is designed to help traders quickly and effectively spot potential swing highs and lows, providing visual cues that make trading decisions easier. Key Features: Clear Buy & Sell Signals: Green and red arrows highlight bullish and bearish fractals, helping you effortlessly identify significant price pivots. Customizable Analysis Depth: Choose the number of bars to evaluate for f
FREE
Colored Adaptive Moving Average AMA
Flavio Javier Jarabeck
4.86 (7)
If you like to use traditional Moving Averages (like SMAs and EMAs) to provide your trades for dynamic levels of Support and Resistance, you will love the Adaptive Moving Average (AMA). Created in 1995 by Perry Kaufman and presented to the world in his book " Smarter   Trading :  Improving   Performance   in   Changing   Markets ", the Adaptive Moving Average (also known as KAMA - Kaufman Adaptive Moving Average) has the goal to be the perfect companion for following a trend without noise, but s
FREE
ViX 75 BOT FushionEA
Theodorus Bernadu Kleynhans
This EA runs on Volatility 75 index (M12 Timeframe). EA is fully dynamic (dynamic lot size, dynamic SL, dynamic TP, and dynamic trailing SL). Recommended account $200. Please note, Volatility 75 Index is available on Deriv Broker (make sure to use on Volatility 75 Index, 12M timeframe) Please join discord for any and all questions. For Volatility indexes use Deriv (broker) https://deriv.com/markets/derived-indices/synthetic-indices Direct purchases will only be in discord. Assorted bots avail
FREE
Auto Fibonacci
Ali Gokay Duman
5 (3)
This indicator calculates fibonacci levels via moving averages trend and draw these lines. You can change fast and slow Moving Averages settings for customization. Inputs: Fast MA Time Period :  64 Fast MA Shift: 0 Fast MA Method: Smoothed Fast MA Apply To: Median Price Slow MA Time Period: 32 Slow MA Shift: 0 Slow MA Method: Smoothed Slow MA Apply To: Median Price ZigZag: False ZigZag Color: Red ZigZag Type: DashDot ZigZag Width: VeryThin Fibo Settings TrendFibonacci: True FiboTrendColor: Black
FREE
Donchian Pro
Paulo Henrique Faquineli Garcia
5 (3)
The Donchian Channel Channels are among the most popular tools of technical analysis, as they visually convey to the analyst the limits within which most price movement tends to occur. Channel users know that valuable information can be obtained at any time, whether prices are in the central region of a band or close to one of the border lines. One of the best known techniques to explore these concepts is Bollinger Bands. However, John Bollinger was not the only one to research the application
FREE
MA Crossover Alerts by Chart Walker
Dushshantha Rajkumar Jayaraman
Moving Average Crossover Alerts by Chart Walker The Moving Average Crossover Alerts Indicator is designed to help traders identify potential trend reversals and entry/exit points in the market. By tracking two moving averages—typically a faster (short-term) and a slower (long-term) one—the indicator generates alerts whenever these moving averages cross. Key Features: Customizable Moving Averages: Choose from various types of moving averages (SMA, EMA, WMA, etc.) and set your desired periods for
FREE
Value Chart Candlesticks
Flavio Javier Jarabeck
4.73 (11)
The idea of a Value Chart indicator was presented in the very good book I read back in 2020 , " Dynamic Trading Indicators: Winning with Value Charts and Price Action Profile ", from the authors Mark Helweg and David Stendahl. The idea is simple and the result is pure genius: Present candlestick Price analysis in a detrended way! HOW TO READ THIS INDICATOR Look for Overbought and Oversold levels. Of course, you will need to test the settings a lot to find the "correct" one for your approach. It
FREE
Arrowhead MT5
Ivan Grachev
4.43 (14)
Indicator determines the direction of price movement, calculates the possibility of entering the market using an internal formula and displays a breakout entry signal. Indicator signals appear both at the beginning of trend movements and in the opposite direction, which allows you to open and close orders as efficiently as possible in any of the market conditions. Version for МТ4: https://www.mql5.com/en/market/product/58349 Benefits: a unique signal calculation formula; high signal accuracy; d
FREE
이 제품의 구매자들이 또한 구매함
Trend Screener Pro MT5
STE S.S.COMPANY
4.85 (80)
트렌드 표시기, 트렌드 트레이딩 및 필터링을 위한 획기적인 고유 솔루션, 하나의 도구 안에 내장된 모든 중요한 트렌드 기능! Forex, 상품, 암호 화폐, 지수 및 주식과 같은 모든 기호/도구에 사용할 수 있는 100% 다시 칠하지 않는 다중 시간 프레임 및 다중 통화 표시기입니다. Trend Screener는 차트에 점이 있는 화살표 추세 신호를 제공하는 효율적인 지표 추세 추종 지표입니다. 추세 분석기 표시기에서 사용할 수 있는 기능: 1. 트렌드 스캐너. 2. 최대 이익 분석이 있는 추세선. 3. 추세 통화 강도 측정기. 4. 경고가 있는 추세 반전 점. 5. 경고가 있는 강력한 추세 점. 6. 추세 화살표 Trend Screener Indicator가 있는 일일 분석 예, 일일 신호 성능...등은 여기에서 찾을 수 있습니다. 여기를 클릭하십시오. LIMITED TIME OFFER : Trend Screener Indicator는 50$ 및 평생 동안만 사용할 수 있습니다.
Golden Trend Indicator MT5
Noha Mohamed Fathy Younes Badr
4.89 (18)
Golden Trend indicator  is The best indicator for predicting trend movement this indicator never lags and never repaints and never back paints    and give  arrow buy and sell    before the candle appear  and it will help you and  will make your trading decisions clearer its work on all currencies and  gold and crypto and all time frame This unique  indicator uses very secret algorithms to catch the  trends, so you can trade using this indicator and see the trend clear on charts  manual guide and
Algo Pumping
Ihor Otkydach
5 (7)
PUMPING STATION – 당신만을 위한 올인원(All-in-One) 전략 PUMPING STATION은 당신의 외환 거래를 더욱 흥미롭고 효과적으로 바꿔줄 혁신적인 인디케이터입니다. 단순한 보조 도구가 아니라, 강력한 알고리즘을 갖춘 완전한 거래 시스템으로서 보다 안정적인 트레이딩을 시작할 수 있도록 도와줍니다. 이 제품을 구매하시면 다음의 혜택을 무료로 받으실 수 있습니다: 전용 설정 파일: 자동 설정으로 최대의 퍼포먼스를 제공합니다. 단계별 동영상 가이드: PUMPING STATION 전략으로 거래하는 법을 배워보세요. Pumping Utility: PUMPING STATION과 함께 사용하도록 설계된 반자동 거래 봇으로, 거래를 더욱 쉽고 편리하게 만들어줍니다. ※ 구매 후 바로 저에게 메시지를 보내주세요. 추가 자료에 대한 접근 권한을 제공해드립니다. PUMPING STATION은 어떻게 작동하나요? 트렌드 컨트롤: 시장의 추세 방향을 즉시 파악합니다. 추세는 최고의
MONEYTRON – ТВОЙ ЛИЧНЫЙ СИГНАЛ НА УСПЕХ! XAUUSD | AUDUSD | USDJPY | BTCUSD Поддержка таймфреймов: M5, M15, M30, H1 Почему трейдеры выбирают Moneytron? 82% успешных сделок — это не просто цифры, это результат продуманной логики, точного алгоритма и настоящей силы анализа. Автоматические сигналы на вход — не нужно гадать: когда покупать, когда продавать. 3 уровня Take Profit — ты сам выбираешь свой уровень прибыли: безопасный, уверенный или максимум. Четкий Stop Loss — контролируешь риск
Gold Stuff mt5
Vasiliy Strukov
4.93 (178)
Gold Stuff mt5는 금을 위해 특별히 설계된 추세 지표이며 모든 금융 상품에서도 사용할 수 있습니다. 표시기가 다시 그려지지 않고 지연되지 않습니다. 권장 기간 H1. 설정 및 개인 보너스를 받으려면 구매 후 즉시 저에게 연락하십시오!     강력한 지원 및 트렌드 스캐너 표시기의 무료 사본을 받으실 수 있습니다. 메시지를 보내주세요. 나!   설정 화살표 그리기 - 켜기 끄기. 차트에 화살표 그리기. 경고 - 가청 경고를 끕니다. 이메일 알림 - 켜기 끄기. 이메일 알림. Puch-notification - 켜기 끄기. 푸시 알림. 다음으로 색 영역을 조정합니다. Gold Stuff mt5는 금을 위해 특별히 설계된 추세 지표이며 모든 금융 상품에서도 사용할 수 있습니다. 표시기가 다시 그려지지 않고 지연되지 않습니다. 권장 기간 H1. 설정 및 개인 보너스를 받으려면 구매 후 즉시 저에게 연락하십시오!   설정 화살표 그리기 - 켜기 끄기. 차트에 화살표 그
Support And Resistance Screener는 하나의 지표 안에 여러 도구를 제공하는 MetaTrader에 대한 하나의 레벨 지표입니다. 사용 가능한 도구는 다음과 같습니다. 1. 시장 구조 스크리너. 2. 완고한 후퇴 영역. 3. 약세 후퇴 영역. 4. 일일 피벗 포인트 5. 주간 피벗 포인트 6. 월간 피벗 포인트 7. 고조파 패턴과 볼륨에 기반한 강력한 지지와 저항. 8. 은행 수준 구역. LIMITED TIME OFFER : HV 지원 및 저항 표시기는 50 $ 및 평생 동안만 사용할 수 있습니다. ( 원래 가격 125$ ) MQL5 블로그에 액세스하면 분석 예제와 함께 모든 프리미엄 지표를 찾을 수 있습니다. 여기를 클릭하십시오. 주요 특징들 고조파 및 볼륨 알고리즘을 기반으로 하는 강력한 지원 및 저항 영역. Harmonic 및 Volume 알고리즘을 기반으로 한 강세 및 약세 풀백 영역. 시장 구조 스크리너 일간, 주간 및 월간 피벗 포인트. 실제 거래의
FX Power MT5 NG
Daniel Stein
5 (14)
FX Power: 통화 강세 분석으로 더 스마트한 거래 결정을 개요 FX Power 는 어떤 시장 상황에서도 주요 통화와 금의 실제 강세를 이해하기 위한 필수 도구입니다. 강한 통화를 매수하고 약한 통화를 매도함으로써 FX Power 는 거래 결정을 단순화하고 높은 확률의 기회를 발견합니다. 트렌드를 따르거나 극단적인 델타 값을 사용해 반전을 예측하고자 한다면, 이 도구는 귀하의 거래 스타일에 완벽히 적응합니다. 단순히 거래하지 말고, FX Power 로 더 스마트하게 거래하세요. 1. FX Power가 거래자에게 매우 유용한 이유 통화와 금의 실시간 강세 분석 • FX Power 는 주요 통화와 금의 상대적 강세를 계산하고 표시하여 시장 역학에 대한 명확한 통찰력을 제공합니다. • 어떤 자산이 앞서고 있고 어떤 자산이 뒤처지는지 모니터링하여 보다 현명한 거래 결정을 내릴 수 있습니다. 포괄적인 멀티 타임프레임 뷰 • 단기, 중기 및 장기 타임프레임에서 통화와 금의 강세를
FX Volume MT5
Daniel Stein
4.82 (17)
FX Volume: 브로커 시각에서 바라보는 진짜 시장 심리 간단 요약 트레이딩 접근 방식을 한층 더 향상시키고 싶으신가요? FX Volume 는 소매 트레이더와 브로커의 포지션을 실시간으로 파악할 수 있게 해 줍니다. 이는 COT 같은 지연된 보고서보다 훨씬 빠릅니다. 꾸준한 수익을 추구하는 분이든, 시장에서 더 깊은 우위를 원하시는 분이든, FX Volume 을 통해 대규모 불균형을 찾아내고, 돌파 여부를 확인하며 리스크 관리를 정교화할 수 있습니다. 지금 시작해 보세요! 실제 거래량 데이터가 의사결정을 어떻게 혁신할 수 있는지 직접 경험해 보시기 바랍니다. 1. 트레이더에게 FX Volume이 매우 유익한 이유 탁월한 정확도를 지닌 조기 경보 신호 • 다른 사람들보다 훨씬 앞서, 각 통화쌍을 매수·매도하는 트레이더 수를 거의 실시간으로 파악할 수 있습니다. • FX Volume 은 여러 리테일 브로커에서 추출한 실제 거래량 데이터를 종합해 명확하고 편리한 형태로 제공하는
Quantum TrendPulse
Bogdan Ion Puscasu
5 (13)
SuperTrend   ,   RSI   ,   Stochastic   의 힘을 하나의 포괄적인 지표로 결합하여 트레이딩 잠재력을 극대화하는 궁극의 트레이딩 도구   인 Quantum TrendPulse를   소개합니다. 정밀성과 효율성을 추구하는 트레이더를 위해 설계된 이 지표는 시장 추세, 모멘텀 변화, 최적의 진입 및 종료 지점을 자신 있게 식별하는 데 도움이 됩니다. 주요 특징: SuperTrend 통합:   주요 시장 추세를 쉽게 따라가고 수익성의 물결을 타세요. RSI 정밀도:   매수 과다 및 매도 과다 수준을 감지하여 시장 반전 시점을 파악하는 데 적합하며 SuperTrend 필터로 사용 가능 확률적 정확도:   변동성이 큰 시장에서 숨겨진 기회를 찾기 위해 확률적 진동   을 활용하고 SuperTrend의 필터로 사용 다중 시간대 분석:   M5부터 H1 또는 H4까지 다양한 시간대에 걸쳐 시장을 최신 상태로 유지하세요. 맞춤형 알림:   맞춤형 거래 조건이 충족되면
Grabber System MT5
Ihor Otkydach
5 (5)
탁월한 기술적 지표인 Grabber를 소개합니다. 이 도구는 즉시 사용 가능한 “올인원(All-Inclusive)” 트레이딩 전략으로 작동합니다. 하나의 코드 안에 강력한 시장 기술 분석 도구, 매매 신호(화살표), 알림 기능, 푸시 알림이 통합되어 있습니다. 이 인디케이터를 구매하신 모든 분들께는 다음의 항목이 무료로 제공됩니다: Grabber 유틸리티: 오픈 포지션을 자동으로 관리하는 도구 단계별 영상 매뉴얼: 설치, 설정, 그리고 실제 거래 방법을 안내 맞춤형 세트 파일: 인디케이터를 빠르게 자동 설정하여 최고의 성과를 낼 수 있도록 도와줍니다 다른 전략은 이제 잊어버리세요! Grabber만이 여러분을 새로운 트레이딩의 정점으로 이끌어 줄 수 있습니다. Grabber 전략의 주요 특징: 거래 시간 프레임: M5부터 H4까지 거래 가능한 자산: 어떤 자산이든 사용 가능하지만, 제가 직접 테스트한 종목들을 추천드립니다 (GBPUSD, GBPCAD, GBPCHF, AUDCAD, AU
Matrix Arrow Indicator MT5
Juvenille Emperor Limited
5 (13)
매트릭스 화살표 표시기 MT5 는 외환, 상품, 암호 화폐, 지수, 주식과 같은 모든 기호/도구에 사용할 수 있는 100% 다시 칠하지 않는 다중 기간 표시기를 따르는 고유한 10 in 1 추세입니다.  Matrix Arrow Indicator MT5 는 다음과 같은 최대 10개의 표준 지표에서 정보와 데이터를 수집하여 초기 단계에서 현재 추세를 결정합니다. 평균 방향 이동 지수(ADX) 상품 채널 지수(CCI) 클래식 하이켄 아시 캔들 이동 평균 이동 평균 수렴 발산(MACD) 상대 활력 지수(RVI) 상대 강도 지수(RSI) 포물선 SAR 스토캐스틱 오실레이터 윌리엄스의 백분율 범위 모든 지표가 유효한 매수 또는 매도 신호를 제공하면 강력한 상승/하락 추세를 나타내는 다음 캔들/막대가 시작될 때 해당 화살표가 차트에 인쇄됩니다. 사용자는 사용할 표시기를 선택하고 각 표시기의 매개변수를 개별적으로 조정할 수 있습니다. 매트릭스 화살표 표시기 MT5는 선택한 표시기에서만 정보를 수
FourAverageMT5
Mikhail Sergeev
5 (2)
포라 평균은 트렌드 탐지의 새로운 단어입니다. 정보 기술의 발전과 많은 참가자들로 인해 금융 시장은 구식 지표에 의한 분석에 덜 민감해지고 있습니다. 이동 평균이나 정작과 같은 기존의 기술적 분석 도구는 순수한 형태로 추세의 방향이나 역전 방향을 결정할 수 없습니다. 하나의 지표가 14 년의 역사를 기반으로 매개 변수를 변경하지 않고 미래 가격의 올바른 방향을 나타낼 수 있습니까? 동시에,옆으로 시장의 움직임과 적절성을 잃지 않는다? 답변:예,할 수 있습니다. 우리 팀은 변화하는 시장 상황에 적응하기 위해 상당히 강력하고 효과적인 메커니즘을 가진 지표를 개발했습니다. 2025 년에 선도적 인 추세 지표"평균"은 새로운 개발 단계에 진입하고 있습니다. 현대 암호 화폐 및 주식 시장은이 지표를 위해 만들어진 것 같습니다. 고유 한 스무딩 공식을 사용하면 통화 쌍 또는 기타 악기의 모든 기능에 대한 표시기를 조정(패턴 식별)할 수 있습니다. 지금,이익을 만들기 위해,하나의 지표는 충분하다
FX Levels MT5
Daniel Stein
5 (4)
FX Levels: 모든 시장을 위한 뛰어난 정확도의 지지와 저항 간단 요약 통화쌍, 지수, 주식, 원자재 등 어떤 시장이든 믿을 만한 지지·저항 레벨을 찾고 싶나요? FX Levels 는 전통적인 “Lighthouse” 기법과 첨단 동적 접근을 결합해, 거의 보편적인 정확성을 제공합니다. 실제 브로커 경험을 반영하고, 자동화된 일별 업데이트와 실시간 업데이트를 결합함으로써 FX Levels 는 가격 반전 포인트를 파악하고, 수익 목표를 설정하며, 자신 있게 트레이드를 관리할 수 있게 돕습니다. 지금 바로 시도해 보세요—정교한 지지/저항 분석이 어떻게 여러분의 트레이딩을 한 단계 끌어올릴 수 있는지 직접 확인하세요! 1. FX Levels가 트레이더에게 매우 유용한 이유 뛰어난 정확도의 지지·저항 존 • FX Levels 는 다양한 브로커 환경에서도 거의 동일한 존을 생성하도록 설계되어, 데이터 피드나 시간 설정 차이로 인한 불일치를 해소합니다. • 즉, 어떤 브로커를 사용하
IX Power MT5
Daniel Stein
4.86 (7)
IX Power: 지수, 원자재, 암호화폐 및 외환 시장 통찰력을 발견하세요 개요 IX Power 는 지수, 원자재, 암호화폐 및 외환 시장의 강도를 분석할 수 있는 다목적 도구입니다. FX Power 는 모든 가용 통화 쌍 데이터를 사용하여 외환 쌍에 대해 가장 높은 정확도를 제공하는 반면, IX Power 는 기초 자산 시장 데이터에만 초점을 맞춥니다. 이로 인해 IX Power 는 비외환 시장에 이상적이며, 다중 쌍 분석이 필요하지 않은 간단한 외환 분석에도 신뢰할 수 있는 도구입니다. 모든 차트에서 매끄럽게 작동하며, 거래 결정을 향상시키기 위한 명확하고 실행 가능한 통찰력을 제공합니다. 1. IX Power가 트레이더에게 유용한 이유 다양한 시장 강도 분석 • IX Power 는 지수, 원자재, 암호화폐 및 외환 심볼의 강도를 계산하여 각 시장에 맞는 통찰력을 제공합니다. • US30, WTI, 금, 비트코인 또는 통화 쌍과 같은 자산을 모니터링하여 거래 기회를 발견
Trade smarter, not harder: Empower your trading with Harmonacci Patterns This is arguably the most complete harmonic price formation auto-recognition indicator you can find for the MetaTrader Platform. It detects 19 different patterns, takes fibonacci projections as seriously as you do, displays the Potential Reversal Zone (PRZ) and finds suitable stop-loss and take-profit levels. [ Installation Guide | Update Guide | Troubleshooting | FAQ | All Products ] It detects 19 different harmonic pri
MTF Supply Demand Zones MT5
Georgios Kalomoiropoulos
5 (1)
자동화된 수요 및 공급 구역의 차세대. 모든 차트에서 작동하는 새롭고 혁신적인 알고리즘. 모든 구역은 시장의 가격 움직임에 따라 동적으로 생성됩니다. 두 가지 유형의 경고 --> 1)가격이 영역에 도달할 때 2)새로운 영역이 형성될 때 당신은 더 이상 쓸모없는 지표를 얻을 수 없습니다. 입증된 결과로 완벽한 거래 전략을 얻을 수 있습니다.     새로운 기능:     가격이 공급/수요 영역에 도달하면 경고     새로운 공급/수요 구역이 생성되면 알림     푸시 알림 알림     핍의 영역 너비 레이블     기동특무부대에 한 번 더 시간이 주어집니다. 따라서 현재보다 위의 2개의 시간 프레임 대신 현재보다 높은 3개의 시간 프레임을 볼 수 있습니다.     Alerts/Zones/MTF 기능을 활성화/비활성화하는 버튼 당신이 얻는 이점:     거래에서 감정을 제거하십시오.     거래 항목을 객관화하십시오.     높은 확률 설정을 사용하여 수익
프리시전 트레이딩 시스템의 로저 메드칼프에 의한 프리시전 인덱스 오실레이터 (Pi-Osc) 버전 2는 차트에 신속하게 로드되도록 주의 깊게 다시 코딩되었으며 경험을 향상시키기 위해 몇 가지 다른 기술적 개선 사항이 통합되었습니다. Pi-Osc는 정확한 거래 타이밍 신호를 제공하도록 개발되었으며 시장이 모든 사람의 스톱을 청산하기 위해 가야 하는 극도의 고갈 지점을 찾는 데 목적이 있습니다. 이 제품은 극단적인 지점이 어디에 있는지 알고 있는 고전적인 문제를 해결하며 트레이더로서의 삶을 훨씬 간단하게 만듭니다. 이것은 업계 표준 오실레이터와는 상당히 다른 강력한 차이점을 가지고 있는 고도로 복잡한 합의 지표입니다. 사용하는 기능 중 일부는 수요 지수, 자금 흐름, RSI, 스토캐스틱, 패턴 인식, 거래량 분석, 표준 편차 극단점 및 다양한 길이에서 위와 유사한 변형을 갖습니다. 미숙한 눈에는 다른 오실레이터와 비슷해 보일 수 있지만 RSI 또는 모멘텀과 같은 다른 오실레이
MetaBands M5
Vahidreza Heidar Gholami
4.5 (2)
MetaBands uses powerful and unique algorithms to draw channels and detect trends so that it can provide traders with potential points for entering and exiting trades. It’s a channel indicator plus a powerful trend indicator. It includes different types of channels which can be merged to create new channels simply by using the input parameters. MetaBands uses all types of alerts to notify users about market events. Features Supports most of the channel algorithms Powerful trend detection algorith
The   Time_Price_SQ9_Degree   indicator is based on the 9 Gann square. Using this indicator, you can identify strong time and price zones. The indicator displays the levels as a degree value. The degrees can be set in the settings. After launching, the MENU button appears. If it is highlighted, it can be moved to any point on the graph, and after double-clicking on it, it stops being highlighted and menu buttons appear. To hide the menu, just double-click on the button, it will become highlight
TPSproTREND PrO MT5
Roman Podpora
4.72 (18)
VERSION MT4        —        ИНСТРУКЦИЯ RUS           —        INSTRUCTIONS  ENG 주요 기능: 렌더링 없이 정확한 입력 신호! 신호가 나타나면 관련성은 유지됩니다! 이는 신호를 제공한 후 변경하여 예금 자금 손실을 초래할 수 있는 다시 그리기 지표와의 중요한 차이점입니다. 이제 더 큰 확률과 정확도로 시장에 진입할 수 있습니다. 화살표가 나타난 후 목표에 도달(이익실현)하거나 반전 신호가 나타날 때까지 캔들을 색칠하는 기능도 있습니다. STOP LOSS / TAKE PROFIT 구역 표시 진입점 검색 시 시각적 명확성을 높이기 위해 시장 진입을 위한 최적 지점이 검색되는 BUY/SELL 영역을 초기에 표시하는 모듈을 만들었습니다. 정지 손실 수준 작업을 위한 추가 지능형 논리는 시간이 지남에 따라 크기를 줄이는 데 도움이 되므로 거래에 들어갈 때 초기 위험을 줄이는 데 도움이 됩니다(move sl). 더 높은 기간의 MIN
FX Dynamic: 맞춤형 ATR 분석으로 변동성과 트렌드를 파악하세요 개요 FX Dynamic 는 Average True Range(ATR) 계산을 활용하여 트레이더에게 일간 및 일중 변동성에 대한 뛰어난 인사이트를 제공하는 강력한 도구입니다. 80%, 100%, 130%와 같은 명확한 변동성 임계값을 설정함으로써 시장이 평소 범위를 초과할 때 빠르게 경고를 받고, 유망한 수익 기회를 재빨리 식별할 수 있습니다. FX Dynamic 는 브로커의 시간대를 인식하거나 수동으로 조정할 수 있으며, 변동성 측정 기준을 일관되게 유지하며, MetaTrader 플랫폼과 완벽하게 연동되어 실시간 분석을 지원합니다. 1. FX Dynamic이 트레이더에게 매우 유용한 이유 실시간 ATR 인사이트 • 하루 및 일중 변동성을 한눈에 모니터링하세요. ATR의 80%, 100%, 130% 임계값이 도달 또는 초과되면, 시장의 중요한 지점에 있음을 알 수 있습니다. • 변동성이 완전히 폭발하기
PZ Mean Reversion MT5
PZ TRADING SLU
3 (2)
평균 회귀 거래에 대한 전문적이고 정량적인 접근 방식을 구현하는 고유한 지표입니다. 이는 가격이 예측 가능하고 측정 가능한 방식으로 평균으로 전환되고 반환된다는 사실을 이용하여 비정량적 거래 전략을 훨씬 능가하는 명확한 진입 및 퇴장 규칙을 허용합니다. [ Installation Guide | Update Guide | Troubleshooting | FAQ | All Products ] 명확한 거래 신호 놀랍도록 쉬운 거래 사용자 정의 가능한 색상 및 크기 성능 통계 구현 대부분의 거래 전략을 능가합니다. 적절한 SL 및 TP 레벨을 표시합니다. 이메일/음향/시각 알림을 구현합니다. 작동 원리 이 지표는 더 높은 기간에서 완전히 사용자 정의 가능한 이동 평균 주변의 표준 편차를 측정하고 추세 추종 접근 방식을 사용하여 정확하게 거래를 찾습니다. 거래는 현재 차트의 가격 동작을 살펴보고 선택한 더 높은 기간에서 계산된 평균 가격대로 가격이 돌아오면 닫힙니다. 코딩 방식 때문에 지
Entry Points Pro for MT5
Yury Orlov
4.46 (130)
다시 색을 칠하지 않고 거래에 진입할 수 있는 정확한 신호를 제공하는 MT5용 지표입니다. 외환, 암호화폐, 금속, 주식, 지수 등 모든 금융 자산에 적용할 수 있습니다. 매우 정확한 추정값을 제공하고 매수와 매도의 가장 좋은 시점을 알려줍니다. 하나의 시그널로 수익을 내는 지표의 예와 함께 비디오 (6:22)시청하십시오! 대부분의 거래자는 Entry Points Pro 지표의 도움으로 첫 거래 주 동안 트레이딩 결과를 개선합니다. 저희의   Telegram Group 을 구독하세요! Entry Points Pro 지표의 좋은점. 재도색이 없는 진입 신호 신호가 나타나고 확인되면(시그널 캔들이 완성된 경우) 신호는 더 이상 사라지지 않습니다. 여타 보조지표의 경우 신호를 표시한 다음 제거되기 때문에 큰 재정적 손실로 이어집니다. 오류 없는 거래 게시 알고리즘을 통해 트레이드(진입 또는 청산)를 할 이상적인 순간을 찾을 수 있으며, 이를 통해 이를 사용하는 모든 거래자의 성공률이
ATrend
Zaha Feiz
4.77 (13)
ATREND: 작동 방식 및 사용 방법 ### 작동 방식 MT5 플랫폼을 위한 "ATREND" 지표는 기술 분석 방법론의 조합을 활용하여 트레이더에게 강력한 매수 및 매도 신호를 제공하도록 설계되었습니다. 이 지표는 주로 변동성 측정을 위해 평균 진폭 범위(ATR)를 활용하며, 잠재적인 시장 움직임을 식별하기 위한 트렌드 탐지 알고리즘과 함께 사용됩니다. 구매 후 메시지를 남기면 특별 보너스 선물을 받게 됩니다. ### 주요 특징: - 동적 트렌드 탐지: 이 지표는 시장 트렌드를 평가하고 신호를 조정하여 트레이더가 현재 시장 상황에 맞춰 전략을 조정할 수 있도록 돕습니다. - 변동성 측정: ATR을 사용하여 시장의 변동성을 측정하며, 이는 최적의 손절매(SL) 및 이익 실현(TP) 수준을 결정하는 데 중요합니다. - 신호 시각화: 이 지표는 차트에 매수 및 매도 신호를 시각적으로 표시하여 트레이더의 의사 결정을 향상시킵니다. ### 운영 단계 #### 입력 및 설정 - TimeFr
TPSpro RFI Levels MT5
Roman Podpora
4.55 (20)
주요 플레이어의 반전 구역 / 피크 볼륨 / 활성 구역 =       TS TPS프로시스템 지침 RUS       /       지침       영어       /           버전 MT4        이 지표를 구매한 모든 구매자는 또한 다음을 무료로 받습니다. RFI SIGNALS 서비스의 거래 신호에 6개월 동안 액세스할 수 있습니다. TPSproSYSTEM 알고리즘에 따른 즉시 사용 가능한 진입 포인트입니다. 정기적으로 업데이트되는 교육 자료 - 전략에 푹 빠져서 전문가 수준을 높여보세요. 주중 24/5 지원 및 비공개 트레이더 채팅 이용 - 시장 상황에 대한 소통, 지원 및 분석. 저자가 설정한 파일 - 별도의 노력 없이 최대 결과를 얻을 수 있도록 지표를 자동으로 설정합니다. 주요 기능: 판매자와 구매자의 활동 영역을 표시합니다! 이 지표는 매수 및 매도에 대한 모든 올바른 첫 번째 임펄스 레벨/존을 표시합니다. 진입점 검색이 시작되는 이러한 레벨/존이 활성화되면
Legend mt5
Vladyslava Shaviernieva
This is an indicator that includes the best basic forex indicators , without redrawing. Based on this data, a sell or buy signal is generated. It does not disappear anywhere after the signal, which gives us the opportunity to see the results on the history. It can be used on any currency pair, crypto, metals, stocks It is best used on an hourly chart, but other periods are also acceptable. The best results for the period H1,H4,daily If customers have any questions, I will answer them and af
RelicusRoad Pro MT5
Relicus LLC
4.78 (18)
이제 $ 147 (몇 가지 업데이트 후 $ 499 증가) - 무제한 계정 (PCS 또는 MACS) RelicusRoad 사용 설명서 + 교육 비디오 + 비공개 Discord 그룹 액세스 + VIP 상태 시장을 보는 새로운 방법 RelicusRoad는 외환, 선물, 암호화폐, 주식 및 지수에 대한 세계에서 가장 강력한 거래 지표로서 거래자에게 수익성을 유지하는 데 필요한 모든 정보와 도구를 제공합니다. 우리는 초보자부터 고급까지 모든 거래자가 성공할 수 있도록 기술적 분석 및 거래 계획을 제공합니다. 미래 시장을 예측할 수 있는 충분한 정보를 제공하는 핵심 거래 지표입니다. 우리는 차트에서 말이 안 되는 여러 지표 대신 완전한 솔루션을 믿습니다. 타의 추종을 불허하는 매우 정확한 신호, 화살표 + 가격 조치 정보를 표시하는 올인원 표시기입니다. 강력한 AI를 기반으로 하는 RelicusRoad는 누락된 정보와 도구를 제공하여 교육하고 성공적인 트레이더인 트레이딩 전문가가 되도
설명 ICSM(Impulse-Correction SCOB Mapper)은 가격 움직임을 분석하고 유효한 충격, 수정 및 SCOB(Single Candle Order Block)을 식별하는 지표입니다. 유연하고 정보가 풍부하며 사용하기 쉽고 가장 유동성이 높은 관심 영역에 대한 트레이더의 인식을 크게 향상시키기 때문에 모든 유형의 기술적 분석과 함께 사용할 수 있는 강력한 도구입니다. 설정 일반 | 시각 색상 테마 - ICSM의 색상 테마를 정의합니다. SCOB | 시각 SCOB 표시 - SCOB를 활성화/비활성화합니다; SCOB 표시 방법 - SCOB 표현을 위한 스타일 옵션 목록을 나타냅니다; SCOB 색상 - SCOB의 색상을 정의합니다; ICM | 시각 ICM 라인 표시 - ICM(Impulse-Correction Mapper) 라인을 활성화/비활성화합니다; IC 트렌드 표시 - 차트 하단의 색상 구분선을 통해 충격-수정 트렌드 시각화를 활성화/비활성화합니다;
Auto Order Block with break of structure based on ICT and Smart Money Concepts (SMC) Futures Break of Structure ( BoS )             Order block ( OB )            Higher time frame Order block / Point of Interest ( POI )    shown on current chart           Fair value Gap ( FVG ) / Imbalance   -  MTF      ( Multi Time Frame )    HH/LL/HL/LH  -  MTF      ( Multi Time Frame )  Choch  MTF      ( Multi Time Frame )  Volume Imbalance     ,  MTF          vIMB Gap’s Power of 3 Equal High / Low’s  
우선적으로, 이 거래 도구는 전문적인 거래에 이상적인 비-다시 그리기 및 지연되지 않는 지표입니다.  온라인 강좌, 사용자 매뉴얼 및 데모. 스마트 가격 액션 컨셉트 인디케이터는 신규 및 경험 많은 트레이더 모두에게 매우 강력한 도구입니다. Inner Circle Trader Analysis 및 Smart Money Concepts Trading Strategies와 같은 고급 거래 아이디어를 결합하여 20가지 이상의 유용한 지표를 하나로 결합합니다. 이 인디케이터는 스마트 머니 컨셉트에 중점을 두어 대형 기관의 거래 방식을 제공하고 이동을 예측하는 데 도움을 줍니다.  특히 유동성 분석에 뛰어나 기관이 어떻게 거래하는지 이해하는 데 도움을 줍니다. 시장 트렌드를 예측하고 가격 변동을 신중하게 분석하는 데 탁월합니다. 귀하의 거래를 기관 전략에 맞추어 시장의 동향에 대해 더 정확한 예측을 할 수 있습니다. 이 인디케이터는 시장 구조를 분석하고 중요한 주문 블록을 식별하고 다양
제작자의 제품 더 보기
Trend Line Finder MT5
Stephen Reynolds
5 (2)
Trend Line Finder will project forward a support and resistance lines using 2 previous highs for resistance and 2 previous lows for support.  It will then signal to the trader by alert making the trader more aware that a possible good move is about to happen.     This is not a stand-alone trading system but is very useful in finding key areas of support resistance levels where price will usually either rebound from or breakthrough. Its down to the trader to decide what to do with use of other s
FREE
Elliots Triangle
Stephen Reynolds
Elliot's Triangle is taken from 1 of the 13 patterns within the Elliot Wave Theory that says social or crowd behaviour tends to reverse in recognisable patterns and of which they reveal a structural pattern that appears in nature, as well as the mass psychology of trading participants. From this, he has devised various identifiable patterns that appear in market prices. One of these is what I have named Elliot's Triangle. This triangular pattern appears to reflect a balance of forces, causing
FREE
ZZ Scalper
Stephen Reynolds
4 (1)
This EA exploits the inevitable behaviour of price fluctuations and breakouts. Because market prices will always fluctuate to higher highs before ebbing down to lower lows, breakouts of these levels will occur.   This EA will open a trade in anticipation of catching some of the profits from these breakout moves. We use the fixed exit methods of Stop Loss, Take Profit and Trailing Stop in such a way so that we will scalp small but consistent profits.  No martingales needed, just a simple but ex
FREE
Trend Line Finder
Stephen Reynolds
5 (1)
Trend Line Finder will project forward a support and resistance lines using 2 previous highs for resistance and 2 previous lows for support.  It will then signal to the trader by alert making the trader more aware that a possible good move is about to happen.     This is not a stand-alone trading system but is very useful in finding key areas of support resistance levels where price will usually either rebound from or breakthrough. Its down to the trader to decide what to do with use of other s
FREE
The Hi Lo Breakout is taken from the concept of the ZZ Scalper EA which exploits the inevitable behaviour of price fluctuations and breakouts.  The fact that because market prices will always fluctuate to higher highs before ebbing down to lower lows, breakouts will occur. But here I've added a few more filters which I see work well also as an Indicator.    Range Analysis :    When price is within a tight range this Indicator will be able to spot this and only then look for price breaks. You
FREE
Bouncing Bollinger
Stephen Reynolds
Bouncing Bollinger tells the trader when the market is about to reverse using 3 candlestick formations as well as the Directional Movement Index Indicator.    When the previous candle has dipped into the upper or lower Bollinger Band and a candle signal appears along with DMI showing un-volatile a signal occurs showing possible reversal ahead.  Features : A practical way of recognising when a new reversal is about to occur. Choose your favourite signal color. Send alerts to either your PC, eM
FREE
ZZ Scalper MT5
Stephen Reynolds
1 (1)
This EA exploits the inevitable behaviour of price fluctuations and breakouts. Because market prices will always fluctuate to higher highs before ebbing down to lower lows, breakouts of these levels will occur.   This EA will open a trade in anticipation of catching some of the profits from these breakout moves. We use the fixed exit methods of Stop Loss, Take Profit and Trailing Stop in such a way so that we will scalp small but consistent profits.  No martingales needed, just a simple but ex
FREE
Volume Analysis Trader looks at volume using a fixed average of volume. This averaging helps spot when volume is rising or declining. Also I have added volume spikes which are when volume suddenly is above the average. These help spot market reversals. This will hep a trader look for the following in their trading: Rising volume during a rally shows trend is strong. Falling volume on a rally shows trend is weakening. As a rule of thumb on daily charts if current volume is higher than yesterda
FREE
Zig Zag 123
Stephen Reynolds
Zig Zag 123 tells us when a reversal or continuation is more likely by looking at the shift in supply and demand. When this happens a signature pattern appears known as 123 (also known ABC) will often break out in direction of higher low or lower high. Stop loss and take profit levels have been added. There is a panel that shows the overall performance of your trades for if you was to use these stop loss and take profit levels.  We get alerted if a pattern 123 appears and also if the price re
FREE
Fractal Scalper
Stephen Reynolds
This trading method is inspired by Linda Bradford Raschkes 3 Little Indians pattern. Put simply we anticipate price will approach a projected line that is based upon 2 previous fractals.    If 2 previous upper fractals occur we draw an upper line projected forward. If current price approaches this line we anticipate price will keep moving towards the line and breakthrough so we buy.    If 2 previous lower fractals occur we draw a lower line projected forward. If current price approaches this
FREE
Triangular Breakout
Stephen Reynolds
The Triangular Breakout looks for when there is a volume spike followed by a 3 bar break. It then draws arrow when price breaks out of the recent high or low of the 3 bar pattern. We also look for triangles that form when price fractals converge. It also will draw arrows when price breaks out of the recent high or low of this triangle pattern. There are alerts set for when either we get a 3 bar break or triangle or when we get an arrow.   According to DOW theory triangles are really moments
FREE
Double Smoothed Stochastic is similar to Stochastic except for this Indicator we use what is called double exponentially smoothing. This will give the trader a more speedy response to price changes which tends to smooth out the erratic movements of a regular Stochastic. Double Smoothed Stochastic Calculation is :    DSS = EMA(r) (X - Lxn / Hxn - Lxn) x 100  MIT = EMA(r) (close - Ln / Hn - Ln) x 100 Ln = lowest low of n periods Hn = highest high of n periodsLxn = lowest low of the price serie
FREE
This trading method is inspired by Linda Bradford Raschkes 3 Little Indians pattern. Put simply we anticipate price will approach a projected line that is based upon 2 previous fractals.    If 2 previous upper fractals occur we draw an upper line projected forward. If current price approaches this line we anticipate price will keep moving towards the line and breakthrough so we buy.    If 2 previous lower fractals occur we draw a lower line projected forward. If current price approaches this
FREE
Triple X Scalper
Stephen Reynolds
Triple X Scalper is based on 3 types of triangular price patterns along with some volume analysis. It also must be traded at the times in day when the market is most active. The method is inspired by some of Linda Bradford Raschke's trading techniques.  The 3 price patterns are as follows :  System 1 Inside Bar = Looks for a volume spike followed by the inside bar formation. Also known as my indicator 3 Bar Break.  System 2 Triangle by Fractal = Looks for when the 2 previous highest and lowes
FREE
Break It Down
Stephen Reynolds
4.33 (3)
Break It Down is based on the Directional Movement Index and tells the trader when a market trend probably maxed out and ready to fall back. This pattern is more predictable when we apply this system only when the market is rallying but within a trading range. Because traders Sell off in fear the market often moves faster when declining! When this happens, good moves can occur. As traders are no longer interested in the trend, the volume will decline and the price will usually fall back on itsel
FREE
Midnight Scalper is based on a sound trading principle. It is made to trade during times when the market is at low volatility. From 23:00 to 00:00 is best.  It uses multiple indicators for precise entry and exits with a basic fixed stop loss and take profit as part of its money management strategy.It does not put your funds at high risk with such methods as martingale, grid, averaging positions or no stop loss trading. ECN broker is required with a tight spread and low commission. NOTE : After a
FREE
Bollinger Breakout Trader tells the trader when the market is about to breakout from a non-volatile period. Non volatility usually means its building up steam for more good moves in future. A signal is formed when this switch from non-volatile to volatile occurs. These periods are measured by both Bollinger Bands and Keltner Channels. Bollinger Bands measure the standard deviation of price from the Moving Average which results in an expanding and contracting channel. Keltner Channels are based
FREE
Break Even Trader MT5
Stephen Reynolds
4.5 (2)
With Break Even Trader placed onto your chart, it will automatically place the stop loss and take profit levels when you open a buy or sell order. And when you are in profit by the amount defined in user settings, it will automatically move your stop loss to that break even level, thereby protecting your trade from a loss. Features : Simple to trade with you just enter your trade it will place the stop loss and take profit as input in user inputs. Sends you an alert when your trade is in profit
FREE
Volume Analysis Trader looks at volume using a fixed average of volume. This averaging helps spot when volume is rising or declining. Also I have added volume spikes which are when volume suddenly is above the average. These help spot market reversals. This will hep a trader look for the following in their trading: Rising volume during a rally shows trend is strong. Falling volume on a rally shows trend is weakening. As a rule of thumb on daily charts if current volume is higher than yesterday's
FREE
The Hidden Gap
Stephen Reynolds
This EA is based on the Indice gaps between todays open price and yesturdays closing price. On Metatrader these are not shown as we only see a 24hr chart. If we want to know the gap between the open at 16:30 and yesturdays close at 23:30 on the SP500 this EA will reveal the gap. On Indices these types of Gap close approximately 60% of the time within the same day and is demonstrated on the panel which records previous gap closures and provides to the user a statistical proof of gaps closing for
FREE
Hi Lo Breakout MT5
Stephen Reynolds
A system with steady ROI > 10% a month like clockwork!  Hi Lo Breakout strategy opens and closes trades based on the time of day in relation to the highs and lows of both yesturday and today. It will then trade out these prices using the trade management settings within user inputs.    For best results see .set file at comment  no2 . Features : A purely mechanical system. Simply set and leave. No martingale or grid.    Risks are small per trade.   An optional automatic lot adjustment feature t
FREE
Trendy Trader EA
Stephen Reynolds
In the trading world a golden rule that stuck with me is "hold on to your winners and cut your losers short". This golden rule is how this EA gains a positive advantage.  The EA is based on the indicator Trendy Trader. As stated unlike a standard moving average this unique algorithm will show you a less choppy signal resulting in a smoother and easier trend to follow. Put simply when price moves above the average it signals a bullish trend and when price moves below the average it signals a b
FREE
The Hi Lo Breakout
Stephen Reynolds
The Hi Lo Breakout is taken from the concept of the ZZ Scalper EA which exploits the inevitable behaviour of price fluctuations and breakouts.  The fact that because market prices will always fluctuate to higher highs before ebbing down to lower lows, breakouts will occur. But here I've added a few more filters which I see work well also as an Indicator.    Range Analysis :    When price is within a tight range this Indicator will be able to spot this and only then look for price breaks. You
FREE
This Indicator is based on the Indice gaps between todays open price and yesturdays closing price. On Metatrader these are not shown as we only see a 24hr chart. If we want to know the gap between the open at 16:30 and yesturdays close at 23:30 on the SP500 this EA will reveal the gap. On Indices these types of Gap close approximately 60% of the time within the same day and is demonstrated on the panel which records previous gap closures and provides to the user a statistical proof of gaps clos
FREE
MA And Oscillation
Stephen Reynolds
MA And Oscillation simple system that overcomes all the market confusion by simply looking at the moving average and stochastic oscillator and signalling when the moving average and stochastic or heading in same direction. The moving average is arguably the simplest but most effective tool when trading larger timeframes. We use this and the Oscillator to time our market entry. Features : A method of simplifying a sometimes confusing market. Choose if you want to signal only when moving average
FREE
Convergence is when the higher highs and higher lows of an uptrend are also confirmed by our indicator making lower lows which helps us confirm that momentum is increasing and so the trend is likely to continue. Vice versa for a downtrend. Divergence is when we get higher highs on an uptrend but which are not supported by our indicator which makes lower highs and therefore signals the underlying momentum is failing and so a reversal might occur. Vice versa for downtrend. I have combined these me
FREE
Hi Lo Breakout
Stephen Reynolds
3 (2)
A system with steady ROI > 10% a month like clockwork!  Hi Lo Breakout strategy opens and closes trades based on the time of day in relation to the highs and lows of both yesturday and today. It will then trade out these prices using the trade management settings within user inputs.    For best results see .set file at comment  no2 . Features : A purely mechanical system. Simply set and leave. No martingale or grid.    Risks are small per trade.   An optional automatic lot adjustment feature th
FREE
Bollinger Breakout Trader
Stephen Reynolds
4 (1)
Bollinger Breakout Trader tells the trader when the market is about to breakout from a non-volatile period. Non volatility usually means its building up steam for more good moves in future. A signal is formed when this switch from non-volatile to volatile occurs. These periods are measured by both Bollinger Bands and Keltner Channels. Bollinger Bands measure the standard deviation of price from the Moving Average which results in an expanding and contracting channel. Keltner Channels are based o
FREE
DSS 2TF Trader
Stephen Reynolds
DSS is similar to Stochastic except for this Indicator we use what is called double exponentially smoothing. This will give the trader a more speedy response to price changes which tends to smooth out the erratic movements of a regular Stochastic. Because its always best to know what the larger timeframes are doing. I have adopted the tactic of overlaying the larger chart of DSS over the smaller chart to gauge whats going on overall and to pint point best entry or exit points. I have left it adj
FREE
The 3 Bar Break
Stephen Reynolds
Three Bar Break is based on one of Linda Bradford Raschke's trading methods that I have noticed is good at spotting potential future price volatility. It looks for when the 1st bar's High is less than the 3rd bar's High as well as the 1st bar's Low to be higher than the 3rd bar's Low. This then predicts the market might breakout to new levels within 2-3 of the next coming bars. It should be used mainly on the daily chart to help spot potential moves in the coming days. Features : A simple meth
FREE
필터:
리뷰 없음
리뷰 답변