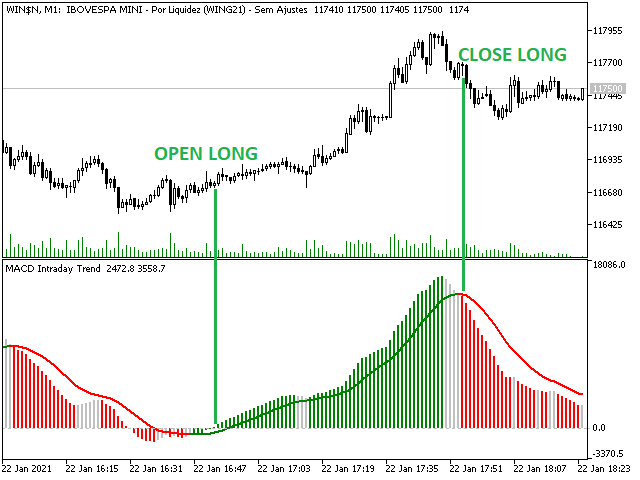
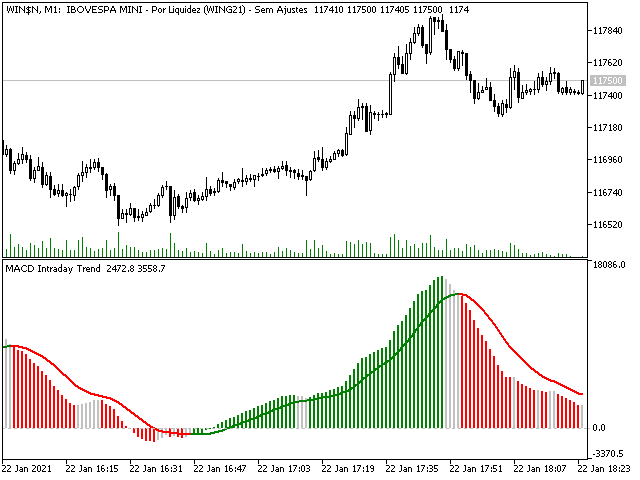
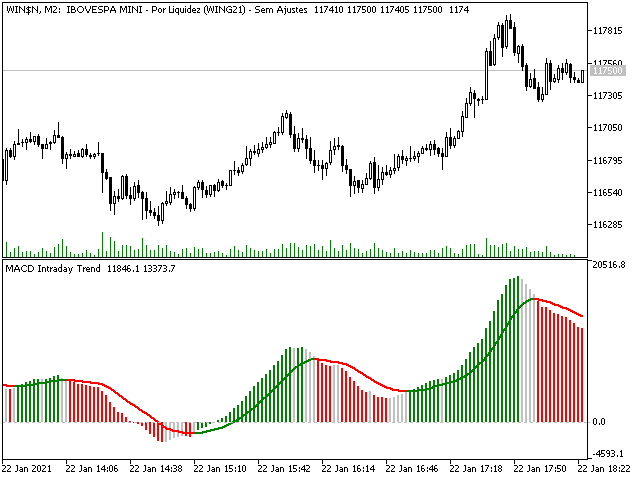
• 미리보기
  • 리뷰 (53)
  • 코멘트 (42)
  • 새 소식

MACD Intraday Trend

4.77
MACD 장중 추세는 1960년대 Gerald Appel이 만든 원본 MACD를 개조하여 개발한 지표입니다.

수년간의 거래를 통해 MACD의 매개변수를 피보나치 비율로 변경함으로써 추세 움직임의 연속성을 더 잘 표현함으로써 가격 추세의 시작과 끝을 보다 효율적으로 감지할 수 있다는 것이 관찰되었습니다.

가격 추세를 감지하는 효율성으로 인해 상단과 하단의 차이를 매우 명확하게 식별하여 거래 기회를 더 잘 활용할 수도 있습니다.

구성 가능한 기능과 경고가 있는 전문가용 버전을 사용해 보십시오: MACD Intraday Trend PRO

특징

  • 모든 통화 쌍에서 작동
  • 모든 시간대에 작동
  • Renko 차트와 함께 작동

여전히 질문이 있는 경우 다이렉트 메시지로 저에게 연락하십시오.  https://www.mql5.com/ko/users/robsjunqueira/


리뷰 20
Cynthia211
46
Cynthia211 2024.06.18 16:43 
 

感觉很不错

65638263
735
65638263 2024.04.30 00:15 
 

exelemte, muchas gracias y bendiciones

Seth Tetteh
1363
Seth Tetteh 2024.04.25 11:11 
 

great

추천 제품
Donchian Clouds
Samuel Manoel De Souza
The Indicator indicator draws 2 clouds based on Donchian Channels indicator values. The upper cloud is formed by the upper lines values and the lower cloud by the lowers lines values. The indicator allows to change the Channels parameters and the clouds colors the period of the base line and the multiplier of each Donchian Channels instance. The indicator holds 5 buffer index as follow: [0] - Outer values of the upper cloud [1]  - Inner values of the upper cloud [2]  - Base/Center line values [3
FREE
PZ Super Trend MT5
PZ TRADING SLU
4.5 (46)
A top-quality implementation of the famous Super Trend indicator, which needs no introduction. It is completely loyal to the original algorithm, and implements many other useful features such as a multi-timeframe dashboard.  [ Installation Guide | Update Guide | Troubleshooting | FAQ | All Products ] Easy to trade It implements alerts of all kinds It implements a multi-timeframe dashboard It is non-repainting and non-backpainting Input Parameters ATR Period - This is the average true range per
FREE
MACD indicators
Xiao Dong Feng
MACD indicators https://mql5.com This MACD indicator looks slightly different from the MACD indicator found in many other charting software. When the value of the signal line parameter is greater than the value of the MACD parameter, the indicator will give a buy prompt, and when the signal line parameter is less than the value of the MACD parameter, the indicator will give a sell prompt.
FREE
Curver Arrows
Francis Dube
4 (9)
This indicator is a straight port of a well known MetaTrader 4 indicator that is freely available on the Internet. It does not redraw at all. It implements a type of breakout strategy. The arrows indicate market direction. Use the indicator on M15 charts and higher. The indicator draws two bands near price action and generates signals when the price closes below the lower band and also above the upper band. The indicator uses periodic highs and lows to calculate upper and lower threshold bands.
FREE
IMA Finder MT5
Mubashir Mohamed Quraish Albarakat
1 (1)
This indicator is designed based on the Moving Origin indicator When the moving origin indicator breaks the price, this indicator gives a signal It is useful for better viewing of signals and analysis on them Attributes: Can be used in all symbols Can be used in all time frames Too many signals Simple and quick settings Easy way to work Settings: period: like moving average settings alarmShow: If you want to receive an alert in Metatrader after receiving the signal, enable this setting a
FREE
Tabajara V5
Flavio Javier Jarabeck
4.88 (42)
Metatrader 5 version of the famous Andre Machado's Tabajara indicator. If you don't know Andre Machado's Technical Analysis work you don't need this indicator... For those who need it and for those several friend traders who asked this porting from other platforms, here it is... FEATURES 8-period Moving Average 20-period Moving Average 50-period Moving Average 200-period Moving Average Colored candles according to the inflexion of the 20-period MA SETTINGS You can change the Period of all M
FREE
Auto Fibo Retracement MT5
Nguyen Tuan Son
5 (1)
Just another   Auto Fibonacci Retracement indicator . However, this is the most   Flexible   &   Reliable   one you can find for FREE. If you use this indicator and you like it, please leave a review/comment. If you are looking for a more advanced Fibo indicator, check this Free  Trend-Based Fibo indicator . ### FEATURES ### Auto-calculate up to 7 Fibonacci levels on your customized frame. Adjust levels as your need. Use High/Low price or  Open/Close price to calculate. Freeze the levels and don
FREE
Automatic Trendlines
Pasi Hakamaki
4.65 (51)
The indicator draws trendlines on chart. This indicator has six inputs. User can specify alternative labels for both lines. If multiple instances of the indicator are used, the labels must differ. User can set width and color of the lines and depth which specifies what significant peaks should be used. For example, Depth=10 sets trendlines using the current peaks and valleys that have at least 10 bars to the right and to the left and that have highs/lows less/greater than the peak's high/low. In
FREE
Price Momentum
Flavio Javier Jarabeck
4.92 (13)
Value Chart indicator presents the Price evolution in a new form. This indicator, Price Momentum , was developed taking all the calculations presented in the book " Dynamic Trading Indicators " by Mark W. Helweg and David Stendahl (2002). The technique involves de-trended Prices from a user-defined Period of analysis and the addition of a Volatility index correction. The result is an Oscillator with 3 zones: Fair Price Value, Overbought/Oversold and Extremely Overbought/Oversold zones. Adding th
FREE
Divergence Force
Alessandro Riggi
Divergence Force 다이버전스 지표 1.0 설명 Divergence Force 은 자산의 가격과 MACD(이동 평균 수렴 발산) 간의 다이버전스를 식별하기 위해 설계된 지표입니다. 이 지표는 가격과 MACD의 고점 및 저점에 자동으로 추세선을 그려 잠재적인 거래 기회를 강조합니다. 주요 기능 자동 다이버전스 식별 : 지표는 가격과 MACD 간의 강세 및 약세 다이버전스를 자동으로 감지합니다. 추세선 추적 : 가격의 연속적인 고점과 저점에 자동으로 추세선을 그리며, 이를 MACD의 고점 및 저점과 비교합니다. 매수 및 매도 신호 : 다이버전스가 식별되면 차트에 명확하게 매수("Buy") 및 매도("Sell") 신호를 표시합니다. 다이버전스가 감지되지 않으면 "Neutral"을 표시합니다. 표준 MACD 매개변수 : 표준 MACD 매개변수(12, 26, 9)를 사용하여 계산하여 신뢰할 수 있고 인식된 결과를 보장합니다. 다양한 시간대와의 호환성 : 1시간 시간대에서 작동하도록
FREE
Follow The Line MT5
Oliver Gideon Amofa Appiah
4.42 (31)
This indicator obeys the popular maxim that: "THE TREND IS YOUR FRIEND" It paints a GREEN line for BUY and also paints a RED line for SELL. (you can change the colors). It gives alarms and alerts of all kinds. IT DOES NOT REPAINT and can be used for all currency pairs and timeframes. Yes, as easy and simple as that. Even a newbie can use it to make great and reliable trades. NB: For best results, get my other premium indicators for more powerful and reliable signals. Get them here: https://www.m
FREE
Cybertrade Double Bollinger Bands - MT5  The Bollinger Bands indicator shows the levels of different highs and lows that a security price has reached in a given duration and also their relative strength, where the highs are close to the upper line and the lows are close to the lower line. Our differential is to present this indicator in a double form, with the availability of its values ​​to simplify automation. It works on periods longer than the period visible on the chart. All values ​​are
FREE
Supports And Resistances Lines
Francisco Gomes Da Silva
4.76 (41)
지원 및 저항 구역 표시기 MT5 이 표시기는 상단과 하단을 자동으로 식별하는 방법을 알고 있습니다. 이 지지선과 저항선 표시기는 상단과 하단을 기준으로 지지선과 저항선을 만듭니다. 지지선과 저항선을 만드는 방법. 자동 지지선과 저항선을 만드는 지표입니다. 지표로 지원 수준을 찾는 방법 이 표시기는 자동으로 상단과 하단을 찾습니다. 지그재그(ZigZag)가 자동으로 바닥을 생성하거나 새로운 바닥을 이전 바닥보다 낮게 만들 때마다 표시기가 자동으로 지지선을 생성하므로 표시기가 자동으로 화면에 자동 지지선을 그립니다. 저항선을 만드는 방법. 지그재그(ZigZag)가 새로운 최고점이나 최고점을 이전 최고점보다 높게 만들 때마다 표시기가 지지선을 생성하는 것과 같은 방식으로 자동으로 저항선을 생성하므로 표시기가 자동으로 새로운 저항을 생성하므로 사용자가 상단과 하단 레벨이 어디에 있는지 걱정해야 합니다. 이 지표는 트레이더가 차트에 지지와 저항을 표시할 수 있는 쉬운 방법입니다. 상단 표시
FREE
PZ Oscillator MT5
PZ TRADING SLU
3.8 (10)
This is a smooth and responsive accelerometer which reveals the market trend and strength. [ Installation Guide | Update Guide | Troubleshooting | FAQ | All Products ] Two moving averages indicate trend direction The histogram represents strength of the price movement It draws buy and sell zones as colored vertical lines Should be used as a confirmation indicator Customizable line widths and colors It implements alerts of all kinds This indicator is similar to MACD but aims to react faster t
FREE
MIDAS Super VWAP
Flavio Javier Jarabeck
4.29 (14)
Imagine VWAP, MVWAP and MIDAS in one place... Well, you found it! Now you can track the movement of Big Players in various ways, as they in general pursue the benchmarks related to this measuring, gauging if they had good execution or poor execution on their orders. Traders and analysts use the VWAP to eliminate the noise that occurs throughout the day, so they can measure what prices buyers and sellers are really trading. VWAP gives traders insight into how a stock trades for that day and deter
FREE
This indicator scans for you up to 15 trading instruments and up to 21 time frames for occurrences of the high probability reversal patterns: Double Tops/Bottoms with fake breakouts . What this indicator detects: This indicator detects a special form of Double Tops and Bottoms, so called Double Tops/Bottoms with fake breakouts . For double tops with fake breakouts the highest price of the right shoulder must be higher than the left shoulder. For double bottoms with fake breakouts the lowest pric
FREE
LT Donchian Channel
Thiago Duarte
4.75 (4)
Donchian Channel is an indicator created by Richard Donchian. It is formed by taking the highest high and the lowest low of the last specified period in candles. The area between high and low is the channel for the chosen period. Its configuration is simple. It is possible to have the average between the upper and lower lines, plus you have alerts when price hits one side. If you have any questions or find any bugs, please contact me. Enjoy!
FREE
Simple Weis Wave
Jean Jacques Huve Ribeiro
4.2 (5)
One of the best tools for analyzing volume, Weis Wave was idelized by David Weis, to facilitate the reading of directional flow. For the VSA method disciples it is an evolution of the practices created by Richard Wycoff, facilitating a predictive reading of the market, always seeking an accumulation and distribution of the negotiated contracts. Cumulative wave volume  Range of wave ( removed) Average Wave volume Ref "Tim Ord lectures" ( removed)
FREE
RSI divergence indicator finds divergences between price chart and   RSI   indicator and informs you with alerts (popup, mobile notification or email). Its main use is to find trend reversals in the chart. Always use the divergence indicators with other technical assets like support resistance zones, candlestick patterns and price action to have a higher possibility to find trend reversals. Three confirmation type for   RSI   divergences: RSI   line cross 50 level Price returns to previous H/L C
FREE
Forex Indicator Arrows
NGUYEN NGHIEM DUY
1 (1)
Forex Indicator Arrows is an arrow Indicator used as an assistant tool for your trading strategy. The indicator analyzes the standard deviation of bar close for a given period and generates a buy or sell signals if the deviation increases. It good to combo with Martingale EA to follow Trend and Sellect Buy Only/Sell Only for EA work Semi-Automatic. You can use this  Indicator with any EAs in my Products.
FREE
MP SMI for MT5
Pierre Ksachikian
The purpose of using Smart money index (SMI) or smart money flow index is to find out investors sentiment. The index was constructed by Don Hays and measures the market action. The indicator is based on intra-day price patterns. The beginning of the trading day is supposed to represent the trading by retail traders. The majority of retail traders overreact at the beginning of the trading day because of the overnight news and economic data. There is also a lot of buying on market orders and shor
FREE
Simple divergence
Vadim Zotov
5 (3)
The indicator plots a curve of the difference between the values ​​of two trading instruments (currency pairs). The purpose of the indicator is to observe the processes of divergence and convergence of the values ​​of two trading instruments. The results obtained can be used for trading strategies of statistical arbitrage, pair trading, correlation, and others. Trading strategy The indicator is attached to the chart of any trading instrument. In the input parameters, the names of trading i
FREE
Mitimom
Danil Poletavkin
The indicator is based on Robert Miner's methodology described in his book "High probability trading strategies" and displays signals along with momentum of 2 timeframes. A Stochastic oscillator is used as a momentum indicator. The settings speak for themselves period_1 is the current timeframe, 'current' period_2 is indicated - the senior timeframe is 4 or 5 times larger than the current one. For example, if the current one is 5 minutes, then the older one will be 20 minutes The rest of the
FREE
TSO Stochastic RSI MT5
Dionisis Nikolopoulos
4 (4)
Stochastic RSI makes a stochastic calculation on the RSI indicator. The Relative Strength Index (RSI) is a well known momentum oscillator that measures the speed and change of price movements, developed by J. Welles Wilder. Features Find overbought and oversold situations. Sound alert when overbought/oversold level is reached. Get email and/or push notification alerts when a signal is detected. The indicator is non-repainting. Returns buffer values for %K and %D to be used as part of an EA. (s
FREE
PZ The Zone MT5
PZ TRADING SLU
5 (1)
This indicator displays buy or sell signals according to Bill Williams' definition of the Trading Zone. [ Installation Guide | Update Guide | Troubleshooting | FAQ | All Products ] Easy to use and understand Avoid trading flat markets Deterministic indicator with clear rules The indicator is non-repainting It implements alerts of all kinds It has straightforward trading implications. A blue arrow is a buy signal A red arrow is a sell signal According to Bill Williams trading in the zone helps t
FREE
Free automatic Fibonacci is an indicator that automatically plots a Fibonacci retracement based on the number of bars you select on the BarsToScan setting in the indicator. The Fibonacci is automatically updated in real time as new highest and lowest values appears amongst the selected bars. You can select which level values to be displayed in the indicator settings. You can also select the color of the levels thus enabling the trader to be able to attach the indicator several times with differe
FREE
Money Flow Index EA Friendly
Flavio Javier Jarabeck
4.25 (4)
The traditional Money Flow Index indicator, this time, EA friendly . There are 3 buffers exposed that can be used by EAs to automatically analyze the Overbought and Oversold conditions of the quote. Just use the traditional iCustom() function to get these signals. This Money Flow Index calculation is based on the traditional Metaquote's MFI indicator. SETTINGS MFI Period Volume type to analyze (Real Volume or Ticks) Starting Overbought region Starting Oversold region USING WITH EAs Buffer
FREE
Price Retest MT5
Suvashish Halder
5 (2)
Introducing our exciting new Price Retest indicator! Get instant alerts when the price retests, giving you a powerful edge in your trading strategy. Remember to do your own analysis before making any moves in the market. MT4 Version -  https://www.mql5.com/en/market/product/118031 Here’s a detailed explanation of how the Price Retest indicator works, its components, and how you can incorporate it into your trading strategy: The Price Retest indicator is designed to notify traders when the price
FREE
Super Trend eu
Emin Ulucanli
4.75 (4)
SUPERTREND; It is a trend following indicator based on the SuperTrend ATR created by Olivier Seban. It can be used to detect changes in trend direction and locate stops. When the price falls below the indicator curve, it turns red and indicates a downtrend. Conversely, when the price moves above the curve, the indicator turns green, indicating an uptrend. Like other indicators, it works well on SuperTrend when used in conjunction with other indicators such as MACD, parabolik SAR, Bollinger Band
FREE
Live Sup Res MT5
Claudia Ramona Angerer
4.88 (8)
Identification of support and resistance areas A useful indicator for traders completely free Can be used in all symbols Can be used in all time frames It has three different trends: short term, medium term, long term Settings: Clr1,2: You can change the color of the lines Type Trend: You can determine the trend Message me for questions, criticism and suggestions
FREE
이 제품의 구매자들이 또한 구매함
Atomic Analyst MT5
Issam Kassas
4.78 (18)
우선적으로 언급할 점은이 거래 지표가 다시 그리지 않고 지연되지 않으며 이를 통해 수동 및 로봇 거래 모두에 이상적이라는 점입니다. 사용자 매뉴얼: 설정, 입력 및 전략. Atomic Analyst는 가격의 강도와 모멘텀을 활용하여 시장에서 더 나은 이점을 찾는 PA Price Action Indicator입니다. 고급 필터를 장착하여 잡음과 거짓 신호를 제거하고 거래 잠재력을 높이는 데 도움이 됩니다. 복잡한 지표의 다중 레이어를 사용하여 Atomic Analyst는 차트를 스캔하고 복잡한 수학적 계산을 간단한 신호와 색상으로 변환하여 초보 트레이더가 이해하고 일관된 거래 결정을 내릴 수 있도록합니다. "Atomic Analyst"는 새로운 및 경험이 풍부한 트레이더를위한 종합적인 거래 솔루션입니다. 프리미엄 지표와 최고 수준의 기능을 하나의 거래 전략에 결합하여 모든 종류의 트레이더에 대한 다재다능한 선택지가되었습니다. 인트라데이 거래 및 스캘핑 전략 : 빠르고 정확한
우선 이 거래 시스템이 리페인팅, 리드로잉 및 레이그 인디케이터가 아니라는 점을 강조하는 것이 중요합니다. 이는 수동 및 로봇 거래 모두에 이상적인 것으로 만듭니다. 온라인 강좌, 설명서 및 프리셋 다운로드. "스마트 트렌드 트레이딩 시스템 MT5"은 새로운 및 경험이 풍부한 트레이더를 위해 맞춤형으로 제작된 종합적인 거래 솔루션입니다. 10개 이상의 프리미엄 인디케이터를 결합하고 7개 이상의 견고한 거래 전략을 특징으로 하여 다양한 시장 조건에 대한 다목적 선택이 가능합니다. 트렌드 추종 전략: 효과적인 트렌드 추이를 타기 위한 정확한 진입 및 손절 관리를 제공합니다. 반전 전략: 잠재적인 트렌드 반전을 식별하여 트레이더가 범위 시장을 활용할 수 있게 합니다. 스캘핑 전략: 빠르고 정확한 데이 트레이딩 및 단기 거래를 위해 설계되었습니다. 안정성: 모든 인디케이터가 리페인팅, 리드로잉 및 레이그가 아니므로 신뢰할 수 있는 신호를 보장합니다. 맞춤화: 개별 거래 선호도를 고려한 맞춤
Quantum Trend Sniper
Bogdan Ion Puscasu
4.92 (48)
소개       Quantum Trend Sniper Indicator는   추세 반전을 식별하고 거래하는 방식을 변화시키는 획기적인 MQL5 지표입니다! 13년 이상의 거래 경험을 가진 숙련된 트레이더 팀이 개발한       Quantum Trend Sniper 표시기       매우 높은 정확도로 추세 반전을 식별하는 혁신적인 방법으로 거래 여정을 새로운 차원으로 끌어올리도록 설계되었습니다. ***Quantum Trend Sniper Indicator를 구입하면 Quantum Breakout Indicator를 무료로 받을 수 있습니다!*** Quantum Trend Sniper Indicator는 추세 반전을 식별하고 세 가지 이익실현 수준을 제안할 때 경고, 신호 화살표를 제공합니다. 초보자 거래자와 전문 거래자 모두에게 적합합니다. Quantum EA 채널:       여기를 클릭하세요 MT4 버전:       여기를 클릭하세요
Gold Stuff mt5
Vasiliy Strukov
4.9 (182)
Gold Stuff mt5는 금을 위해 특별히 설계된 추세 지표이며 모든 금융 상품에서도 사용할 수 있습니다. 표시기가 다시 그려지지 않고 지연되지 않습니다. 권장 기간 H1. 설정 및 개인 보너스를 받으려면 구매 후 즉시 저에게 연락하십시오!     강력한 지원 및 트렌드 스캐너 표시기의 무료 사본을 받으실 수 있습니다. 메시지를 보내주세요. 나!   설정 화살표 그리기 - 켜기 끄기. 차트에 화살표 그리기. 경고 - 가청 경고를 끕니다. 이메일 알림 - 켜기 끄기. 이메일 알림. Puch-notification - 켜기 끄기. 푸시 알림. 다음으로 색 영역을 조정합니다. Gold Stuff mt5는 금을 위해 특별히 설계된 추세 지표이며 모든 금융 상품에서도 사용할 수 있습니다. 표시기가 다시 그려지지 않고 지연되지 않습니다. 권장 기간 H1. 설정 및 개인 보너스를 받으려면 구매 후 즉시 저에게 연락하십시오!   설정 화살표 그리기 - 켜기 끄기. 차트에
TPSproTREND PrO MT5
Roman Podpora
4.89 (9)
TPSpro TREND PRO  - is a trend indicator that automatically analyzes the market and provides information about the trend and each of its changes, as well as giving signals for entering trades without redrawing! The indicator uses each candle, analyzing them separately. referring to different impulses - up or down impulse. Exact entry points into transactions for currencies, crypto, metals, stocks, indices!  Version MT4               DETAILED DESCRIPTION               R ecommended to use with an
TPSpro RFI Levels MT5
Roman Podpora
4.67 (9)
Reversal First Impulse levels (RFI)      INSTRUCTIONS        RUS       -       ENG              R ecommended to use with an indicator   -   TPSpro  TREND PRO -  Version MT4                 A key element in trading is zones or levels from which decisions to buy or sell a trading instrument are made. Despite attempts by major players to conceal their presence in the market, they inevitably leave traces. Our task was to learn how to identify these traces and interpret them correctly. Main functi
Atbot
Zaha Feiz
4.89 (9)
AtBot: 작동 방식 및 사용 방법 ### 작동 방식 MT5 플랫폼용 "AtBot" 지표는 기술 분석 도구의 조합을 사용하여 매수 및 매도 신호를 생성합니다. 01:37 단순 이동 평균(SMA), 지수 이동 평균(EMA), 평균 진폭 범위(ATR) 지수를 통합하여 거래 기회를 식별합니다. 또한 Heikin Ashi 캔들을 사용하여 신호의 정확성을 향상시킬 수 있습니다. 구매 후 리뷰를 남기면 특별 보너스 선물을 받게 됩니다. ### 주요 기능: - 비재표시: 신호는 플로팅 후 변경되지 않습니다. - 비재작성: 신호는 일관되며 변경되지 않습니다. - 지연 없음: 지연 없이 시기적절한 신호를 제공합니다. - 다양한 시간대: 거래 전략에 맞게 모든 시간대에서 사용할 수 있습니다. ### 운영 단계: #### 입력 및 설정: - firstkey (TrendValue): 추세 감지의 민감도를 조정합니다. - Secondkey (SignalValue): 매수/매도 신호 생성의 민감도를 정의
Trend Screener Pro MT5
STE S.S.COMPANY
4.88 (67)
트렌드 표시기, 트렌드 트레이딩 및 필터링을 위한 획기적인 고유 솔루션, 하나의 도구 안에 내장된 모든 중요한 트렌드 기능! Forex, 상품, 암호 화폐, 지수 및 주식과 같은 모든 기호/도구에 사용할 수 있는 100% 다시 칠하지 않는 다중 시간 프레임 및 다중 통화 표시기입니다. Trend Screener는 차트에 점이 있는 화살표 추세 신호를 제공하는 효율적인 지표 추세 추종 지표입니다. 추세 분석기 표시기에서 사용할 수 있는 기능: 1. 트렌드 스캐너. 2. 최대 이익 분석이 있는 추세선. 3. 추세 통화 강도 측정기. 4. 경고가 있는 추세 반전 점. 5. 경고가 있는 강력한 추세 점. 6. 추세 화살표 Trend Screener Indicator가 있는 일일 분석 예, 일일 신호 성능...등은 여기에서 찾을 수 있습니다. 여기를 클릭하십시오. LIMITED TIME OFFER : Trend Screener Indicator는 50$ 및 평생 동안만 사용할 수 있습니다
우선적으로, 이 거래 도구는 전문적인 거래에 이상적인 비-다시 그리기 및 지연되지 않는 지표입니다.  온라인 강좌, 사용자 매뉴얼 및 데모. 스마트 가격 액션 컨셉트 인디케이터는 신규 및 경험 많은 트레이더 모두에게 매우 강력한 도구입니다. Inner Circle Trader Analysis 및 Smart Money Concepts Trading Strategies와 같은 고급 거래 아이디어를 결합하여 20가지 이상의 유용한 지표를 하나로 결합합니다. 이 인디케이터는 스마트 머니 컨셉트에 중점을 두어 대형 기관의 거래 방식을 제공하고 이동을 예측하는 데 도움을 줍니다.  특히 유동성 분석에 뛰어나 기관이 어떻게 거래하는지 이해하는 데 도움을 줍니다. 시장 트렌드를 예측하고 가격 변동을 신중하게 분석하는 데 탁월합니다. 귀하의 거래를 기관 전략에 맞추어 시장의 동향에 대해 더 정확한 예측을 할 수 있습니다. 이 인디케이터는 시장 구조를 분석하고 중요한 주문 블록을 식별하
이 대시보드는 선택한 심볼에 대해 사용 가능한 최신 고조파 패턴을 표시하므로 시간을 절약하고 더 효율적으로 사용할 수 있습니다 /   MT4 버전 . 무료 인디케이터:   Basic Harmonic Pattern 인디케이터 열 Symbol :   선택한 심볼이 나타납니다 Trend :   강세 또는 약세 Pattern :   패턴 유형(가틀리, 나비, 박쥐, 게, 상어, 사이퍼 또는 ABCD) Entry :   진입 가격 SL:   스톱로스 가격 TP1:   1차 테이크프로핏 가격 TP2:   2차 테이크프로핏 가격 TP3:   3차 테이크프로핏 가격 Current price:   현재 가격 Age (in bars):   마지막으로 그려진 패턴의 나이 주요 입력 Symbols :   "28개 주요 통화쌍" 또는 "선택한 심볼" 중에서 선택합니다. Selected Symbols :   쉼표로 구분하여 모니터링하려는 원하는 심볼("EURUSD,GBPUSD,XAUUSD")
AT Forex Indicator MT5
Marzena Maria Szmit
5 (4)
The AT Forex Indicator MT5 is a sophisticated trading tool designed to provide traders with a comprehensive analysis of multiple currency pairs. This powerful indicator simplifies the complex nature of the forex market, making it accessible for both novice and experienced traders. AT Forex Indicator uses advanced algorithms to detect trends, patterns and is an essential tool for traders aiming to enhance their forex trading performance. With its robust features, ease of use, and reliable signal
PZ Harmonacci Patterns MT5
PZ TRADING SLU
3.25 (4)
Trade smarter, not harder: Empower your trading with Harmonacci Patterns Special Offer: Purchase now to receive free bonuses worth $165! (Read more for details) This is arguably the most complete harmonic price formation auto-recognition indicator you can find for the MetaTrader Platform. It detects 19 different patterns, takes fibonacci projections as seriously as you do, displays the Potential Reversal Zone (PRZ) and finds suitable stop-loss and take-profit levels. [ Installation Guide | Up
Trend Forecaster
Alexey Minkov
5 (6)
The Trend Forecaster indicator utilizes a unique proprietary algorithm to determine entry points for a breakout trading strategy. The indicator identifies price clusters, analyzes price movement near levels, and provides a signal when the price breaks through a level. The Trend Forecaster indicator is suitable for all financial assets, including currencies (Forex), metals, stocks, indices, and cryptocurrencies. You can also adjust the indicator to work on any time frames, although it is recommen
XQ Indicator MetaTrader 5
Marzena Maria Szmit
5 (1)
Step into the realm of Forex trading with confidence and precision using XQ, a cutting-edge Forex indicator designed to elevate your trading game to unprecedented heights. Whether you're a seasoned trader or just stepping into the world of currency exchange, XQ Forex Indicator empowers you with the insights and signals needed to make informed trading decisions. The signal conditions are a combination of three indicators, and XQ Forex Indicator only display  medium and long-term trends . The ind
Gartley Hunter Multi
Siarhei Vashchylka
5 (8)
Gartley Hunter Multi - An indicator for searching for harmonic patterns simultaneously on dozens of trading instruments and on all possible timeframes. Manual (Be sure to read before purchasing) | Version for MT4 Advantages 1. Patterns: Gartley, Butterfly, Shark, Crab. Bat, Alternate Bat, Deep Crab, Cypher 2. Simultaneous search for patterns on dozens of trading instruments and on all possible timeframes 3. Search for patterns of all possible sizes. From the smallest to the largest 4. A
AW Trend Predictor MT5
AW Trading Software Limited
4.78 (58)
하나의 시스템에서 추세와 고장 수준의 조합입니다. 고급 지표 알고리즘은 시장 노이즈를 필터링하고 추세, 진입점 및 가능한 출구 수준을 결정합니다. 표시기 신호는 통계 모듈에 기록되어 가장 적합한 도구를 선택하여 신호 기록의 효율성을 보여줍니다. 이 표시기는 이익 실현 및 손절매 표시를 계산합니다. 매뉴얼 및 지침 ->   HERE   / MT4 버전 ->   HERE 지표로 거래하는 방법: Trend Predictor로 거래하는 것은 3단계로 간단합니다. 1단계 - 포지션 열기 70% 이상의 성공률로 매수 신호를 받았습니다. 2단계 - StopLoss 결정 반대 신호로 트렁크 선택 3단계 - 이익 실현 전략 정의 전략 1: TP1 도달 시 전체 포지션 청산 전략 2: TP1 도달 시 포지션의 50% 청산 및 TP2 도달 시 나머지 50% 청산 전략 3: 추세 반전 시 전체 포지션 청산 이익: 결과를 다시 그리지 않음, 신호는 엄격하게 양초가 닫힐 때 어드바이저에서 사용할 수 있습니
IX Power MT5
Daniel Stein
4.17 (6)
IX Power는   마침내 FX Power의 탁월한 정밀도를 외환이 아닌 기호에도 적용했습니다. 좋아하는 지수, 주식, 원자재, ETF, 심지어 암호화폐까지 단기, 중기, 장기 추세의 강도를 정확하게 파악할 수 있습니다. 단말기가 제공하는   모든 것을 분석할   수 있습니다. 사용해 보고 트레이딩   타이밍이 크게 향상되는   것을 경험해 보세요. IX Power 주요 특징 단말기에서 사용 가능한 모든 거래 심볼에 대해 100% 정확한 비재도장 계산 결과 제공 사전 구성 및 추가적으로 개별 구성 가능한 강도 분석 기간의 드롭다운 선택 가능 이메일, 메시지, 모바일 알림을 통한 다양한 알림 옵션 제공 EA 요청을 위한 액세스 가능한 버퍼 더 나은 성능을 위한 사용자 지정 가능한 계산 한도 더 많은 것을 보고 싶은 사용자를 위한 특별 다중 인스턴스 설정 모든 차트에서 좋아하는 색상을 위한 무한한 그래픽 설정 가능 Windows 11 및 macOS 스타일의 둥
Entry Points Pro for MT5
Yury Orlov
4.56 (162)
다시 색을 칠하지 않고 거래에 진입할 수 있는 정확한 신호를 제공하는 MT5용 지표입니다. 외환, 암호화폐, 금속, 주식, 지수 등 모든 금융 자산에 적용할 수 있습니다. 매우 정확한 추정값을 제공하고 매수와 매도의 가장 좋은 시점을 알려줍니다. 하나의 시그널로 수익을 내는 지표의 예와 함께 비디오 (6:22)시청하십시오! 대부분의 거래자는 Entry Points Pro 지표의 도움으로 첫 거래 주 동안 트레이딩 결과를 개선합니다. 저희의   Telegram Group 을 구독하세요! Entry Points Pro 지표의 좋은점. 재도색이 없는 진입 신호 신호가 나타나고 확인되면(시그널 캔들이 완성된 경우) 신호는 더 이상 사라지지 않습니다. 여타 보조지표의 경우 신호를 표시한 다음 제거되기 때문에 큰 재정적 손실로 이어집니다. 오류 없는 거래 게시 알고리즘을 통해 트레이드(진입 또는 청산)를 할 이상적인 순간을 찾을 수 있으며, 이를 통해 이를 사용하는 모든 거래자의
PZ Swing Trading MT5
PZ TRADING SLU
5 (4)
Protect against whipsaws: revolutionize your swing trading approach Special Offer: Purchase now to receive free bonuses worth $159! (Read more for details) Swing Trading is the first indicator designed to detect swings in the direction of the trend and possible reversal swings. It uses the baseline swing trading approach, widely described in trading literature. The indicator studies several price and time vectors to track the aggregate trend direction and detects situations in which the market i
Bill Williams Advanced
Siarhei Vashchylka
5 (7)
Bill Williams Advanced is designed for automatic chart analysis using Bill Williams' "Profitunity" system. The indicator analyzes four timeframes at once. Manual (Be sure to read before purchasing) Advantages 1. Automatically analyzes the chart using the "Profitunity" system of Bill Williams. The found signals are placed in a table in the corner of the screen. 2. Equipped with a trend filter based on the Alligator indicator. Most of the system signals are recommended to be used only accordi
FX Power MT5 NG
Daniel Stein
5 (6)
모닝 브리핑 여기 mql5 와 텔레그램에서 FX Power MT5 NG 는 오랫동안 인기 있는 통화 강도 측정기인 FX Power의 차세대 버전입니다. 이 차세대 강도 측정기는 무엇을 제공합니까? 기존 FX Power에서 좋아했던 모든 것 PLUS GOLD/XAU 강도 분석 더욱 정밀한 계산 결과 개별 구성 가능한 분석 기간 더 나은 성능을 위한 사용자 정의 가능한 계산 한도 특별 멀티더 많은 것을보고 싶은 사람들을위한 특별한 다중 인스턴스 설정 모든 차트에서 좋아하는 색상을위한 끝없는 그래픽 설정 수많은 알림 옵션, 중요한 것을 다시는 놓치지 않도록 Windows 11 및 macOS 스타일의 둥근 모서리가 있는 새로운 디자인 마법처럼 움직이는 인디케이터 패널 FX 파워 키 특징 모든 주요 통화의 완전한 강세 이력 모든 시간대에 걸친 통화 강세 이력 모든 브로커 및 차트에서 고유 계산 결과 100% 신뢰할 수있는 실시간100 % 신뢰할 수있는 실시간 계산-> 다시 칠하지 않음
ICT, SMC, SMART MONEY CONCEPTS, SMART MONEY, Smart Money Concept, Support and Resistance, Trend Analysis, Price Action, Market Structure, Order Blocks, BOS/CHoCH,   Breaker Blocks ,  Momentum Shift,   Supply&Demand Zone/Order Blocks , Strong Imbalance,   HH/LL/HL/LH,    Fair Value Gap, FVG,  Premium  &   Discount   Zones, Fibonacci Retracement, OTE, Buy Side Liquidity, Sell Side Liquidity, BSL/SSL Taken, Equal Highs & Lows, MTF Dashboard, Multiple Time Frame, BigBar, HTF OB, HTF Market Structure
가격이 역전되고 후퇴함에 따라 시장 구조가 변경됩니다. 시장 구조 반전 경고 표시기는 추세 또는 가격 움직임이 고갈에 가까워지고 반전할 준비가 되었음을 식별합니다. 일반적으로 반전이나 큰 하락이 일어나려고 할 때 발생하는 시장 구조의 변화를 알려줍니다. 지표는 가능한 고갈 지점 근처에서 새로운 고점 또는 저점이 형성될 때마다 초기에 돌파와 가격 모멘텀을 식별합니다. 표시기는 반대쪽에 있는 마지막 촛불에 직사각형을 그립니다. 그런 다음 현재의 단기 추세에서 계속 움직이기 때문에 가격과 함께 직사각형을 따라갈 것입니다. 가격이 사각형 위나 아래로 다시 닫힐 정도로 약해지면 시장 구조에 잠재적인 변화가 일어나고 있음을 나타냅니다. 그런 다음 표시기는 방향의 잠재적인 이동과 추세 또는 주요 하락의 가능한 반전 시작에 대해 경고합니다. 작동 방식을 보려면 아래의 작동 표시기를 참조하십시오! 모든 쌍 및 주요 기간을 모니터링하는 대시보드: https://www.mql5.com/
FX Volume MT5
Daniel Stein
4.94 (17)
모닝 브리핑을 통해 세부 정보와 스크린샷으로 매일 시장 업데이트를 받으세요 여기 mql5 및 텔레그램에서 FX 거래량은 브로커의 관점에서 시장 심리에 대한 실제 통찰력을 제공하는 최초이자 유일한 거래량 지표입니다. 브로커와 같은 기관 시장 참여자가 외환 시장에서 어떤 포지션을 취하고 있는지에 대한 훌륭한 통찰력을 COT 보고서보다 훨씬 빠르게 제공합니다. 차트에서 이 정보를 직접 확인하는 것은 트레이딩의 진정한 판도를 바꾸고 획기적인 솔루션입니다. 다음과 같은 고유한 시장 데이터 인사이트의 이점 비율 는 통화의 매수/매도 포지션 비율을 백분율로 표시 비율 변화 는 선택한 기간 내 매수 비율과 비율 변화를 표시 총 거래량 는 해당 통화의 총 거래량(롱 및 숏)을 로트 단위로 보여줍니다 Volumes Long 는 해당 통화의 모든 롱 포지션의 거래량을 보여줍니다 Volumes Short 는 해당 통화의 모든 숏 포지션의 거래량을 보여줍니다 Net Long 는 순 롱 포지션의 거래량
Automated Trendlines MT5
Georgios Kalomoiropoulos
추세선은 외환 거래에서 기술적 분석의 가장 필수적인 도구입니다. 불행히도, 대부분의 거래자는 올바르게 그리지 않습니다. 자동 추세선 표시기는 시장의 추세 움직임을 시각화하는 데 도움이 되는 진지한 거래자를 위한 전문 도구입니다. 추세선 강세 추세선과 약세 추세선에는 두 가지 유형이 있습니다. 상승 추세에서 Forex 추세선은 가격 움직임의 가장 낮은 스윙 포인트를 통해 그려집니다. 최소 두 개의 "최저 저점"을 연결하면 추세선이 생성됩니다. 하락 추세에서 추세선은 가격 움직임의 가장 높은 스윙 포인트를 통해 그려집니다. 최소 두 개의 "최고 최고점"을 연결하면 추세선이 생성됩니다. 추세선이 깨질 때? 강세 추세선은 약세 양초가 강세 추세선 아래에서 닫히고 양초의 고점이 추세선 위에 있을 때 깨집니다. 약세 추세선은 강세 양초가 약세 추세선 위로 마감되고 양초 저점이 추세선 아래에 있을 때 깨집니다. 추세선이 삭제되면? 강세 추
Trend Line Map Pro MT5
STE S.S.COMPANY
4.36 (11)
트렌드 라인 맵 표시기는 트렌드 스크리너 표시기의 애드온입니다. Trend screener(Trend Line Signals)에 의해 생성된 모든 신호에 대한 스캐너로 작동합니다. Trend Screener Indicator 기반의 Trend Line Scanner입니다. Trend Screener Pro 표시기가 없으면 Trend Line Map Pro가 작동하지 않습니다. It's a Trend Line Scanner based on Trend Screener Indicator. If you don't have Trend Screener Pro Indicator,     the Trend Line Map Pro will not work . MQL5 블로그에 액세스하여 추세선 지도 표시기의 무료 버전을 다운로드할 수 있습니다. Metatrader Tester 제한 없이 구매하기 전에 사용해 보십시오. : 여기를 클릭하세요 1. 쉽게 얻을 수 있는 이점 통화 및
Legacy of Gann for MT5
Pavel Zamoshnikov
5 (6)
The indicator very accurately determines the levels of the possible end of the trend and profit fixing. The method of determining levels is based on the ideas of W.D.Gann, using an algorithm developed by his follower Kirill Borovsky. Extremely high reliability of reaching levels (according to K. Borovsky  - 80-90%) Indispensable for any trading strategy – every trader needs to determine the exit point from the market! Precisely determines targets on any timeframes and any instruments (forex, met
MTF Supply Demand Zones MT5
Georgios Kalomoiropoulos
5 (1)
자동화된 수요 및 공급 구역의 차세대. 모든 차트에서 작동하는 새롭고 혁신적인 알고리즘. 모든 구역은 시장의 가격 움직임에 따라 동적으로 생성됩니다. 두 가지 유형의 경고 --> 1)가격이 영역에 도달할 때 2)새로운 영역이 형성될 때 당신은 더 이상 쓸모없는 지표를 얻을 수 없습니다. 입증된 결과로 완벽한 거래 전략을 얻을 수 있습니다.     새로운 기능:     가격이 공급/수요 영역에 도달하면 경고     새로운 공급/수요 구역이 생성되면 알림     푸시 알림 알림     핍의 영역 너비 레이블     기동특무부대에 한 번 더 시간이 주어집니다. 따라서 현재보다 위의 2개의 시간 프레임 대신 현재보다 높은 3개의 시간 프레임을 볼 수 있습니다.     Alerts/Zones/MTF 기능을 활성화/비활성화하는 버튼 당신이 얻는 이점:     거래에서 감정을 제거하십시오.     거래 항목을 객
Trend Sensor MT5
Yuriy Lyachshenko
인디케이터는 가장 적절한 진입 및 청산 지점을 보여줍니다. 또한 더 나은 거래 분석을 위해 모든 신호에 대한 통계 데이터를 표시합니다. 이 지표의 도움으로 시장을 더 잘 이해할 수 있습니다. 추세의 힘이 약해지기 시작하면 (패널에 표시됨) 추세선이 수평 위치로 끌리게되며 이것이 거래를 종료하라는 신호입니다. 또는 평균 / 중간 수익 수준에 도달하면 종료 할 수 있습니다. 이 인디케이터는 2010년 이후 제 트레이딩 경험의 결과입니다. MT4용 인디케이터 버전 특징 이 인디케이터는 다시 그려지지 않습니다. 과거 차트에 인쇄된 내용도 실시간으로 인쇄됩니다. 암호화폐, 주식, 금속, 지수, 원자재, 통화 등 모든 자산 거래에 사용할 수 있습니다. 모든 차트주기에 사용할 수 있습니다. 진입 신호는 새 캔들이 열릴 때 나타납니다. 거래 종료 신호는 더 큰 수익으로 거래를 종료할 수 있는 경우가 많기 때문에 잠정적으로 제공됩니다. 왼쪽 상단에는 최소화 할 수있는 자세한 거래 통
IVISTscalp5
Vadym Zhukovskyi
5 (5)
당신에게 소개하는 iVISTscalp5 지표는 독특하면서도 거래 작업에서 효과적입니다. 이 지표는 시간 데이터를 기반으로 하며 금융 시장의 많은 경험과 깊은 분석의 결과입니다. iVISTscalp5 지표는 수동 거래에 뛰어난 도구입니다. 편리성, 간단함 및 시각화 - 모든 복잡성은 숨겨져 있습니다. 우리는 iVISTscalp5 지표의 설정과 사용을 최대한 단순화했습니다. 이 지표는 MT5 터미널에서 가지고 있는 모든 금융 상품에 적합합니다. 시간 기준으로 작동하는 시간은 4am에서 8pm (UTC+3)입니다. iVISTscalp5 지표 메뉴 (스크린샷 1 참조): History - 표시할 주간 수 계산 dT_min - 시간 설정 간격 선택 (분) TFline - 수평 볼륨 생성 (타임프레임) BARSline - 수평 볼륨 생성 (바 수) TFtrend1 - 매일 채널 생성 (타임프레임) BARStrend1 - 매일 채널 생성 (바 수) TFtrend2 - 주간 채널 생성 (타임프레임
제작자의 제품 더 보기
Candle Timer Countdown
JETINVEST
4.77 (70)
캔들 타이머 카운트다운은 현재 막대가 닫히고 새 막대가 형성되기까지 남은 시간을 표시합니다. 시간 관리에 사용할 수 있습니다. MT4 버전은 여기 ! 기능 하이라이트 현지 시간이 아닌 서버 시간을 추적합니다. 구성 가능한 텍스트 색상 및 글꼴 크기 기호 일일 변동의 선택적 시각화 CPU 사용량을 줄이기 위해 최적화 입력 매개변수 일별 편차 표시: 참/거짓 텍스트 글꼴 크기 텍스트 색상 여전히 질문이 있는 경우 다이렉트 메시지로 저에게 연락하십시오.   https://www.mql5.com/ko/users/robsjunqueira/ 이것이 우리가 지속적으로 발전 할 수있는 유일한 방법이기 때문에 개선을위한 제안에 부담없이 문의하십시오. 또한 당사의 다른 지표 및 전문 고문에 대해 알아보십시오. 다양한 유형의 자산을 거래할 수 있는 다양한 상품이 있음을 알 수 있습니다.
FREE
캔들 타이머 카운트다운은 현재 막대가 닫히고 새 막대가 형성되기까지 남은 시간을 표시합니다. 시간 관리에 사용할 수 있습니다. MT5 버전은 여기 ! 기능 하이라이트 현지 시간이 아닌 서버 시간을 추적합니다. 구성 가능한 텍스트 색상 및 글꼴 크기 기호 일일 변동의 선택적 시각화 CPU 사용량을 줄이기 위해 최적화 입력 매개변수 일별 편차 표시: 참/거짓 텍스트 글꼴 크기 텍스트 색상 여전히 질문이 있는 경우 다이렉트 메시지로 저에게 연락하십시오.   https://www.mql5.com/ko/users/robsjunqueira/ 이것이 우리가 지속적으로 발전 할 수있는 유일한 방법이기 때문에 개선을위한 제안에 부담없이 문의하십시오. 또한 당사의 다른 지표 및 전문 고문에 대해 알아보십시오. 다양한 유형의 자산을 거래할 수 있는 다양한 상품이 있음을 알 수 있습니다.
FREE
Tabajara VWAP Ogro RSJ
JETINVEST
4.83 (36)
Setup Tabajara는 "월스트리트의 OGRO"로 알려진 브라질 상인이 만들었습니다. 이 설정의 아이디어는 거래자에게 현재 가격 추세와 그래프에서 찾아야 하는 작업 유형을 나타내는 것입니다. 작업 이것은 오전 10시 40분까지 양초와 VWAP를 닫는 위치를 지정하고 그 이후에 4가지 색상으로 양초를 칠하는 20주기의 산술 평균으로 수행합니다. 녹색 -> 가격 상승 추세 (구매 진입점 검색) 검은색 -> 강세 추세에서 가격 수정(구매 진입점 검색) 빨간색 -> 하락 추세에 있는 가격 (매도 진입점 검색) 흰색 -> 하락세 시 가격 조정 (판매 진입점 검색) 또한 스크립트에 다음 표시기를 넣었습니다. 8 기간의 지수 평균: 단기 가격 움직임 식별 50개 기간의 산술 평균: 중기 가격 움직임 식별 80 기간의 지수 평균: 중기 가격 움직임 식별 200개 기간의 산술 평균: 장기 가격 움직임 식별 여전히 질문이 있는 경우 다이렉트 메시지로 저에게 연락하십시오: https:
FREE
Pivot Point Fibo RSJ
JETINVEST
4.33 (18)
피봇 포인트 Fibo RSJ는 피보나치 비율을 사용하여 당일의 지지선과 저항선을 추적하는 지표입니다. 이 멋진 지표는 피보나치 비율을 사용하여 피벗 포인트를 통해 최대 7단계의 지지와 저항을 생성합니다. 가격이 작업의 가능한 진입/종료 지점을 인식할 수 있는 이 지원 및 저항의 각 수준을 어떻게 존중하는지 환상적입니다. 특징 최대 7단계 지원 및 7단계 저항 레벨의 색상을 개별적으로 설정 입력 피벗 유형 피벗 피보 RSJ1 = 피보 비율 1 계산 피벗 피보 RSJ2 = 피보 비율 2 계산 피벗 Fibo RSJ3 = Fibo 비율 3 계산 피벗 피보 클래식 = 클래식 피벗 계산 최소 피벗 수준 피벗 3 레벨 피벗 4 레벨 피벗 5 레벨 6단계 피벗 피벗 7 레벨 여전히 질문이 있는 경우 다이렉트 메시지로 저에게 연락하십시오: https://www.mql5.com/ko/users/robsjunqueira/
FREE
캔들 카운터는 그 날의 첫 캔들부터 캔들 개수를 출력하는 인디케이터입니다. 오늘의 첫 번째 양초는 숫자 1이 되며 새 양초는 이 개수에서 1씩 증가합니다. 입력 매개변수 짝수, 홀수 또는 모두에서 선택 촛불에서 숫자 인쇄까지의 거리 텍스트 글꼴 크기 텍스트 글꼴 색상 여전히 질문이 있는 경우 다이렉트 메시지로 저에게 연락하십시오.   https://www.mql5.com/ko/users/robsjunqueira/ ----------------- 이것이 우리가 지속적으로 발전 할 수있는 유일한 방법이기 때문에 개선을위한 제안에 부담없이 문의하십시오. 또한 당사의 다른 지표 및 전문 고문에 대해 알아보십시오. 다양한 유형의 자산을 거래할 수 있는 다양한 상품이 있음을 알 수 있습니다.
FREE
MACD Intraday Trend PRO는 1960년대 Gerald Appel이 만든 원본 MACD를 개조하여 개발한 지표입니다. 수년간의 거래를 통해 MACD의 매개변수를 피보나치 비율로 변경함으로써 추세 움직임의 연속성을 더 잘 표현함으로써 가격 추세의 시작과 끝을 보다 효율적으로 감지할 수 있다는 것이 관찰되었습니다. 가격 추세를 감지하는 효율성으로 인해 상단과 하단의 차이를 매우 명확하게 식별하여 거래 기회를 더 잘 활용할 수도 있습니다. 특징 표시기 MACD Intraday Trend PRO는 모든 통화 쌍, 모든 시간대 및 Renko 차트에서 작동합니다. 5가지 모드를 선택하여 추세 감지 속도를 설정할 수 있습니다. 가장 빠른 빠른 정상 느린 가장 느림 자원 6개의 구성 가능한 경고가 있습니다. MACD는 신호 라인에서 후퇴 MACD가 신호선을 넘다 MACD는 레벨 0을 교차 신호선이 레벨 0을 넘습니다. MACD 변경 트렌드 색상 신호선 변경 TRE
MACD Intraday Trend MT4
JETINVEST
4.61 (18)
MACD 장중 추세는 1960년대 Gerald Appel이 만든 원본 MACD를 개조하여 개발한 지표입니다. 수년간의 거래를 통해 MACD의 매개변수를 피보나치 비율로 변경함으로써 추세 움직임의 연속성을 더 잘 표현함으로써 가격 추세의 시작과 끝을 보다 효율적으로 감지할 수 있다는 것이 관찰되었습니다. 가격 추세를 감지하는 효율성으로 인해 상단과 하단의 차이를 매우 명확하게 식별하여 거래 기회를 더 잘 활용할 수도 있습니다. 구성 가능한 기능과 경고가 있는 전문가용 버전을 사용해 보십시오:   MACD Intraday Trend PRO 특징 모든 통화 쌍에서 작동 모든 시간대에 작동 Renko 차트와 함께 작동 여전히 질문이 있는 경우 다이렉트 메시지로 저에게 연락하십시오.   https://www.mql5.com/ko/users/robsjunqueira/
FREE
Weis Waves RSJ
JETINVEST
4.67 (9)
The Weis Waves RSJ Indicator sums up volumes in each wave. This is how we receive a bar chart of cumulative volumes of alternating waves. Namely the cumulative volume makes the Weis wave charts unique. It allows comparing the relation of the wave sequence characteristics, such as correspondence of the applied force (expressed in the volume) and received result (the price progress). If you still have questions, please contact me by direct message:  https://www.mql5.com/en/users/robsjunqueira/
FREE
피봇 포인트 Fibo RSJ는 피보나치 비율을 사용하여 당일의 지지선과 저항선을 추적하는 지표입니다. 이 멋진 지표는 피보나치 비율을 사용하여 피벗 포인트를 통해 최대 7단계의 지지와 저항을 생성합니다. 가격이 작업의 가능한 진입/종료 지점을 인식할 수 있는 이 지원 및 저항의 각 수준을 어떻게 존중하는지 환상적입니다. 특징 최대 7단계 지원 및 7단계 저항 레벨의 색상을 개별적으로 설정 입력 피벗 유형 피벗 피보 RSJ1 = 피보 비율 1 계산 피벗 피보 RSJ2 = 피보 비율 2 계산 피벗 Fibo RSJ3 = Fibo 비율 3 계산 피벗 피보 클래식 = 클래식 피벗 계산 최소 피벗 수준 피벗 3 레벨 피벗 4 레벨 피벗 5 레벨 6단계 피벗 피벗 7 레벨 여전히 질문이 있는 경우 다이렉트 메시지로 저에게 연락하십시오: https://www.mql5.com/ko/users/robsjunqueira/
FREE
Tabajara Ogro
JETINVEST
4.75 (12)
Setup Tabajara was created by a Brazilian trader known as  "The OGRO of Wall Street" . The idea of this setup is to indicate to the trader the current trend of prices and  the type of operation should be looked for in the graph. Operation It does this through the relation of the closing price position and the     of 20 periods, by painting the candles in 4 possible colors : Green -> Price rising in upward trend (Search entry points for PURCHASE) Black -> Price correcting in Bullish Trend
FREE
VWAP Fibo Bands RSJ
JETINVEST
4.91 (11)
VWAP Fibo Bands RSJ is an indicator that traces the lines of the daily VWAP and from it creates bands using Fibonacci proportions. This spectacular indicator creates 10 band levels through the selected VWAP period using Fibonacci ratios. It is fantastic how the prices respect each level of the bands, where it is possible to realize that almost every time the price closes above / below a level of the bands he will seek the next one. If close above will seek to reach the level above and if close
FREE
Vwap RSJ
JETINVEST
4.93 (14)
VWAP RSJ is an indicator that plots the Hourly, Daily, Weekly and Monthly  VWAP Lines. Large institutional buyers and   mutual funds   use the VWAP ratio to help move into or out of stocks with as small of a market impact as possible. Therefore, when possible, institutions will try to buy below the VWAP, or sell above it. This way their actions push the price back toward the average, instead of away from it. Based on this information I developed this indicator that combines 4 types of VWAP T
FREE
This simple indicator paints with a darker color on the volume bar when the quantity traded is above the average of select number of periods of the volume itself, highlighting the moments when there was a large volume of deals above the average. It is also possible to use a configuration of four colors where the color tone shows a candle volume strength. The indicator defaults to the simple average of 20 periods, but it is possible to change to other types of averages and periods. If you like
FREE
Aggression Wave RSJ
JETINVEST
4.38 (8)
This indicator sums up the difference between the sells aggression and the buys aggression that occurred in each Candle, graphically plotting the waves of accumulation of the aggression volumes.   Through these waves an exponential average is calculated that indicates the direction of the business flow. Note: This indicator DOES NOT WORK for Brokers and/or Markets WITHOUT the type of aggression (BUY or SELL).   Be sure to try our Professional version with configurable features and alerts:  Agr
FREE
Funcionamento: O Painel  Netting Panel RSJ  funciona com   qualquer ativo   e em   qualquer tempo gráfico . Ele funciona em contas do tipo " Netting " e " Hedge ", mas gerencia apenas uma posição por ativo, por isso o nome   Netting.   Se ele for executado em contas do tipo " Hedge ", ele fará o gerenciamento e proteção   apenas da posição mais antiga , ou seja, da primeira posição que foi aberta por ele. Em contas " Netting " quando os botões " SELL " ou " BUY " forem pressionados,   ocorrer
FREE
This indicator calculates the difference between the SELL aggression and the BUY aggression that occurred in each Candle, plotting the balance of each one graphically. Note: This indicator DOES NOT WORK for Brokers and/or Markets WITHOUT the type of aggression (BUY or SELL). Be sure to try our   Professional   version with configurable features and alerts:   Delta Agression Volume PRO Settings Aggression by volume (Real Volume) or by number of trades (Tick Volume) Start of the Aggression De
FREE
Volume By Color RSJ
JETINVEST
4.5 (4)
This simple indicator paints with a darker color on the volume bar when the quantity traded is above the average of select number of periods of the volume itself, highlighting the moments when there was a large volume of deals above the average. It is also possible to use a configuration of four colors where the color tone shows a candle volume strength. The indicator defaults to the simple average of 20 periods, but it is possible to change to other types of averages and periods. If you like
FREE
RENKO PRICE ACTION ATR은 각 BRICK이 사용자가 선택한 기간의 ATR을 통해 계산된 크기를 갖는 Renko Chart의 구성을 통해 개발된 "Expert Advisor"입니다. Renko 차트는 사소한 가격 변동을 걸러내도록 설계되어 거래자가 중요한 추세에 더 쉽게 집중할 수 있습니다. 가격 추세를 감지하는 효율성으로 인해 지지와 저항, 상단 및 하단 다이버전스를 명확하게 식별하여 거래 기회를 더 잘 활용할 수도 있습니다. 작업 RENKO PRICE ACTION ATR은 모든 통화 쌍에서 작동합니다. RENKO PRICE ACTION ATR은 실시간 업데이트 성능이 뛰어납니다. 설정 ATR 계산 기간: RENKO PRICE ACTION ATR이 ATR의 평균을 적용하고 각 BRICK의 크기를 계산/재계산하기 위해 사용자가 선택한 기간입니다. ATR 계산 평균 기간: 각 BRICK에 대한 크기 계산을 수행하기 위해 RENKO PRICE ACTION ATR에
지표 공급 수요 RSJ PRO는 그래프에 "공급" 및 "수요" 영역을 계산하고 표시하여 영역 유형(약함, 강함, 확인됨, 입증됨)을 식별하고 영역을 다시 테스트하는 경우 몇 번인지 보여줍니다. 재시험했다. "공급" 구역은 수요보다 공급이 더 많이 발생하여 가격을 낮추는 가격 구역입니다. "수요" 구역은 공급보다 많은 수요가 발생하여 가격을 상승시키는 가격 구역입니다. 구성 가능한 기능 및 경고가 포함된 전문가용 버전을 사용해 보십시오: Suppy Demand RSJ PRO 구역 분류 약함: 다시 테스트할 경우 위반될 가능성이 있는 가격 영역입니다. 강함: 추세의 방향을 변경했고 그렇게 빨리 재시험될 가능성이 없는 가격 영역. 검증됨: 최대 1~3번의 재테스트가 있었지만 가격이 해당 영역을 깰 수 없는 강한 가격 영역. 입증됨: 3회 이상의 재시험이 있었지만 가격이 해당 지역을 돌파하지 못한 강한 가격 영역. Broken/Turncoat: 지지의 경우 저항이 되고 지지
MACD Intraday Trend PRO는 1960년대 Gerald Appel이 만든 원본 MACD를 개조하여 개발한 지표입니다. 수년간의 거래를 통해 MACD의 매개변수를 피보나치 비율로 변경함으로써 추세 움직임의 연속성을 더 잘 표현함으로써 가격 추세의 시작과 끝을 보다 효율적으로 감지할 수 있다는 것이 관찰되었습니다. 가격 추세를 감지하는 효율성으로 인해 상단과 하단의 차이를 매우 명확하게 식별하여 거래 기회를 더 잘 활용할 수도 있습니다. 특징 표시기 MACD Intraday Trend PRO는 모든 통화 쌍, 모든 시간대 및 Renko 차트에서 작동합니다. 5가지 모드를 선택하여 추세 감지 속도를 설정할 수 있습니다. 가장 빠른 빠른 정상 느린 가장 느림 자원 6개의 구성 가능한 경고가 있습니다. MACD는 신호 라인에서 후퇴 MACD가 신호선을 넘다 MACD는 레벨 0을 교차 신호선이 레벨 0을 넘습니다. MACD 변경 트렌드 색상 신호선 변경 TRE
Aggression Wave PRO is an indicator developed to monitor the divergence, strength, and continuity of the aggression volume of sell and buy negotiations.  The  Agrression Wave PRO   has features that allow you to view beyond the accumulated delta volume of the day. Note: This indicator DOES NOT WORK for Brokers and/or Markets WITHOUT the type of aggression (BUY or SELL). Cryptocurrencies and Forex do not provide this type of information, that is, it does not work with it. Operation It is pos
Delta Aggression Volume PRO is an indicator developed to monitor the strength and continuity of the aggression volume of sell and buy negotiations. Note: This indicator DOES NOT WORK for Brokers and/or Markets WITHOUT the type of aggression (BUY or SELL). Cryptocurrencies and Forex do not provide this type of data, that is, it does not work with them. O Delta Agrression Volume PRO has features that allow you to view beyond the delta volume of the day. Operation Multi symbols  (those who pro
지표 공급 수요 RSJ PRO는 그래프에 "공급" 및 "수요" 영역을 계산하고 표시하여 영역 유형(약함, 강함, 확인됨, 입증됨)을 식별하고 영역을 다시 테스트하는 경우 몇 번인지 보여줍니다. 재시험했다. "공급" 구역은 수요보다 공급이 더 많이 발생하여 가격을 낮추는 가격 구역입니다. "수요" 구역은 공급보다 많은 수요가 발생하여 가격을 상승시키는 가격 구역입니다. 구역 분류 약함: 다시 테스트할 경우 위반될 가능성이 있는 가격 영역입니다. 강함: 추세의 방향을 변경했고 그렇게 빨리 재시험될 가능성이 없는 가격 영역. 검증됨: 최대 1~3번의 재테스트가 있었지만 가격이 해당 영역을 깰 수 없는 강한 가격 영역. 입증됨: 3회 이상의 재시험이 있었지만 가격이 해당 지역을 돌파하지 못한 강한 가격 영역. Broken/Turncoat: 지지의 경우 저항이 되고 지지의 경우 저항이 되는 깨지는 가격 영역입니다. 설정 시각적 설정: 약한 영역 표시: 약한 영역으로 분류된 영역이 표시
Trend WDO B3
JETINVEST
5 (2)
Trend WDO B3는 MT5 플랫폼용으로 제작된 전문 거래 시스템으로 BRAZIL B3의 MINI DOLAR INDEX(WDO)와 함께 작동하도록 최적화되어 있습니다. 시스템은 여러 시간대(1M, 5M, 15M, 30M, H1, H4, D1)에서 Fuzzy Logic을 사용하여 계산에 따라 각 시간대에 가중치를 적용하여 가격 추세를 식별합니다. 추세를 파악한 후 시스템은 평균 변동성에 따라 STOP 주문(BUY 또는 SELL)을 포지셔닝하고, 포지션이 열리면 EA는 항상 이익 극대화를 추구하는 트레일링 스톱(trailing stop)을 통해 거래를 수행합니다. 주요 특징 마틴게일을 사용하지 않음 그리드를 사용하지 않음 Fuzzy 알고리즘으로 계산된 추세를 그래프에 표시 모든 시간대에 작동 구성 가능한 운영 시간 구성 가능한 개방 GAP 제어 구성 가능한 로트 증대 동적 모드 4개의 구성 가능한 트레일링 스톱 레벨 제품 설명서와 동영상이 있는 블로그에 접속하여 더 자세한 정
Trend WIN B3
JETINVEST
5 (4)
Trend WIN B3는 MT5 플랫폼용으로 제작된 전문 거래 시스템으로 BRAZIL B3의 MINI FUTURE INDEX(WIN)와 함께 작동하도록 최적화되어 있습니다. 시스템은 여러 시간대(1M, 5M, 15M, 30M, H1, H4, D1)에서 Fuzzy Logic을 사용하여 계산에 따라 각 시간대에 가중치를 적용하여 가격 추세를 식별합니다. 추세를 파악한 후 시스템은 평균 변동성에 따라 STOP 주문(BUY 또는 SELL)을 포지셔닝하고, 포지션이 열리면 EA는 항상 이익 극대화를 추구하는 트레일링 스톱(trailing stop)을 통해 거래를 수행합니다. 주요 특징 마틴게일을 사용하지 않음 그리드를 사용하지 않음 Fuzzy 알고리즘으로 계산된 추세를 그래프에 표시 모든 시간대에 작동 구성 가능한 운영 시간 구성 가능한 개방 GAP 제어 구성 가능한 로트 증대 동적 모드 4개의 구성 가능한 트레일링 스톱 레벨 제품 설명서와 동영상이 있는 블로그에 접속하여 더 자세한
SniperBot EURUSD
JETINVEST
5 (1)
EA는 변동성, 스프레드, 빈도 및 타이밍을 사용하여 거래 시기를 결정합니다. EA는 지정가 주문 방법을 사용하여 포지션을 엽니다. 이 경우 Slippage는 항목을 실행할 때 기껏해야 긍정적일 것입니다. EA는 시스템의 초점이 자본을 보호하면서 돈을 버는 것이므로 Trailing Take Profit 논리를 사용합니다. 대부분의 거래는 저격 헤드샷처럼 빠르게 마감됩니다. 주요 특징 마틴게일을 사용하지 않습니다 그리드를 사용하지 않음 최적화된 통화 쌍: EURUSD 기간: M5 주의 사항: 이 EA는 롤오버 전 몇 분부터 롤오버 후 몇 분까지 하루에 일정 범위의 시간 동안만 거래합니다. .set 파일이 필요하지 않으며 모든 설정이 EA에 저장됩니다. 브로커가 접미사(예: XXXXXX.a)를 사용하는 경우 EA가 자동으로 식별하므로 걱정하지 않아도 됩니다. 설치하는 방법 이 시스템은 독립형이며 VPS에서 지속적으로 실행되어야 합니다. 낮은 스프레드 ECN 브로커에서 EA를
Sniper Major
JETINVEST
5 (1)
EA는 변동성, 스프레드, 빈도 및 타이밍을 사용하여 거래 시기를 결정합니다. EA는 지정가 주문 방법을 사용하여 포지션을 엽니다. 이 경우 Slippage는 항목을 실행할 때 기껏해야 긍정적일 것입니다. EA는 시스템의 초점이 자본을 보호하면서 돈을 버는 것이므로 Trailing Take Profit 논리를 사용합니다. 대부분의 거래는 저격 헤드샷처럼 빠르게 마감됩니다. 주요 특징 마틴게일을 사용하지 않습니다 그리드를 사용하지 않음 최적화된 통화 쌍: EURUSD | GBPUSD | 엔엔 | USDCHF 기간: M5 주의 사항: 이 EA는 롤오버 전 몇 분부터 롤오버 후 몇 분까지 하루에 일정 범위의 시간 동안만 거래합니다. 하나의 차트 설정: 모든 최적화된 기호를 거래하려면 하나의 차트만 있으면 됩니다. 여러 통화 쌍 지원 .set 파일이 필요하지 않으며 모든 설정이 EA에 저장됩니다. 브로커가 접미사(예: XXXXXX.a)를 사용하는 경우 EA가 자동으로 식별하므로 걱정하
JetBot
JETINVEST
This is an EXPERT with a FOCUS on LEARNING and PROFESSIONAL DEVELOPMENT!!! The idea of this product is to commercialize the source code, allowing those who want to develop their own robots, or start a professional activity developing customized experts, to have a reference source code that helps them in the learning and development process. This source code will be increased, that is, new functionalities will be created, thus allowing the project to continue evolving. For every 10 sales a new v
필터:
Cynthia211
46
Cynthia211 2024.06.18 16:43 
 

感觉很不错

JETINVEST
263686
개발자의 답변 Roberto Sant Ana Junqueira 2024.06.20 16:55
Tks for your feedback......take a look into our PRO version
Race Elizabeth
46
Race Elizabeth 2024.05.07 07:50 
 

사용자가 평가에 대한 코멘트를 남기지 않았습니다

65638263
735
65638263 2024.04.30 00:15 
 

exelemte, muchas gracias y bendiciones

JETINVEST
263686
개발자의 답변 Roberto Sant Ana Junqueira 2024.04.30 03:47
Tks for your feedback......take a look into our PRO version
Seth Tetteh
1363
Seth Tetteh 2024.04.25 11:11 
 

great

JETINVEST
263686
개발자의 답변 Roberto Sant Ana Junqueira 2024.04.25 11:14
Tks for your feedback......take a look into our PRO version
frankdupo
36
frankdupo 2023.12.26 19:04 
 

MUY BUENO

JETINVEST
263686
개발자의 답변 Roberto Sant Ana Junqueira 2023.12.26 19:05
Tks for your feedback......take a look into our PRO version
kanatk
16
kanatk 2023.12.20 13:50 
 

başarılı..

JETINVEST
263686
개발자의 답변 Roberto Sant Ana Junqueira 2023.12.20 14:19
Tks for your feedback......take a look into our PRO version
WILIAN1914 FRANÇA
18
WILIAN1914 FRANÇA 2023.11.22 22:24 
 

Fantastico , meus Parabens pela otimizaçao !

JETINVEST
263686
개발자의 답변 Roberto Sant Ana Junqueira 2023.11.22 22:30
Obrigado pelo review. Da uma olhada em nossa versão PRO
ertezca
15
ertezca 2023.10.25 15:19 
 

harika

JETINVEST
263686
개발자의 답변 Roberto Sant Ana Junqueira 2023.10.25 15:21
Tks for your feedback......take a look into our PRO version
amin13eko
434
amin13eko 2023.10.17 18:15 
 

excellent

JETINVEST
263686
개발자의 답변 Roberto Sant Ana Junqueira 2023.10.17 18:21
Tks for your feedback......take a look into our PRO version
90066880
44
90066880 2023.09.02 15:37 
 

good thanks

JETINVEST
263686
개발자의 답변 Roberto Sant Ana Junqueira 2023.09.04 11:39
Tks for your feedback......take a look into our PRO version
シーズ★ドン★
16
シーズ★ドン★ 2023.07.19 10:05 
 

It's a very good indicator because you can intuitively see the trend.

JETINVEST
263686
개발자의 답변 Roberto Sant Ana Junqueira 2023.07.19 11:40
Tks for your feedback......take a look into our PRO version
Franck Martin
88496
Franck Martin 2023.05.30 09:49 
 

Very good indicator, thank you. I use it to confirm my signal strategy, I increased profits.

JETINVEST
263686
개발자의 답변 Roberto Sant Ana Junqueira 2023.05.30 12:26
Tks for your feedback......take a look into our PRO version
Ng Eric
63
Ng Eric 2023.05.15 17:48 
 

Great Indicator. I would love to get an EA based on this indicator. Can you develop it?

JETINVEST
263686
개발자의 답변 Roberto Sant Ana Junqueira 2023.05.15 17:58
Tks for your feedback......take a look into our PRO version......Yes I can...please call me on private message
Cacobr
14
Cacobr 2023.05.08 19:07 
 

Very good, excellent job.

JETINVEST
263686
개발자의 답변 Roberto Sant Ana Junqueira 2023.05.09 01:58
Tks for your feedback......take a look into our PRO version
mauricio_mpm
24
mauricio_mpm 2023.05.05 01:19 
 

Não consegui alterar os períodos das médias móveis. Aparentemente existe uma configuração padrão.

JETINVEST
263686
개발자의 답변 Roberto Sant Ana Junqueira 2023.05.05 01:34
Olá Maurício, este MACD não é configurável. O cálculo é feito automaticamente.
torontofss84lh
14
torontofss84lh 2023.02.02 03:25 
 

Super indico

JETINVEST
263686
개발자의 답변 Roberto Sant Ana Junqueira 2023.02.02 10:47
Tks for your feedback......take a look into our PRO version
natkul
14
natkul 2023.01.29 12:51 
 

Very good, thank you

JETINVEST
263686
개발자의 답변 Roberto Sant Ana Junqueira 2023.01.30 11:19
Tks for your feedback......take a look into our PRO version
Yulius Wi
28
Yulius Wi 2023.01.22 11:15 
 

Very good, thank you 👍👍

JETINVEST
263686
개발자의 답변 Roberto Sant Ana Junqueira 2023.01.23 11:10
Tks for your feedback......take a look into our PRO version
JOHN Cletus
76
JOHN Cletus 2022.12.16 05:11 
 

it's good.

JETINVEST
263686
개발자의 답변 Roberto Sant Ana Junqueira 2022.12.16 11:06
Tks for your feedback......take a look into our PRO version
Lalit Kumar
207
Lalit Kumar 2022.12.01 12:54 
 

Thank you so much !!!!

JETINVEST
263686
개발자의 답변 Roberto Sant Ana Junqueira 2022.12.01 13:58
Tks for your feedback......take a look into our PRO version
123
리뷰 답변
버전 3.0 2021.06.05
BUG correction
버전 2.0 2021.02.14
Improvements were made to the graphical presentation of the histogram.