Visual Macd Signals
- 지표
- Florin Selea
- 버전: 1.5
- 활성화: 10
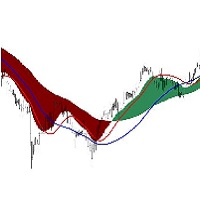
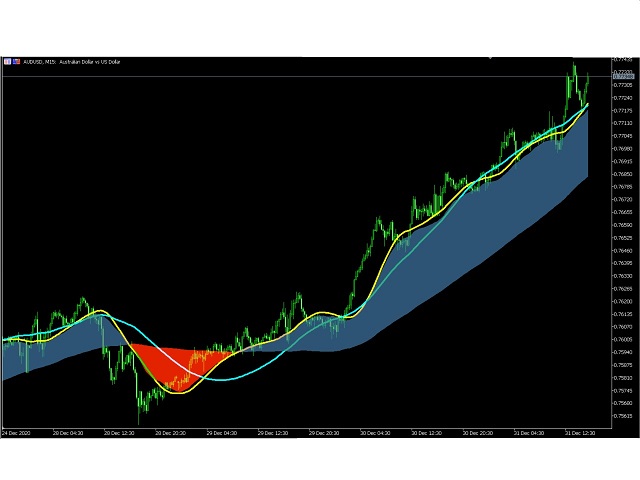
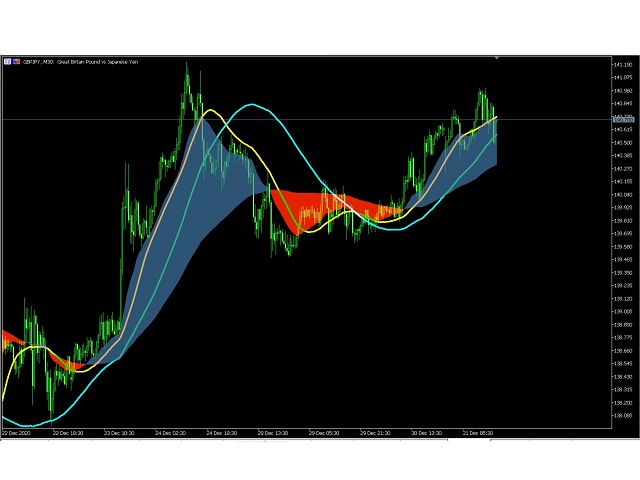
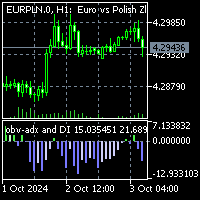
The Visual MACD Indicator is a forex technical analysis tool based on Moving Average Convergence Divergence, but it is plotted directly on the main trading chart with two macd signals.
You should look for buy trades after the yellow line crosses the blue line and the MACD wave is blue.
Similarly, you should look for sell trades after the yellow line crosses the blue when the MACD wave is red
and the price is below the blue line .
Go ahead and add it to your best trading system.
It fits all kinds of timeframes and currency pairs.
The default indicator settings can be modified directly from the input tab.
Feel free to experiment with the settings and parameters to fit your personal preferences


