Trend on market
- 지표
- Makarii Gubaydullin
- 버전: 1.0
- 활성화: 10
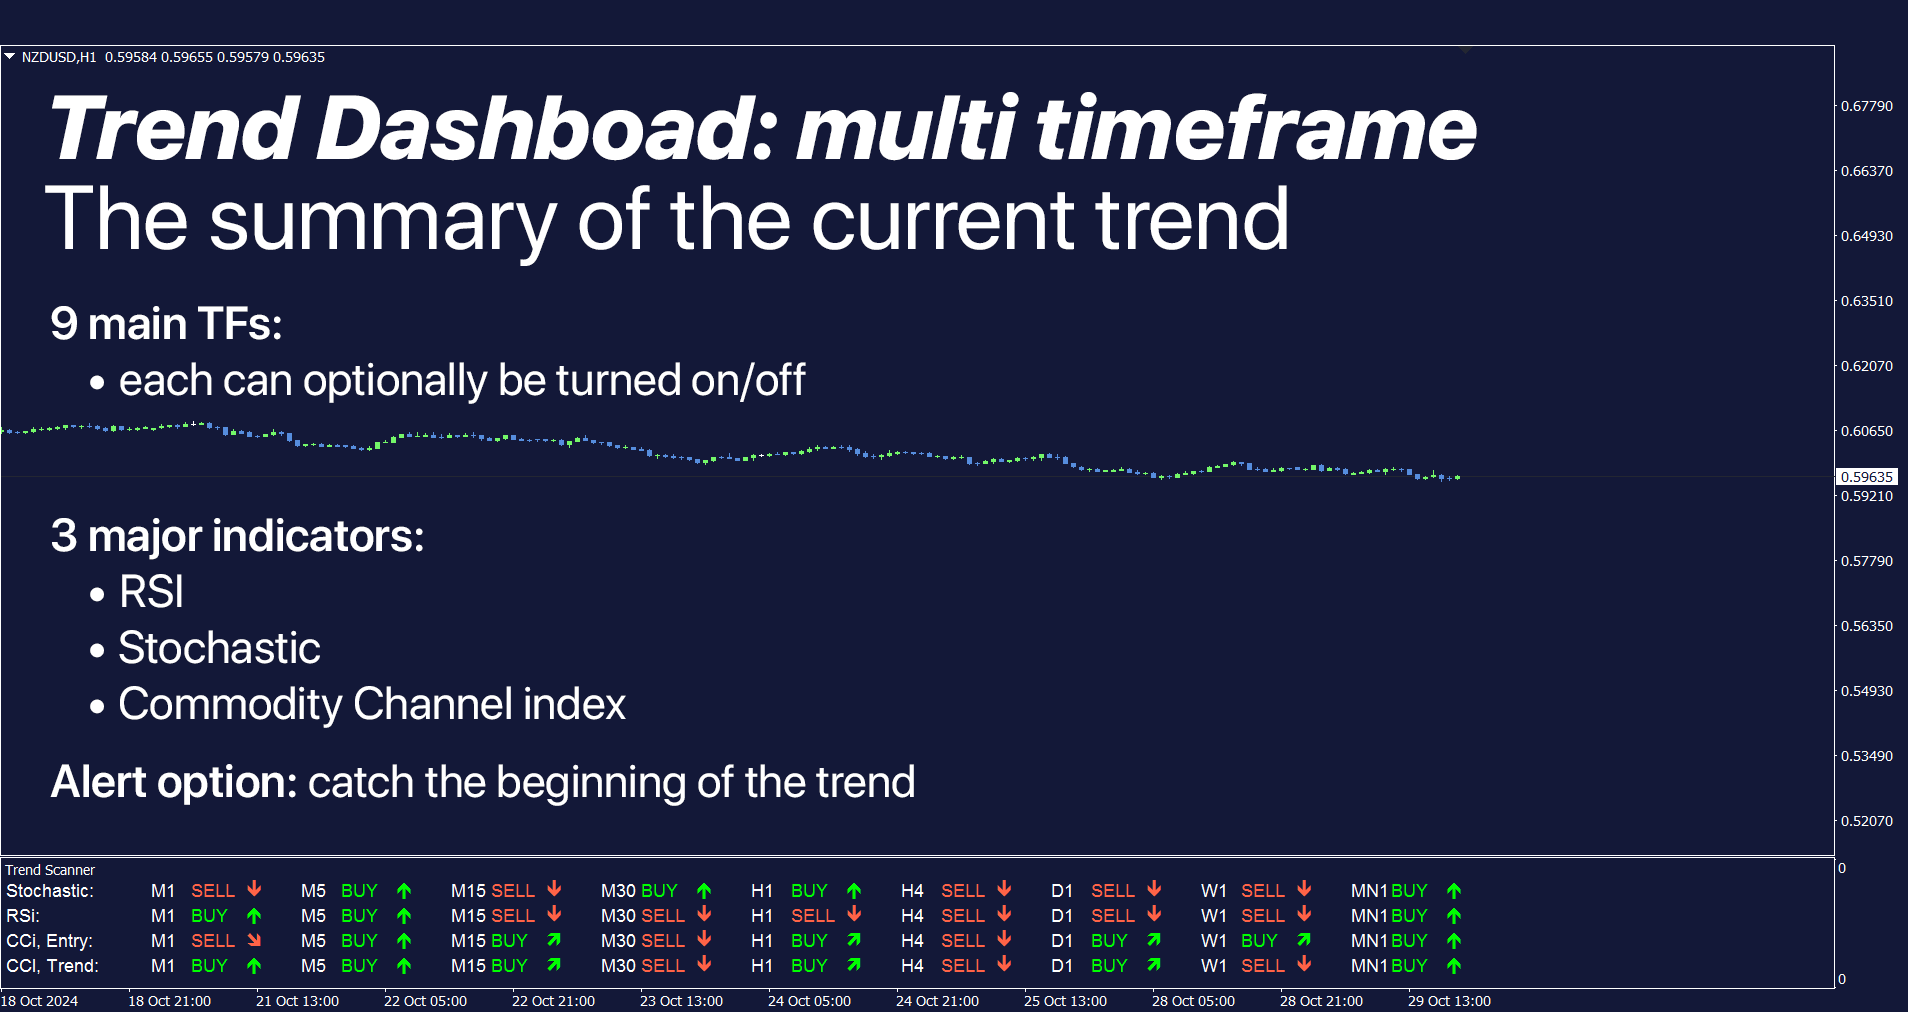
트렌드 대시보드: 멀티 타임프레임 지표, 현재 트렌드 요약 표시
이 도구는 3가지 주요 지표를 기반으로 합니다: RSI, 스토캐스틱 및 CCI.
알림 옵션은 트렌드의 시작을 놓치지 않도록 도와줍니다.
다양한 옵션을 통해 필요에 따라 지표를 사용자 지정할 수 있습니다.
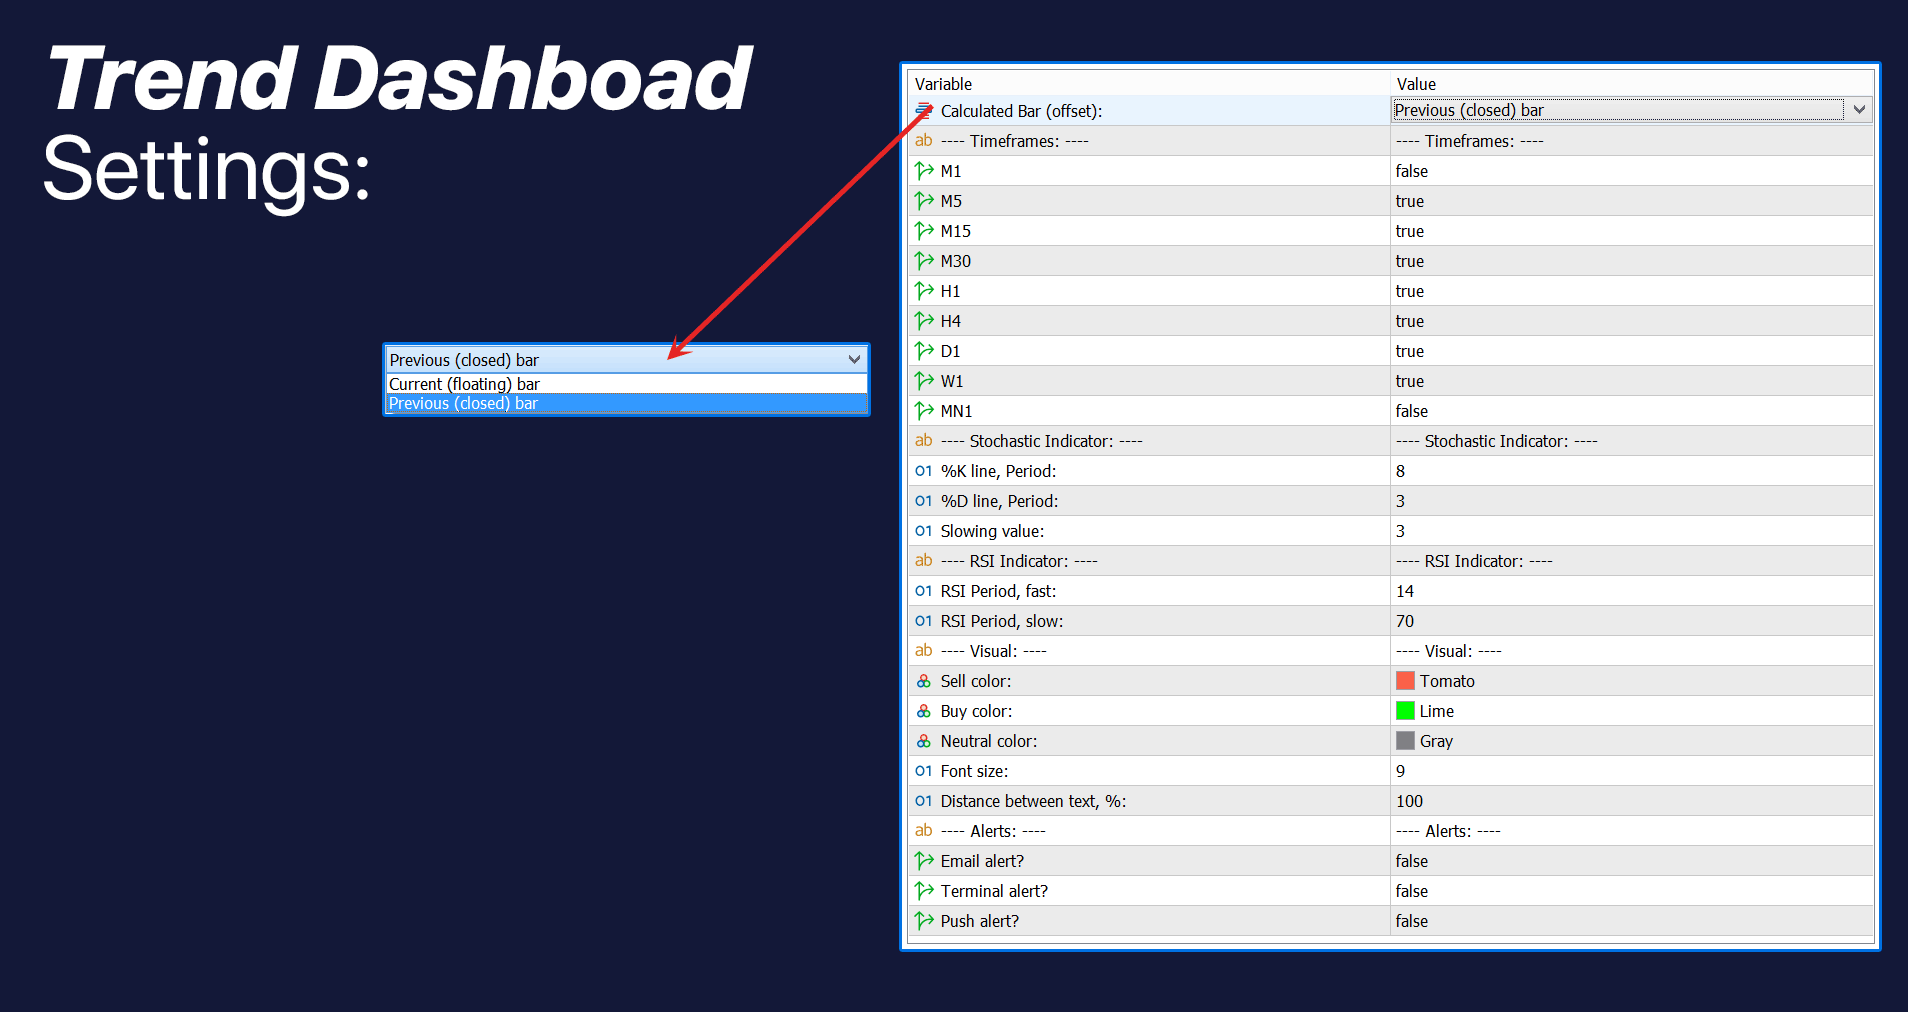
설정:
- 계산 바: 현재(변동) 또는 이전(종료).
- 9가지 주요 시간 프레임 사용 가능: 각 시간 프레임은 선택적으로 켜거나 끌 수 있습니다.
- 스토캐스틱 지표:
- %K 라인 기간;
- %D 라인 기간;
- 슬로우 값;
- RSI 지표:
- 빠른 기간;
- 느린 기간;
- 시각화 설정:
- 색상: 매수, 매도 및 중립 신호용;
- 글꼴 크기, 거리 승수;
- 알림 설정: 이메일 / 터미널 / 푸시(모바일);
프로그램 파일은 "Indicators" 디렉토리에 위치해야 합니다.