• 미리보기
  • 리뷰
  • 코멘트

Atr Projection

ATR 프로젝션 지표는 금융 시장에서 가격 움직임의 잠재적 한계에 대한 정확한 통찰을 제공하도록 설계된 강력한 도구로, 기술적 분석에서 두드러지고 있습니다. 유연한 접근 방식으로 사용자는 각 거래 자산의 특정한 요구에 맞게 분석 메트릭스를 직관적으로 사용자 정의할 수 있습니다.

사용자 정의 가능한 운영:

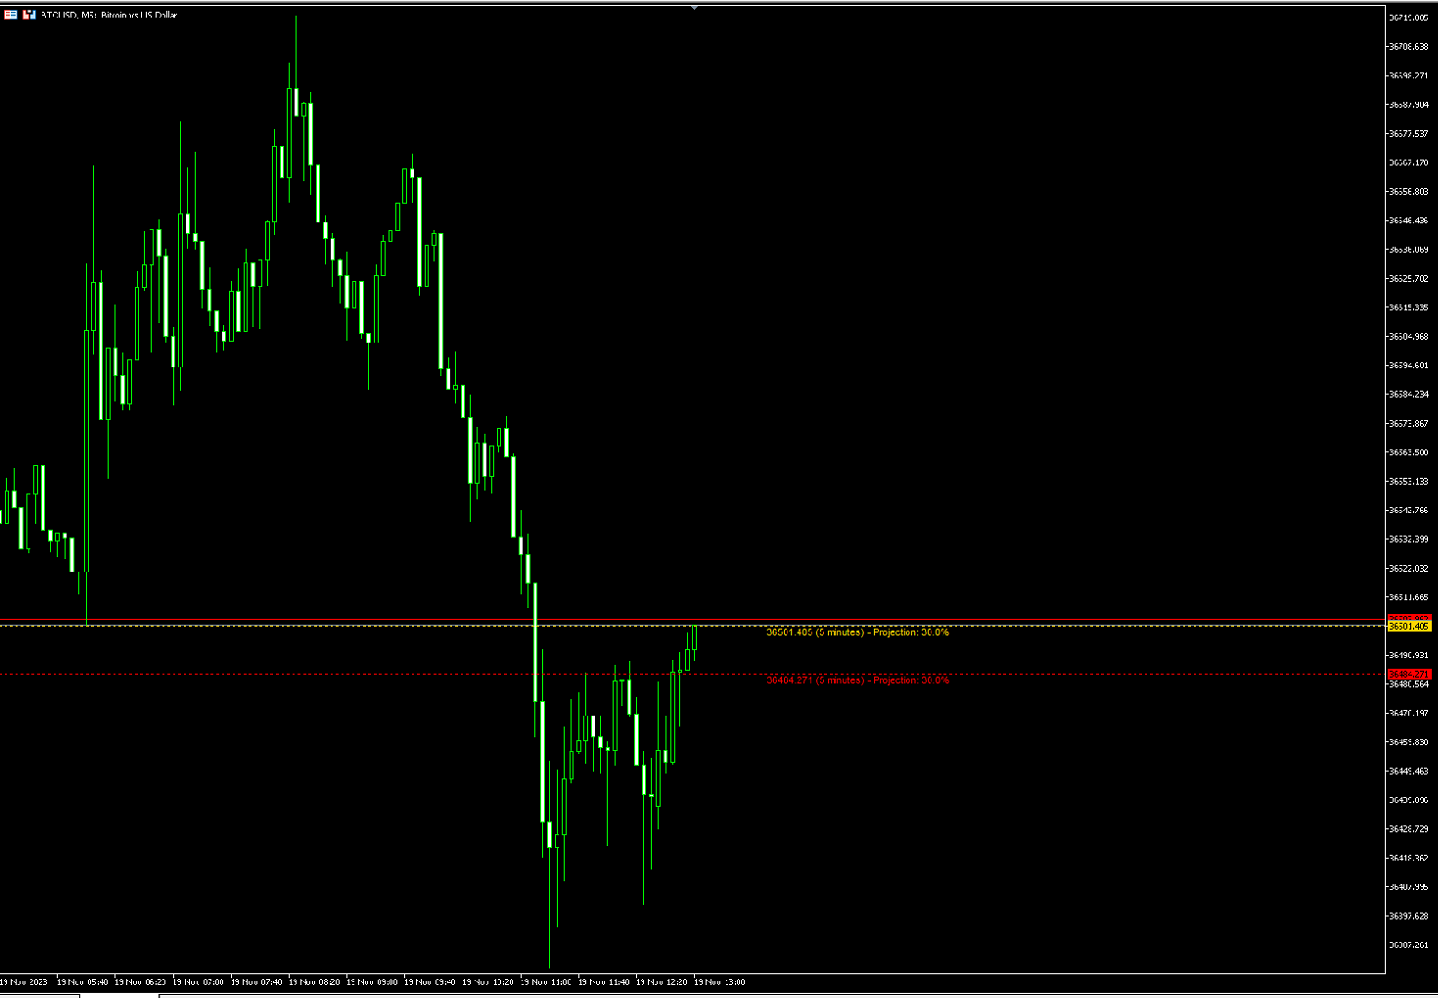
기본 설정으로 ATR 프로젝션은 최근 100개의 캔들의 평균 중 30%를 고려하여 작동합니다. 이러한 유연성은 사용자가 각 자산의 특징과 선호도에 따라 메트릭스를 조정할 수 있도록 하여 더 개인화된 분석을 제공합니다.

30%와 100개 캔들의 선택에 대한 논리:

선택된 백분율과 캔들 수의 신중한 선택은 최근의 중요한 움직임을 포착하여 더 정확한 예측을 제공하려는 것입니다. 이 전략적 접근은 가격이 이동할 가능성이 높은 지역을 강조하여 트레이더에게 더 잘 통찰력을 제공합니다.

ATR 프로젝션의 이점:

1. 사용자 정의 가능한 기술적 정확성: 사용자는 각 거래 자산의 특정 조건에 따라 메트릭스를 사용자 정의할 수 있습니다.

2. 고확률에 중점: 최근 100개의 캔들의 평균 중 30%에만 집중함으로써 ATR 프로젝션은 발생 확률이 높은 움직임에 주력하여 판단력 있는 의사 결정을 최적화합니다.

3. 거래 자산에 대한 적응: 지표의 유연성은 다양한 자산에 적응하여 각 금융 상품의 특성에 맞는 분석을 제공합니다.

또한 ATR 프로젝션은 거래 로봇을 만드는 데에 편리하며 버퍼 1과 0을 사용하여 이 지표를 자동화된 전략에 통합하기 쉽습니다. 이 기능은 알고리즘 트레이딩 환경에서의 지표 사용에 실용적이고 효율적인 차원을 더합니다. ATR 프로젝션 지표는 적응성과 통합의 용이성으로 인해 사용자 지정 가능하고 효율적인 기술적 분석을 찾는 트레이더들에게 가치 있는 도구로 떠오르고 있습니다.
추천 제품
Here I present you this awesome indicator I made. This is a nique combination witch puts you in the same level as MM's. So you can surf a lot of waves and identify the rally time, breakouts, and the perfect time to get in the market. ---- The SSL Channel is a great all-rounder based on 2 Simple Moving Averages, one of recent Highs, one of recent Lows. The calculation prints a   channel   on the chart consisting of 2 lines. This strategy gives a Long signal when price closes above the top of the
GridBotIND
Walle Trader
O  GRIDBOT WIM  robô de investimento para Mini Índice. Parametrizado com grade linear ou zona de expansão (FIMATHE). CONFIGURAÇÕES: Ponto de entrada Pivot dia anterior    double r1 = pivot + distance;    double r2 = r1 + distance;    double r3 = r2 + distance;    double r4 = r3 + distance;    double r5 = r4 + distance;    double r6 = r5 + distance;    double r7 = r6 + distance;    double r8 = r7 + distance;    double r9 = r8 + distance;    double r10 = r9 + distance;        double s1 = pivot
Rule Plotter Expert
Francisco Gomes Da Silva
5 (2)
이 전문가 조언은 Rule Plotter 지표 내에서 만든 전략을 테스트하고 실행하기 위해 디자인되었습니다. 사용 방법: Rule Plotter - 프로그래밍 지식 없이 전략을 생성하는 도구 무료로 다운로드하십시오. 그런 다음 Rule Plotter 지표에서 전략을 개발하십시오. 마지막으로,이 전문가 조언을 사용하여 생성한 전략을 실행하십시오. 매개변수: Strategy : Rule Plotter 지표 내에서 생성한 거래 시스템입니다. Lot: 거래량; 0으로 설정하면 전문가 조언이 최소한의 거래량으로 거래합니다. Take: 틱 단위 수익 실현; 0으로 설정하면 거래에 이익실현이 없습니다. Stop: 틱 단위 손절; 0으로 설정하면 거래에 손절이 없습니다. Magic ID: 이 매개변수를 사용하면 동일한 자산에서 이 전문가 조언의 여러 버전을 실행할 수 있으며 Magic ID 번호만 변경하면 됩니다. 새로운 프로젝트를 게시할 때 알려드리기 위해 MQL5.com 에서 나를 친구로 추가
Touch VWAP MT5
Danrlei Hornke
5 (5)
O Touch VWAP é um indicador que permite calcular uma Média Ponderada por Volume (VWAP) apenas apertando a tecla 'w' no seu teclado e após clicando no candle do qual deseja realizar o calculo, clicando abaixo do candle é calculada a VWAP baseado na minima dos preços com o volume, clicando sobre o corpo do candle é calculado uma VWAP sobre o preço medio com o volume e clicando acima do candle é calculado uma VWAP baseado na máxima dos preços com o volume, voce tambem tem a opção de remover a VWA
FREE
Rocket Trend
Andriy Sydoruk
The Rocket Trend indicator is trending. The indicator draws two-color points connected by lines along the chart. This is a trend indicator, it is an algorithmic indicator. It is easy to work and understand when a blue circle appears, you need to buy, when a red one appears, sell. The indicator is used for scalping and pipsing, and has proven itself well. Rocket Trend is available for analyzing the direction of the trend for a specific period of time. Ideal for novice traders learning the laws o
Aliens dougkang de moviles
Cesar Juan Flores Navarro
Tomamos 5 medios móviles las unimos en una la cual suavizamos y volvemos a suavizar, resultando un mega suavizador de medios móviles suavizadas. Indicador de mql5 funciona en cualquier broker y para todos los tiempos, siendo el mas optimo el de 5, 15 a mas. Funciona mejor en grupo consigo misma osea poner uno de 14 y otro de 50 y 400,, así se observa mejor su desempeño.
Weis Waves Wyckoff
Fillipe Dos Santos
through this indicator you can make  analysis and also can to distinguish possible weakness or continuous strength  on  price, it is an indicator initially developed by David Weis. This version is for the meta trader 5 platform. The Weis Waves indicator is based on volume and is aligned with the price, being able to find not only possible strenght and weakness, but also possible divergences between price and volume, bringing an interesting analysis between both.
Swing Point Volume
Thalles Nascimento De Carvalho
Swing Point Volume, the indicator that signals weakness and strength at the tops and bottoms. This indicador can be for used the Wyckoff Method. Information provided; - Swing on customized ticks. - Volume and points in each balance sheet. - Percentage of Displacement. - Sound alert option on top and bottom breaks. - Volume in ticks and Real Volume. - Volume HL (extreme) or (opening and closing) - Customized volume shapes.
KT Horizontal Lines MT5
KEENBASE SOFTWARE SOLUTIONS
In MetaTrader, plotting multiple   horizontal lines   and then tracking their respective price levels can be a hassle. This indicator automatically plots multiple horizontal lines at equal intervals for setting price alerts, plotting support and resistance levels, and other manual purposes. This indicator is suitable for Forex traders who are new and looking for chances to make quick profits from buying and selling. Horizontal lines can help traders find possible areas to start trading when the
B4S Adaptive YAxis Scaling
Henry Waribu Macharia
Product Description: Adaptive Y-Axis Scaling is a powerful MT5 indicator designed to enhance your trading experience by providing precise control over the Y-axis (price) scaling of your charts. This innovative tool allows you to customize the price scaling by specifying the number of pips from the visible chart's highs and lows. The calculated price range from this input is then used to set the maximum and minimum prices for the open chart, ensuring an optimized and comprehensive view of market
FREE
Intraday Vwap Orion
Joao Paulo Botelho Silva
Theory VWAP is a volume-weighted moving average, bringing greater relevance to prices. The VWAP base calculation follows the classic formula described in Investopedia ( https://www.investopedia.com/terms/v/vwap.asp ). VWAP = sum(typical price[i]*volume[i]) / sum(volume[i]) Functionalities Orion Intraday VWAP innovates by allowing the user to choose between the conventional Daily, Weekly and Monthly periods, also having the option of calculating the Intraday indicator, as used in other platfo
FRB Day Points
Fernando Baratieri
Day Points Indicadtor that shows the points considered important for X days. (Open,Close, High, Low) Used a lot by those who do day trade. These points can be used for decision making by a trader. You will choose the amount of days ago for it to show. Settings High/Low/Close/Open Show - True/False. Days - Number of days that will show on the chart. Color - Line Color. Style - Line Style.
FREE
Info:   marcobarbosabots Pivot lines are an easy way to see market trend. The indicator provides the pivot line and three first support and Resistance lines. Calculations used was: Resistance 3 = High + 2*(Pivot - Low) Resistance 2 = Pivot + (R1 - S1) Resistance 1 = 2 * Pivot - Low Pivot point = ( High + Close + Low )/3 Suport 1 = 2 * Pivot - High Suport 2 = Pivot - (R1 - S1) Suport 3 = Low - 2*(High - Pivot) You can use the calculated values ​​on an EA too, just make sure the indicator
Xtrade Trend Detector
Dago Elkana Samuel Dadie
Xtrade Trend Detector is an indicator capable of finding the best opportunities to take a position in any stock market. Indeed, it is a great tool for scalpers but also for Daytraders. You could therefore use it to identify areas to trade, it fits easily on a chart. I use it to detect trends on Big timeframes and take positions on Small timeframes. Don't hesitate to give me a feedback if you test it.
Graphic Alignment Context
Ricardo Alexandre Laurentino
The Graphic Alignment Context (GAC) Technical Indicator measures the vertical difference of the simple average price of a financial instrument in the context of three different timeframes determined by a defined number of bars or candles (periods) to determine the strength of the buy or sell trend. sale. Ascending average prices indicate Buying strength (1), Descending average prices indicate Selling strength (-1) and any scenario different from the previous two conditions indicates Neutrality
FREE
SupportResistence
Eduardo Borges Mariani
SupportResistance is a dynamic support and resistance indicator based on the high and low of the previous candles. The calculation parameters are configurable. You can use the maximum and minimum values of the previous candle as a reference, or you can use the maximum and minimum of a group of previous candles. The indicator uses a red line to indicate resistance and a green line to indicate support. When a support or resistance is broken, its line is dotted, being restored only when it b
Turpial Pullback
Arlos Elias Rivas Romero
Indicator Type Strategy (Pullback) for all Symbols and Periodicity, Preferably from 30M periodicity. Can be used for manual trading. Its workspace corresponds to channel of 3 bars of Bill Willians. Also relies on the indicator Rsi and Atr. BUY when: There is a Green Arrow STOPLOSS to buy, below the bottom line of the channel (red line)" SELL when: There is a Red Arrow. STOPLOSS to sell, above the upper line of the channel (blue line)
This indicator calculates and displays Murrey Math Lines on the chart. This MT5 version is similar to the МТ4 version: It allows you to plot up to 4 octaves, inclusive, using data from different time frames, which enables you to assess the correlation between trends and investment horizons of different lengths. In contrast to the МТ4 version, this one automatically selects an algorithm to search for the base for range calculation. You can get the values of the levels by using the iCustom() funct
If you like this project, leave a 5 star review. Follow on TikTok: @quantum.trader       [ Any Symbol Can Be ADDED ] Works on [ EURUSD-GBPUSD-GBPJPY-USDJPY-XAUUSD ] This indicator calculate and draw the Prediction or Forecast the peaks of the next day based on REGRESSION ( forecast high - forecast low - forecast middle - forecast upper q - forecast lower q ) These are important levels looked by many institutional and professional traders and can be useful for you to know the places whe
To download MT4 version please click here . This is the exact conversion from TradingView: "WaveTrend [LazyBear]" By "zeusuk3". One of the coolest indicators out there to detect overbought and oversold zones. It can be used as a part of more complicated strategy and for confirming a potential trade setup. There are buffers to use in EAs also. The indicator is loaded light and non-repaint. - You can message in private chat for further changes you need. Thanks for downloading 
Parabolic Profesional
Ignacio Agustin Mene Franco
Parabolic Professional. is a parabolic sar indicator, programmed better to better catch the entries, where it throws red dots, gives upload input, where it puts gray dots, gives point of sale, perfect for making lengths of H4, and H1 It is also used for scalping, It works at any time. suitable for forex and synthetic indices, also crypto, World Investor , Good profit
Box Weis Wave
Thalles Nascimento De Carvalho
5 (1)
활발한 트레이더이며 금융 시장의 움직임을 효과적으로 해석하고자 한다면, Weis Wave Box에 대해 알아보시면 좋을 것입니다. 이 놀라운 인디케이터는 볼륨 웨이브와 해당 스윙 포인트의 시각적인 분석을 명확하고 정확하게 제공하기 위해 설계되었습니다. 5가지 사용자 정의 가능한 스윙 형태와 기타 독특한 기능을 갖춘 Weis Wave Box는 숙련된 트레이더와 초보자 모두에게 꼭 필요한 도구로 주목받고 있습니다. Weis Wave Box의 주목할 만한 기능 중 하나는 사용자 정의 틱 간격에서 볼륨 웨이브를 생성할 수 있는 능력입니다. 이를 통해 거래 선호도에 맞게 적응하고 전략에 정확하고 관련성 있는 결과를 얻을 수 있습니다. 또한, 이 인디케이터는 조정 가능한 히스토리 제한을 갖고 있어 원하는 시간 범위에 초점을 맞추고 특정한 추세를 분석할 수 있습니다. Weis Wave Box의 큰 장점 중 하나는 틱 볼륨과 실제 볼륨에 대한 정보를 제공할 수 있는 능력입니다. 이 두
Alert Up Down MT5
William Oswaldo Mayorga Urduy
METATRADER 5에 대한 경고 위아래 이 표시기는 가격이 UP과 DOWN 라인 사이의 영역을 벗어날 때 경고를 생성합니다. 다음과 같은 다양한 유형의 경고를 생성할 수 있습니다. > 사운드 > 메시지 상자 > 전문가 상자의 메시지 > 메일(이전 구성) > PUSH 알림(이전 구성) 선은 선 속성이 아니라 표시기 속성에서 구성해야 합니다. 선 속성에서 구성하면 피노나치가 영향을 받을 수 있기 때문입니다. 설정 중 색상, 선 스타일 및 너비를 변경할 수 있습니다. 선은 선 속성이 아니라 표시기 속성에서 구성해야 합니다. 선 속성에서 구성하면 피노나치가 영향을 받을 수 있기 때문입니다. 설정 중 색상, 선 스타일 및 너비를 변경할 수 있습니다. 선은 선 속성이 아니라 표시기 속성에서 구성해야 합니다. 선 속성에서 구성하면 피노나치가 영향을 받을 수 있기 때문입니다. 설정 중 색상, 선 스타일 및 너비를 변경할 수 있습니다.
Expert Market Edge
SASA MIJIN
5 (7)
Expert Market Edge is scalping, trending, reversal indicator, with alerts . You can use it all and fit with your strategy whatever it fits you. My recommendation is to combine with my Colored RSI , and when 2 signals are matched, and pointing same direction (for example buy on this indicator, and green on RSI, you can take a long position, stop loss should be last local low, if you want to be more conservative, add ATR. ) you can take position. If you using moving averages, that's even better i
MIDAS Super VWAP
Flavio Javier Jarabeck
4.29 (14)
Imagine VWAP, MVWAP and MIDAS in one place... Well, you found it! Now you can track the movement of Big Players in various ways, as they in general pursue the benchmarks related to this measuring, gauging if they had good execution or poor execution on their orders. Traders and analysts use the VWAP to eliminate the noise that occurs throughout the day, so they can measure what prices buyers and sellers are really trading. VWAP gives traders insight into how a stock trades for that day and deter
FREE
Pare de seguir as "sardinhas" e comece a operar como big player, de forma automática. O robô Imbalance Autotrader é a mais recente tecnologia de trade que monitora os big players (grandes investidores) do mercado financeiro. Com estratégia de rompimento ( breakout ) ou pullback (Fair Value Gap FVG e Order Block) , você consegue configurar o robô para o ativo, conforme condições que você deseja operar. Além disso, o robô pode ter stops configuráveis, dinâmicos ou fixos. Na questão de gerenciamen
Zone vwap auto band
Anizio Donizete Dias De Moraes
It is an indicator used to identify support and resistance points from the daily VWAP and you can use it to check the best entry and exit points. The calculated value of the channel distance can be calculated in several ways: - Manual   Defining the value to be projected to calculate the distance of the channels. - Automatic   Select the timeframe to be used.   Regardless of the graphic time that is on the screen, if the parameter is changed to      H1(One hour candles), the system will c
Stackable VWAP
Flavio Javier Jarabeck
3.33 (6)
Volume Weighted Average Price (VWAP) is a trading benchmark commonly used by Big Players that gives the average price a Symbol has traded throughout the day. It is based on both Volume and price. Additionally we put in this indicator the MVWAP (Moving Volume Weighted Average Price). For those who do not know the usage and the importance od this indicator I recommend a great article about this subject at Investopedia ( https://www.investopedia.com/articles/trading/11/trading-with-vwap-mvwap.asp
FREE
RSIScalperPro
PATRICK WENNING
RSIScalperPro를 소개합니다 - 메타트레이더 5용 RSI 기반의 혁신적인 인디케이터로, 1분 차트에서의 스캘핑에 최적화되어 있습니다! RSIScalperPro를 사용하면 정확한 진입 및 청산 신호를 제공하는 강력한 도구를 손에 넣을 수 있습니다. RSIScalperPro는 서로 다른 두 가지 RSI 지표를 사용하여 과매수 및 과매도 레벨에 대한 명확한 신호를 제공합니다. 2개의 RSI의 시간 프레임 및 제한 값을 원하는 대로 조정하여 트레이딩 전략에 최적화된 결과를 얻을 수 있습니다. 차트 상의 개별 화살표는 거래 진입 및 청산 타이밍을 쉽게 파악하는 데 도움이 됩니다. 또한 RSIScalperPro의 특징 중 하나는 사용자 정의 가능한 3개의 이동 평균선입니다. 이를 통해 트렌드의 방향을 판단하고 강력한 거래 신호를 확인하는 데 도움이 됩니다. 이를 통해 조기에 트렌드를 감지하고 수익성 높은 거래에 참여할 수 있습니다. 뿐만 아니라 RSIScalperPro는 새로운 거래
ZigZag with Fibonacci
Rafael Caetano Pinto
This indicator uses the metaquotes ZigZag indicator as base to plot fibonacci extension and fibonacci retracement based in the Elliot waves. A fibonacci retracement will be plotted on every wave draw by the ZigZag. A fibonacci extension will be plotted only after the 2nd wave. Both fibonacci will be updated over the same wave tendency. Supporting until 9 consecutive elliot waves. Parameters: Depth: How much the algorithm will iterate to find the lowest and highest candles Deviation: Amoun
이 제품의 구매자들이 또한 구매함
Atomic Analyst MT5
Issam Kassas
5 (15)
우선적으로 언급할 점은이 거래 지표가 다시 그리지 않고 지연되지 않으며 이를 통해 수동 및 로봇 거래 모두에 이상적이라는 점입니다. 사용자 매뉴얼: 설정, 입력 및 전략. Atomic Analyst는 가격의 강도와 모멘텀을 활용하여 시장에서 더 나은 이점을 찾는 PA Price Action Indicator입니다. 고급 필터를 장착하여 잡음과 거짓 신호를 제거하고 거래 잠재력을 높이는 데 도움이 됩니다. 복잡한 지표의 다중 레이어를 사용하여 Atomic Analyst는 차트를 스캔하고 복잡한 수학적 계산을 간단한 신호와 색상으로 변환하여 초보 트레이더가 이해하고 일관된 거래 결정을 내릴 수 있도록합니다. "Atomic Analyst"는 새로운 및 경험이 풍부한 트레이더를위한 종합적인 거래 솔루션입니다. 프리미엄 지표와 최고 수준의 기능을 하나의 거래 전략에 결합하여 모든 종류의 트레이더에 대한 다재다능한 선택지가되었습니다. 인트라데이 거래 및 스캘핑 전략 : 빠르고 정확한
Quantum Trend Sniper
Bogdan Ion Puscasu
5 (46)
소개       Quantum Trend Sniper Indicator는   추세 반전을 식별하고 거래하는 방식을 변화시키는 획기적인 MQL5 지표입니다! 13년 이상의 거래 경험을 가진 숙련된 트레이더 팀이 개발한       Quantum Trend Sniper 표시기       매우 높은 정확도로 추세 반전을 식별하는 혁신적인 방법으로 거래 여정을 새로운 차원으로 끌어올리도록 설계되었습니다. ***Quantum Trend Sniper Indicator를 구입하면 Quantum Breakout Indicator를 무료로 받을 수 있습니다!*** Quantum Trend Sniper Indicator는 추세 반전을 식별하고 세 가지 이익실현 수준을 제안할 때 경고, 신호 화살표를 제공합니다. 초보자 거래자와 전문 거래자 모두에게 적합합니다. Quantum EA 채널:       여기를 클릭하세요 MT4 버전:       여기를 클릭하세요
우선 이 거래 시스템이 리페인팅, 리드로잉 및 레이그 인디케이터가 아니라는 점을 강조하는 것이 중요합니다. 이는 수동 및 로봇 거래 모두에 이상적인 것으로 만듭니다. 온라인 강좌, 설명서 및 프리셋 다운로드. "스마트 트렌드 트레이딩 시스템 MT5"은 새로운 및 경험이 풍부한 트레이더를 위해 맞춤형으로 제작된 종합적인 거래 솔루션입니다. 10개 이상의 프리미엄 인디케이터를 결합하고 7개 이상의 견고한 거래 전략을 특징으로 하여 다양한 시장 조건에 대한 다목적 선택이 가능합니다. 트렌드 추종 전략: 효과적인 트렌드 추이를 타기 위한 정확한 진입 및 손절 관리를 제공합니다. 반전 전략: 잠재적인 트렌드 반전을 식별하여 트레이더가 범위 시장을 활용할 수 있게 합니다. 스캘핑 전략: 빠르고 정확한 데이 트레이딩 및 단기 거래를 위해 설계되었습니다. 안정성: 모든 인디케이터가 리페인팅, 리드로잉 및 레이그가 아니므로 신뢰할 수 있는 신호를 보장합니다. 맞춤화: 개별 거래 선호도를 고려한 맞춤
AT Forex Indicator MT5
Marzena Maria Szmit
5 (4)
The AT Forex Indicator MT5 is a sophisticated trading tool designed to provide traders with a comprehensive analysis of multiple currency pairs. This powerful indicator simplifies the complex nature of the forex market, making it accessible for both novice and experienced traders. AT Forex Indicator uses advanced algorithms to detect trends, patterns and is an essential tool for traders aiming to enhance their forex trading performance. With its robust features, ease of use, and reliable signal
Entry Points Pro for MT5
Yury Orlov
4.55 (160)
다시 색을 칠하지 않고 거래에 진입할 수 있는 정확한 신호를 제공하는 MT5용 지표입니다. 외환, 암호화폐, 금속, 주식, 지수 등 모든 금융 자산에 적용할 수 있습니다. 매우 정확한 추정값을 제공하고 매수와 매도의 가장 좋은 시점을 알려줍니다. 하나의 시그널로 수익을 내는 지표의 예와 함께 비디오 (6:22)시청하십시오! 대부분의 거래자는 Entry Points Pro 지표의 도움으로 첫 거래 주 동안 트레이딩 결과를 개선합니다. 저희의   Telegram Group 을 구독하세요! Entry Points Pro 지표의 좋은점. 재도색이 없는 진입 신호 신호가 나타나고 확인되면(시그널 캔들이 완성된 경우) 신호는 더 이상 사라지지 않습니다. 여타 보조지표의 경우 신호를 표시한 다음 제거되기 때문에 큰 재정적 손실로 이어집니다. 오류 없는 거래 게시 알고리즘을 통해 트레이드(진입 또는 청산)를 할 이상적인 순간을 찾을 수 있으며, 이를 통해 이를 사용하는 모든 거래자의
TPSpro RFI Levels MT5
Roman Podpora
5 (8)
Reversal First Impulse levels (RFI)      INSTRUCTIONS        RUS       -       ENG              R ecommended to use with an indicator   -   TPSpro  TREND PRO -  Version MT4                 A key element in trading is zones or levels from which decisions to buy or sell a trading instrument are made. Despite attempts by major players to conceal their presence in the market, they inevitably leave traces. Our task was to learn how to identify these traces and interpret them correctly. Main functi
FX Power MT5 NG
Daniel Stein
5 (5)
모닝 브리핑 여기 mql5 와 텔레그램에서 FX Power MT5 NG 는 오랫동안 인기 있는 통화 강도 측정기인 FX Power의 차세대 버전입니다. 이 차세대 강도 측정기는 무엇을 제공합니까? 기존 FX Power에서 좋아했던 모든 것 PLUS GOLD/XAU 강도 분석 더욱 정밀한 계산 결과 개별 구성 가능한 분석 기간 더 나은 성능을 위한 사용자 정의 가능한 계산 한도 특별 멀티더 많은 것을보고 싶은 사람들을위한 특별한 다중 인스턴스 설정 모든 차트에서 좋아하는 색상을위한 끝없는 그래픽 설정 수많은 알림 옵션, 중요한 것을 다시는 놓치지 않도록 Windows 11 및 macOS 스타일의 둥근 모서리가 있는 새로운 디자인 마법처럼 움직이는 인디케이터 패널 FX 파워 키 특징 모든 주요 통화의 완전한 강세 이력 모든 시간대에 걸친 통화 강세 이력 모든 브로커 및 차트에서 고유 계산 결과 100% 신뢰할 수있는 실시간100 % 신뢰할 수있는 실시간 계산-> 다시 칠하지 않음
FX Volume MT5
Daniel Stein
4.94 (17)
모닝 브리핑을 통해 세부 정보와 스크린샷으로 매일 시장 업데이트를 받으세요 여기 mql5 및 텔레그램에서 FX 거래량은 브로커의 관점에서 시장 심리에 대한 실제 통찰력을 제공하는 최초이자 유일한 거래량 지표입니다. 브로커와 같은 기관 시장 참여자가 외환 시장에서 어떤 포지션을 취하고 있는지에 대한 훌륭한 통찰력을 COT 보고서보다 훨씬 빠르게 제공합니다. 차트에서 이 정보를 직접 확인하는 것은 트레이딩의 진정한 판도를 바꾸고 획기적인 솔루션입니다. 다음과 같은 고유한 시장 데이터 인사이트의 이점 비율 는 통화의 매수/매도 포지션 비율을 백분율로 표시 비율 변화 는 선택한 기간 내 매수 비율과 비율 변화를 표시 총 거래량 는 해당 통화의 총 거래량(롱 및 숏)을 로트 단위로 보여줍니다 Volumes Long 는 해당 통화의 모든 롱 포지션의 거래량을 보여줍니다 Volumes Short 는 해당 통화의 모든 숏 포지션의 거래량을 보여줍니다 Net Long 는 순 롱 포지션의 거래량
XQ Indicator MetaTrader 5
Marzena Maria Szmit
5 (1)
Step into the realm of Forex trading with confidence and precision using XQ, a cutting-edge Forex indicator designed to elevate your trading game to unprecedented heights. Whether you're a seasoned trader or just stepping into the world of currency exchange, XQ Forex Indicator empowers you with the insights and signals needed to make informed trading decisions. The signal conditions are a combination of three indicators, and XQ Forex Indicator only display  medium and long-term trends . The ind
TPSproTREND PrO MT5
Roman Podpora
4.88 (8)
TPSpro TRENDPRO  - is a trend indicator that automatically analyzes the market and provides information about the trend and each of its changes, as well as giving signals for entering trades without redrawing! The indicator uses each candle, analyzing them separately. referring to different impulses - up or down impulse. Exact entry points into transactions for currencies, crypto, metals, stocks, indices!  -  Version MT4               DETAILED DESCRIPTION               R ecommended to use with
TPA True Price Action indicator reveals the true price action of the market makers through 100% non-repainting signals strictly at the close of a candle! TPA shows entries and re-entries, every time the bulls are definitely stronger than the bears and vice versa. Not to confuse with red/green candles. The shift of power gets confirmed at the earliest stage and is ONE exit strategy of several. There are available now two free parts of the TPA User Guide for our customers. The first "The Basics"
우선적으로, 이 거래 도구는 전문적인 거래에 이상적인 비-다시 그리기 및 지연되지 않는 지표입니다.  온라인 강좌, 사용자 매뉴얼 및 데모. 스마트 가격 액션 컨셉트 인디케이터는 신규 및 경험 많은 트레이더 모두에게 매우 강력한 도구입니다. Inner Circle Trader Analysis 및 Smart Money Concepts Trading Strategies와 같은 고급 거래 아이디어를 결합하여 20가지 이상의 유용한 지표를 하나로 결합합니다. 이 인디케이터는 스마트 머니 컨셉트에 중점을 두어 대형 기관의 거래 방식을 제공하고 이동을 예측하는 데 도움을 줍니다.  특히 유동성 분석에 뛰어나 기관이 어떻게 거래하는지 이해하는 데 도움을 줍니다. 시장 트렌드를 예측하고 가격 변동을 신중하게 분석하는 데 탁월합니다. 귀하의 거래를 기관 전략에 맞추어 시장의 동향에 대해 더 정확한 예측을 할 수 있습니다. 이 인디케이터는 시장 구조를 분석하고 중요한 주문 블록을 식별하
소개       Quantum Breakout PRO   , 브레이크아웃 존 거래 방식을 변화시키는 획기적인 MQL5 지표! 13년 이상의 거래 경험을 가진 숙련된 트레이더 팀이 개발한       퀀텀 브레이크아웃 PRO       혁신적이고 역동적인 브레이크아웃 존 전략으로 거래 여정을 새로운 차원으로 끌어올리도록 설계되었습니다. Quantum Breakout Indicator는 5개의 이익 목표 영역이 있는 브레이크아웃 영역의 신호 화살표와 브레이크아웃 상자를 기반으로 한 손절 제안을 제공합니다. 초보자 거래자와 전문 거래자 모두에게 적합합니다. Quantum EA 채널:       여기를 클릭하세요 중요한! 구매 후 설치 매뉴얼을 받으려면 개인 메시지를 보내주십시오. 추천: 기간: M15 통화쌍: GBPJPY, EURJPY, USDJPY,NZDUSD, XAUUSD 계정 유형: 스프레드가 매우 낮은 ECN, Raw 또는 Razor 브로커 시간: GM
Advanced Supply Demand MT5
Bernhard Schweigert
4.53 (15)
현재 33% 할인! 초보자나 전문 트레이더를 위한 최고의 솔루션! 이 보조지표는 우리가 다수의 독창적 기능과 새로운 공식을 통합한 독특하고 고품질이며 저렴한 거래 도구입니다. 이 업데이트를 통해 이중 시간대를 표시할 수 있습니다. 더 높은 TF를 표시할 수 있을 뿐만 아니라 차트 TF와 더 높은 TF 모두를 표시할 수 있습니다: 중첩 영역 표시. 모든 Supply Demand 트레이더들이 좋아할 것입니다. :) 중요한 정보 공개 Advanced Supply Demand의 잠재력을 극대화하려면 다음을 방문하십시오. https://www.mql5.com/ko/blogs/post/720245   진입 또는 목표의 명확한 트리거 포인트를 정확히 찾아냄으로 해서 거래가 어떻게 개선될지 상상해 보십시오. 새로운 알고리즘을 기반으로 매수자와 매도자 간의 잠재적인 불균형을 훨씬 더 쉽게 분간할 수 있습니다. 왜냐하면 가장 강한 공급영역과 가장 강한 수요 영역과 과거에 어떻게 진행 되었는지를(이
ICT, SMC, SMART MONEY CONCEPTS, SMART MONEY, Smart Money Concept, Support and Resistance, Trend Analysis, Price Action, Market Structure, Order Blocks, BOS/CHoCH,   Breaker Blocks ,  Momentum Shift,   Supply&Demand Zone/Order Blocks , Strong Imbalance,   HH/LL/HL/LH,    Fair Value Gap, FVG,  Premium  &   Discount   Zones, Fibonacci Retracement, OTE, Buy Side Liquidity, Sell Side Liquidity, BSL/SSL Taken, Equal Highs & Lows, MTF Dashboard, Multiple Time Frame, BigBar, HTF OB, HTF Market Structure
Blahtech Market Profile MT5
Blahtech Limited
5 (9)
Was: $249  Now: $99   Market Profile defines a number of day types that can help the trader to determine market behaviour. A key feature is the Value Area, representing the range of price action where 70% of trading took place. Understanding the Value Area can give traders valuable insight into market direction and establish the higher odds trade. It is an excellent addition to any system you may be using. Inspired by Jim Dalton’s book “Mind Over Markets”, this indicator is designed to suit the
RelicusRoad Pro MT5
Relicus LLC
4.83 (23)
이제 $ 147 (몇 가지 업데이트 후 $ 499 증가) - 무제한 계정 (PCS 또는 MACS) RelicusRoad 사용 설명서 + 교육 비디오 + 비공개 Discord 그룹 액세스 + VIP 상태 시장을 보는 새로운 방법 RelicusRoad는 외환, 선물, 암호화폐, 주식 및 지수에 대한 세계에서 가장 강력한 거래 지표로서 거래자에게 수익성을 유지하는 데 필요한 모든 정보와 도구를 제공합니다. 우리는 초보자부터 고급까지 모든 거래자가 성공할 수 있도록 기술적 분석 및 거래 계획을 제공합니다. 미래 시장을 예측할 수 있는 충분한 정보를 제공하는 핵심 거래 지표입니다. 우리는 차트에서 말이 안 되는 여러 지표 대신 완전한 솔루션을 믿습니다. 타의 추종을 불허하는 매우 정확한 신호, 화살표 + 가격 조치 정보를 표시하는 올인원 표시기입니다. 강력한 AI를 기반으로 하는 RelicusRoad는 누락된 정보와 도구를 제공하여 교육하고 성공적인 트레이더인 트레이딩 전문
Matrix Arrow Indicator MT5
Juvenille Emperor Limited
5 (14)
매트릭스 화살표 표시기 MT5 는 외환, 상품, 암호 화폐, 지수, 주식과 같은 모든 기호/도구에 사용할 수 있는 100% 다시 칠하지 않는 다중 기간 표시기를 따르는 고유한 10 in 1 추세입니다.  Matrix Arrow Indicator MT5 는 다음과 같은 최대 10개의 표준 지표에서 정보와 데이터를 수집하여 초기 단계에서 현재 추세를 결정합니다. 평균 방향 이동 지수(ADX) 상품 채널 지수(CCI) 클래식 하이켄 아시 캔들 이동 평균 이동 평균 수렴 발산(MACD) 상대 활력 지수(RVI) 상대 강도 지수(RSI) 포물선 SAR 스토캐스틱 오실레이터 윌리엄스의 백분율 범위 모든 지표가 유효한 매수 또는 매도 신호를 제공하면 강력한 상승/하락 추세를 나타내는 다음 캔들/막대가 시작될 때 해당 화살표가 차트에 인쇄됩니다. 사용자는 사용할 표시기를 선택하고 각 표시기의 매개변수를 개별적으로 조정할 수 있습니다. 매트릭스 화살표 표시기 MT5는 선택한 표시기에서만 정보를 수
Shepherd Gann Squares MT5
Abdullah Alrai
5 (12)
이 지표는 W.D. Gann이 작성한 "시장 예측을 위한 수학 공식" 기사를 기반으로 하는 시장 분석 방법으로 9의 제곱과 144의 제곱 방법에 따라 다릅니다. 사용자 매뉴얼: Add Your review And contact us to get it 다음에서 전체 MT4 버전을 구입할 수 있습니다. https://www.mql5.com/en/market/product/15316 MT4에서 무료로 테스트할 수 있습니다. https://www.mql5.com/en/market/product/15320?source=Site +Profile+Seller#!tab=reviews 이 제품은 레벨/스타/그리드/간 팬/으로 9의 정사각형을 그릴 수 있습니다. Gann Squares: 52/90/144도 그릴 것입니다. Chart 에 이동 가능한 Free Gann Star 를 직접 그립니다 . 그것은 또한 Gann 다이아몬드를 그릴 것입니다.
Blahtech Supply Demand MT5
Blahtech Limited
4.54 (13)
Was: $299  Now: $99   Supply Demand uses previous price action to identify potential imbalances between buyers and sellers. The key is to identify the better odds zones, not just the untouched ones. Blahtech Supply Demand indicator delivers functionality previously unavailable on any trading platform. This 4-in-1 indicator not only highlights the higher probability zones using a multi-criteria strength engine, but also combines it with multi-timeframe trend analysis, previously confirmed swings
Quantum Heiken Ashi PRO MT5
Bogdan Ion Puscasu
4.5 (8)
시장 동향에 대한 명확한 통찰력을 제공하도록 설계된 Heiken Ashi 양초는 노이즈를 필터링하고 잘못된 신호를 제거하는 기능으로 유명합니다. 혼란스러운 가격 변동에 작별을 고하고 더 매끄럽고 신뢰할 수 있는 차트 표현을 만나보세요. Quantum Heiken Ashi PRO를 정말 독특하게 만드는 것은 전통적인 촛대 데이터를 읽기 쉬운 색상 막대로 변환하는 혁신적인 공식입니다. 빨간색과 녹색 막대는 각각 약세와 강세 추세를 우아하게 강조하여 잠재적 진입점과 퇴장점을 매우 정확하게 파악할 수 있습니다. Quantum EA 채널:       여기를 클릭하세요 MT4 버전:       여기를 클릭하세요 이 놀라운 지표는 다음과 같은 몇 가지 주요 이점을 제공합니다. 선명도 향상: Heiken Ashi 바는 가격 변동을 완화하여 시장 추세를 보다 명확하게 나타내므로 유리한 거래 기회를 쉽게 식별할 수 있습니다. 소음 감소: 종종 잘못된 신호로 이어지는 불규칙한 가격 변동
Gartley Hunter Multi
Siarhei Vashchylka
5 (7)
Gartley Hunter Multi - An indicator for searching for harmonic patterns simultaneously on dozens of trading instruments and on all possible timeframes. Manual (Be sure to read before purchasing) | Version for MT4 Advantages 1. Patterns: Gartley, Butterfly, Shark, Crab. Bat, Alternate Bat, Deep Crab, Cypher 2. Simultaneous search for patterns on dozens of trading instruments and on all possible timeframes 3. Search for patterns of all possible sizes. From the smallest to the largest 4. A
Auto Order Block with break of structure based on ICT and Smart Money Concepts (SMC) Futures Break of Structure ( BoS )             Order block ( OB )            Higher time frame Order block / Point of Interest ( POI )    shown on current chart           Fair value Gap ( FVG ) / Imbalance   -  MTF      ( Multi Time Frame )    HH/LL/HL/LH  -  MTF      ( Multi Time Frame )  Choch  MTF      ( Multi Time Frame )  Volume Imbalance     ,  MTF          vIMB Gap’s Power of 3 Equal High
프리시전 트레이딩 시스템의 로저 메드칼프에 의한 프리시전 인덱스 오실레이터 (Pi-Osc) 버전 2는 차트에 신속하게 로드되도록 주의 깊게 다시 코딩되었으며 경험을 향상시키기 위해 몇 가지 다른 기술적 개선 사항이 통합되었습니다. Pi-Osc는 정확한 거래 타이밍 신호를 제공하도록 개발되었으며 시장이 모든 사람의 스톱을 청산하기 위해 가야 하는 극도의 고갈 지점을 찾는 데 목적이 있습니다. 이 제품은 극단적인 지점이 어디에 있는지 알고 있는 고전적인 문제를 해결하며 트레이더로서의 삶을 훨씬 간단하게 만듭니다. 이것은 업계 표준 오실레이터와는 상당히 다른 강력한 차이점을 가지고 있는 고도로 복잡한 합의 지표입니다. 사용하는 기능 중 일부는 수요 지수, 자금 흐름, RSI, 스토캐스틱, 패턴 인식, 거래량 분석, 표준 편차 극단점 및 다양한 길이에서 위와 유사한 변형을 갖습니다. 미숙한 눈에는 다른 오실레이터와 비슷해 보일 수 있지만 RSI 또는 모멘텀과 같은 다
Legacy of Gann for MT5
Pavel Zamoshnikov
5 (6)
The indicator very accurately determines the levels of the possible end of the trend and profit fixing. The method of determining levels is based on the ideas of W.D.Gann, using an algorithm developed by his follower Kirill Borovsky. Extremely high reliability of reaching levels (according to K. Borovsky  - 80-90%) Indispensable for any trading strategy – every trader needs to determine the exit point from the market! Precisely determines targets on any timeframes and any instruments (forex, met
Bill Williams Advanced
Siarhei Vashchylka
5 (7)
Bill Williams Advanced is designed for automatic chart analysis using Bill Williams' "Profitunity" system. The indicator analyzes four timeframes at once. Manual (Be sure to read before purchasing) Advantages 1. Automatically analyzes the chart using the "Profitunity" system of Bill Williams. The found signals are placed in a table in the corner of the screen. 2. Equipped with a trend filter based on the Alligator indicator. Most of the system signals are recommended to be used only accordi
AW Trend Predictor MT5
AW Trading Software Limited
4.78 (58)
하나의 시스템에서 추세와 고장 수준의 조합입니다. 고급 지표 알고리즘은 시장 노이즈를 필터링하고 추세, 진입점 및 가능한 출구 수준을 결정합니다. 표시기 신호는 통계 모듈에 기록되어 가장 적합한 도구를 선택하여 신호 기록의 효율성을 보여줍니다. 이 표시기는 이익 실현 및 손절매 표시를 계산합니다. 매뉴얼 및 지침 ->   HERE   / MT4 버전 ->   HERE 지표로 거래하는 방법: Trend Predictor로 거래하는 것은 3단계로 간단합니다. 1단계 - 포지션 열기 70% 이상의 성공률로 매수 신호를 받았습니다. 2단계 - StopLoss 결정 반대 신호로 트렁크 선택 3단계 - 이익 실현 전략 정의 전략 1: TP1 도달 시 전체 포지션 청산 전략 2: TP1 도달 시 포지션의 50% 청산 및 TP2 도달 시 나머지 50% 청산 전략 3: 추세 반전 시 전체 포지션 청산 이익: 결과를 다시 그리지 않음, 신호는 엄격하게 양초가 닫힐 때 어드바이저에서 사용할 수 있습니
Owl Smart Levels MT5
Sergey Ermolov
4.39 (38)
MT4 버전  |  FAQ Owl Smart Levels Indicator 는 Bill Williams 의 고급 프랙탈, 시장의 올바른 파동 구조를 구축하는 Valable ZigZag, 정확한 진입 수준을 표시하는 피보나치 수준과 같은 인기 있는 시장 분석 도구를 포함하는 하나의 지표 내에서 완전한 거래 시스템입니다. 시장과 이익을 취하는 장소로. 전략에 대한 자세한 설명 표시기 작업에 대한 지침 고문-거래 올빼미 도우미의 조수 개인 사용자 채팅 ->구입 후 나에게 쓰기,나는 개인 채팅에 당신을 추가하고 거기에 모든 보너스를 다운로드 할 수 있습니다 힘은 단순함에 있습니다! Owl Smart Levels 거래 시스템은 사용하기 매우 쉽기 때문에 전문가와 이제 막 시장을 연구하고 스스로 거래 전략을 선택하기 시작한 사람들 모두에게 적합합니다. 전략 및 지표에는 눈에 보이지 않는 비밀 공식 및 계산 방법이 없으며 모든 전략 지표는 공개되어 있습니다. Owl Smart Levels를
Go Way TREND
Ywsf Hsyn Hmad Alrsh
추세와 함께 가십시오. 네, 15분 프레임에 매수든 매도든 진입 신호를 기다리고, 30분 프레임에 신호가 나타나는지 확인하세요(때때로 신호가 나타나는 데 1시간 이상이 소요됩니다. 돌아올 수 있습니다) 15분 프레임으로 갔다가 30분 프레임으로 돌아가서 메인 시그널이 나타날 때까지 이를 반복합니다. 30분 프레임에 시그널이 나타나면 가격을 가지고 진입하여 선이 바뀔 때 수익을 얻습니다. , 이익이 기록되거나 반대 신호가 나타나는 경우 매우 간단하며 모든 주요 통화에서 작동합니다.  금속, 표시기, 모든 프레임이지만 가장 좋은 결과는 30분 프레임입니다. 항상 캔들 바닥 아래에 스톱로스를 설정하고 자본 관리를 초과해서는 안 됩니다. 자본금의 10% 추세와 함께 가십시오. 네, 15분 프레임에 매수든 매도든 진입 신호를 기다리고, 30분 프레임에 신호가 나타나는지 확인하세요(때때로 신호가 나타나는 데 1시간 이상이 소요됩니다. 돌아올 수 있습니다) 15분 프레임으로 갔다가 30분
PZ Harmonacci Patterns MT5
PZ TRADING SLU
3.25 (4)
This is arguably the most complete harmonic price formation auto-recognition indicator you can find for the MetaTrader Platform. It detects 19 different patterns, takes fibonacci projections as seriously as you do, displays the Potential Reversal Zone (PRZ) and finds suitable stop-loss and take-profit levels. [ Installation Guide | Update Guide | Troubleshooting | FAQ | All Products ] It detects 19 different harmonic price formations It plots primary, derived and complementary Fibonacci p
제작자의 제품 더 보기
AI Channel
Thalles Nascimento De Carvalho
4 (4)
Welcome to the presentation of the AI Channel indicator, a powerful tool that uses artificial intelligence for price channel analysis in the financial market. In this session, we will explore how this revolutionary indicator can assist investors and traders in making more informed and strategic decisions. Let's get started! I. What is the AI Channel indicator? AI Channel is an indicator developed based on advanced artificial intelligence algorithms. It utilizes historical price data of financial
FREE
Master OBV FX
Thalles Nascimento De Carvalho
5 (1)
The MasterOBV indicator is a powerful technical analysis tool that utilizes volume, positive correlation, and a Moving Average (MA) to enhance trend identification in financial markets. By incorporating assets with positive correlation through the indicator menu, MasterOBV provides a refined approach to assessing the strength and direction of trends. The inclusion of the Moving Average adds additional smoothing to price movements, aiding in a more accurate tracking of the underlying trend over
FREE
Long Short
Thalles Nascimento De Carvalho
4.67 (3)
Long & Short Indicator, tracks the movements of assets that have positive or negative correlation allowing to explore displacement in advance. - High Hit Rate With Real Time Information. - More Safe Entries in Operations. - Facilitates Short and Long Term Reading. - Option to trigger alert for the Levels. Information for Ea Buffer Symbol 1ª = 0 ;  Buffer Symbol 2ª = 2 ; * Free version only EURUSD! 
FREE
Swing Point Volume
Thalles Nascimento De Carvalho
Swing Point Volume, the indicator that signals weakness and strength at the tops and bottoms. This indicador can be for used the Wyckoff Method. Information provided; - Swing on customized ticks. - Volume and points in each balance sheet. - Percentage of Displacement. - Sound alert option on top and bottom breaks. - Volume in ticks and Real Volume. - Volume HL (extreme) or (opening and closing) - Customized volume shapes.
Box Weis Wave
Thalles Nascimento De Carvalho
5 (1)
활발한 트레이더이며 금융 시장의 움직임을 효과적으로 해석하고자 한다면, Weis Wave Box에 대해 알아보시면 좋을 것입니다. 이 놀라운 인디케이터는 볼륨 웨이브와 해당 스윙 포인트의 시각적인 분석을 명확하고 정확하게 제공하기 위해 설계되었습니다. 5가지 사용자 정의 가능한 스윙 형태와 기타 독특한 기능을 갖춘 Weis Wave Box는 숙련된 트레이더와 초보자 모두에게 꼭 필요한 도구로 주목받고 있습니다. Weis Wave Box의 주목할 만한 기능 중 하나는 사용자 정의 틱 간격에서 볼륨 웨이브를 생성할 수 있는 능력입니다. 이를 통해 거래 선호도에 맞게 적응하고 전략에 정확하고 관련성 있는 결과를 얻을 수 있습니다. 또한, 이 인디케이터는 조정 가능한 히스토리 제한을 갖고 있어 원하는 시간 범위에 초점을 맞추고 특정한 추세를 분석할 수 있습니다. Weis Wave Box의 큰 장점 중 하나는 틱 볼륨과 실제 볼륨에 대한 정보를 제공할 수 있는 능력입니다. 이 두
Long Short Pro
Thalles Nascimento De Carvalho
효과적으로 롱(Long)과 숏(Short) 지표를 활용하고 다양한 자산 간의 상관관계를 활용하기 위해서는 몇 가지 기본적인 단계를 따르는 것이 중요합니다. 지표의 기초 이해하기: 롱과 숏 지표의 기반이 되는 메트릭과 계산 방법에 익숙해지세요. 통화쌍, 지수, 또는 암호화폐가 어떻게 상관관계를 가지며 이러한 자산들 간의 양의 또는 음의 상관관계를 식별하는지 이해하세요. 자산들 간의 상관관계 분석하기: 관심 있는 자산들 간의 상관관계를 모니터링하기 위해 롱과 숏 지표를 사용하세요. 시간이 지남에 따라 통화쌍, 지수, 또는 암호화폐들 간의 관계를 관찰하고 양의 또는 음의 상관관계 추세를 확인하세요. 양의 발산(다이버전스) 식별하기: 관련된 다른 자산보다 강한 성과를 보이는 자산을 찾으세요. 이는 거래 기회를 나타낼 수 있으며, 강한 자산이 계속해서 가치를 상승시킬 가능성이 있는 반면, 다른 자산은 더 약한 성과를 보일 수 있습니다. 음의 발산(다이버전스) 활용하기: 마찬가지로, 다른 자산
Reversal Vol Propagation
Thalles Nascimento De Carvalho
Are you tired of missing out on trading opportunities by not being able to identify price reversals in time? Do you want to maximize your profits and make informed trading decisions? Introducing the Reversal Vol Propagation Indicator, the revolutionary tool that uses neural networks and volume data to predict potential price reversals. Based on a powerful combination of advanced algorithms and cutting-edge technology, the Reversal Vol Propagation meticulously analyzes volume patterns and past pr
Didi Index Volume
Thalles Nascimento De Carvalho
디디 지수 볼륨(Didi Index Volume)을 소개합니다. 이는 브라질 트레이더 오디르 아기아르(Odir Aguiar)이 개발한 기술적 분석 지표로, 금융 시장에서 기회를 식별하는 고급이고 강력한 접근 방식으로 주목받고 있습니다. 다양한 플랫폼에서 이용 가능한 디디 지수 볼륨은 정확한 통찰력과 가치 있는 정보를 찾는 트레이더들에게 필수적인 도구가 되었습니다. 이 지표는 오디르 아기아르가 개발한 유명한 디디 지수(Didi Index)와 거래량의 지능적인 활용을 결합합니다. 이 조합은 가격 동작과 거래량의 상호작용을 더 깊게 분석하여 자산의 움직임에 대한 독특한 시각을 제공합니다. 정교한 알고리즘과 가중 평균 계산을 통해 디디 지수 볼륨은 거래량을 기반으로 가격 변동을 예측할 수 있습니다. 이 기능은 신흥 트렌드, 시장 반전 및 적시적인 진입 및 청산 시점을 파악하는 데 매우 중요합니다. 디디 지수 볼륨을 사용하면 정확한 시장 해석을 돕고 허무맹랑한 결정을 피할 수
Smart Binary Volume
Thalles Nascimento De Carvalho
스마트 바이너리 볼륨 인디케이터는 거래량 분석과 머신 러닝을 결합한 다목적 도구입니다. 스캘핑과 같은 단기 거래를 포함하여 다양한 시장과 전략에 적용할 수 있습니다. 고급 머신 러닝 알고리즘을 사용하여 이 인디케이터는 복잡한 패턴을 인식하고 더 정확한 매수 및 매도 신호를 생성합니다. Buffer to Create EA. Buffer Line Gold = 0. Buffer Line Red = 2 Buffer   AI  =  3 AI Buffer  >=  0  ("SIGNAL BUY") AI Buffer  <=  0  ("SIGNAL SELL") 사용 팁: 1. 대비되는 선들에 주의하십시오: Smart Binary Volume 지표의 선들이 대비되는 움직임을 보이는 상황에 주목하십시오. 이러한 조건은 진입 신호를 나타낼 수 있습니다. 2. 상승 신호: 파란색 라인이 0.30보다 높고 빨간색 라인이 -0.30 아래에 위치하는 경우 주의하세요. 이러한 설정은 상승
TimeChannel
Thalles Nascimento De Carvalho
The "Timechannel" is a powerful technical analysis tool designed specifically for traders who want to gain deeper and more accurate insights into price movements across multiple timeframes (multi-timeframe). This indicator is an essential addition to the toolbox of any serious trader seeking to make informed and data-driven trading decisions. Key Features: Advanced Multi-Timeframe Analysis : Timechannel allows traders to analyze price movements on different timeframes simultaneously. This is cr
DeltaBook
Thalles Nascimento De Carvalho
델타 북(Delta Book) 지표는 주식, 선물 및 암호화폐와 같은 금융 시장에서 가격 흐름을 감지하기 위해 볼륨 델타와 오더북(order book) 정보를 결합하는 강력한 시장 분석 도구입니다. 델타 북은 그 최대 잠재력을 실현하기 위해 실시간 볼륨 데이터와 오더북 정보에 액세스해야 한다는 점을 주목해야 합니다. 델타 북의 주요 특징은 시장 참가자의 행동에 대한 상세한 정보를 기반으로 트렌드와 거래 기회를 식별할 수 있는 고급 시장 분석 전략입니다. 델타 북 지표를 설명하기 위한 몇 가지 팁과 중요한 측면은 다음과 같습니다: 볼륨 델타: 볼륨 델타는 특정 시간 내에 매수(수요)와 매도(공급)된 볼륨의 차이입니다. 이 지표는 매수자와 매도자 간의 불균형을 양적으로 나타내며 시장에서 매수 및 매도 압력의 변화를 식별하는 데 도움을 줍니다. 오더북: 오더북은 시장에서 모든 매수 및 매도 주문의 실시간 레코드입니다. 이것은 트레이더들이 자산을 구매하고 판매하려는 가격 및 해당 가격에서
Big Player Range
Thalles Nascimento De Carvalho
5 (2)
"BigPlayerRange" 지표에 오신 것을 환영합니다. 이것은 시장에서 금융 기관이 주목하는 중요한 영역을 식별하기 위해 개발된 기술 분석 도구입니다. 이 지표는 시장 주요 참여자들이 상당한 활동과 관심을 나타내는 가격 범위를 정확하게 분석합니다. 주요 기능: 1. 기관 관심 영역 매핑: "BigPlayerRange"는 금융 기관이 강한 활동을 나타내는 차트 영역을 정확하게 강조합니다. 이러한 지점은 전략적으로 중요하며 시장 움직임에 대한 통찰력을 제공합니다. 2. 출구 참조로서 예측: 관심 영역을 식별하는 것뿐만 아니라, 이 지표는 예측을 두 단계로 나눠 가능한 출구 참조로 사용합니다. 이러한 예측은 향후 가격 방향을 기반으로 전략을 계획하는 데 도움이 됩니다. 3. 식별된 범위로의 복귀 시 Pullback 확률: "BigPlayerRange"의 독특한 기능 중 하나는 가격이 관심 범위로 복귀할 때 Pullback 확률을 계산할 수 있는 능력입니다. 이는
Master OBV
Thalles Nascimento De Carvalho
The MasterOBV indicator is a powerful technical analysis tool that utilizes volume, positive correlation, and a Moving Average (MA) to enhance trend identification in financial markets. By incorporating assets with positive correlation through the indicator menu, MasterOBV provides a refined approach to assessing the strength and direction of trends. The inclusion of the Moving Average adds additional smoothing to price movements, aiding in a more accurate tracking of the underlying trend over
Smart Delta Volume
Thalles Nascimento De Carvalho
스마트 델타 볼륨은 시장의 변동성에 따라 자동으로 조정되는 동적 수준을 활용합니다. 이러한 특징은 시장 조건의 실시간 변화에 대한 더 정확하고 적응 가능한 분석을 보장합니다. 동적으로 조정하는 능력을 갖춘 스마트 델타 볼륨은 거래량 및 가격 행동에 대해 보다 포괄적이고 신뢰할 수 있는 시각을 제공합니다. 또한, 스마트 델타 볼륨은 가격이 두 동적 수준을 초과할 때 트리거되는 풀백 유효성 검증기를 갖추고 있습니다. 이 조건은 풀백의 유효성을 확인하고 식별된 트렌드에 대한 신뢰를 높입니다. 이러한 풀백의 객관적인 검증은 트레이더에게 중요하며, 잘못된 신호를 피하고 신중하고 안전한 거래 결정을 내릴 수 있도록 돕습니다. 거래 기회를 정확하게 식별하고 지속적으로 변화하는 시장 조건에 적응하며 트렌드와 풀백을 객관적으로 확인하는 스마트 델타 볼륨 지표는 경험 많은 트레이더의 기술적 분석 도구로서 귀중한 역할을 합니다.
필터:
리뷰 없음
리뷰 답변