Fibonacci Auto
- 지표
- Makarii Gubaydullin
- 버전: 1.0
- 활성화: 10
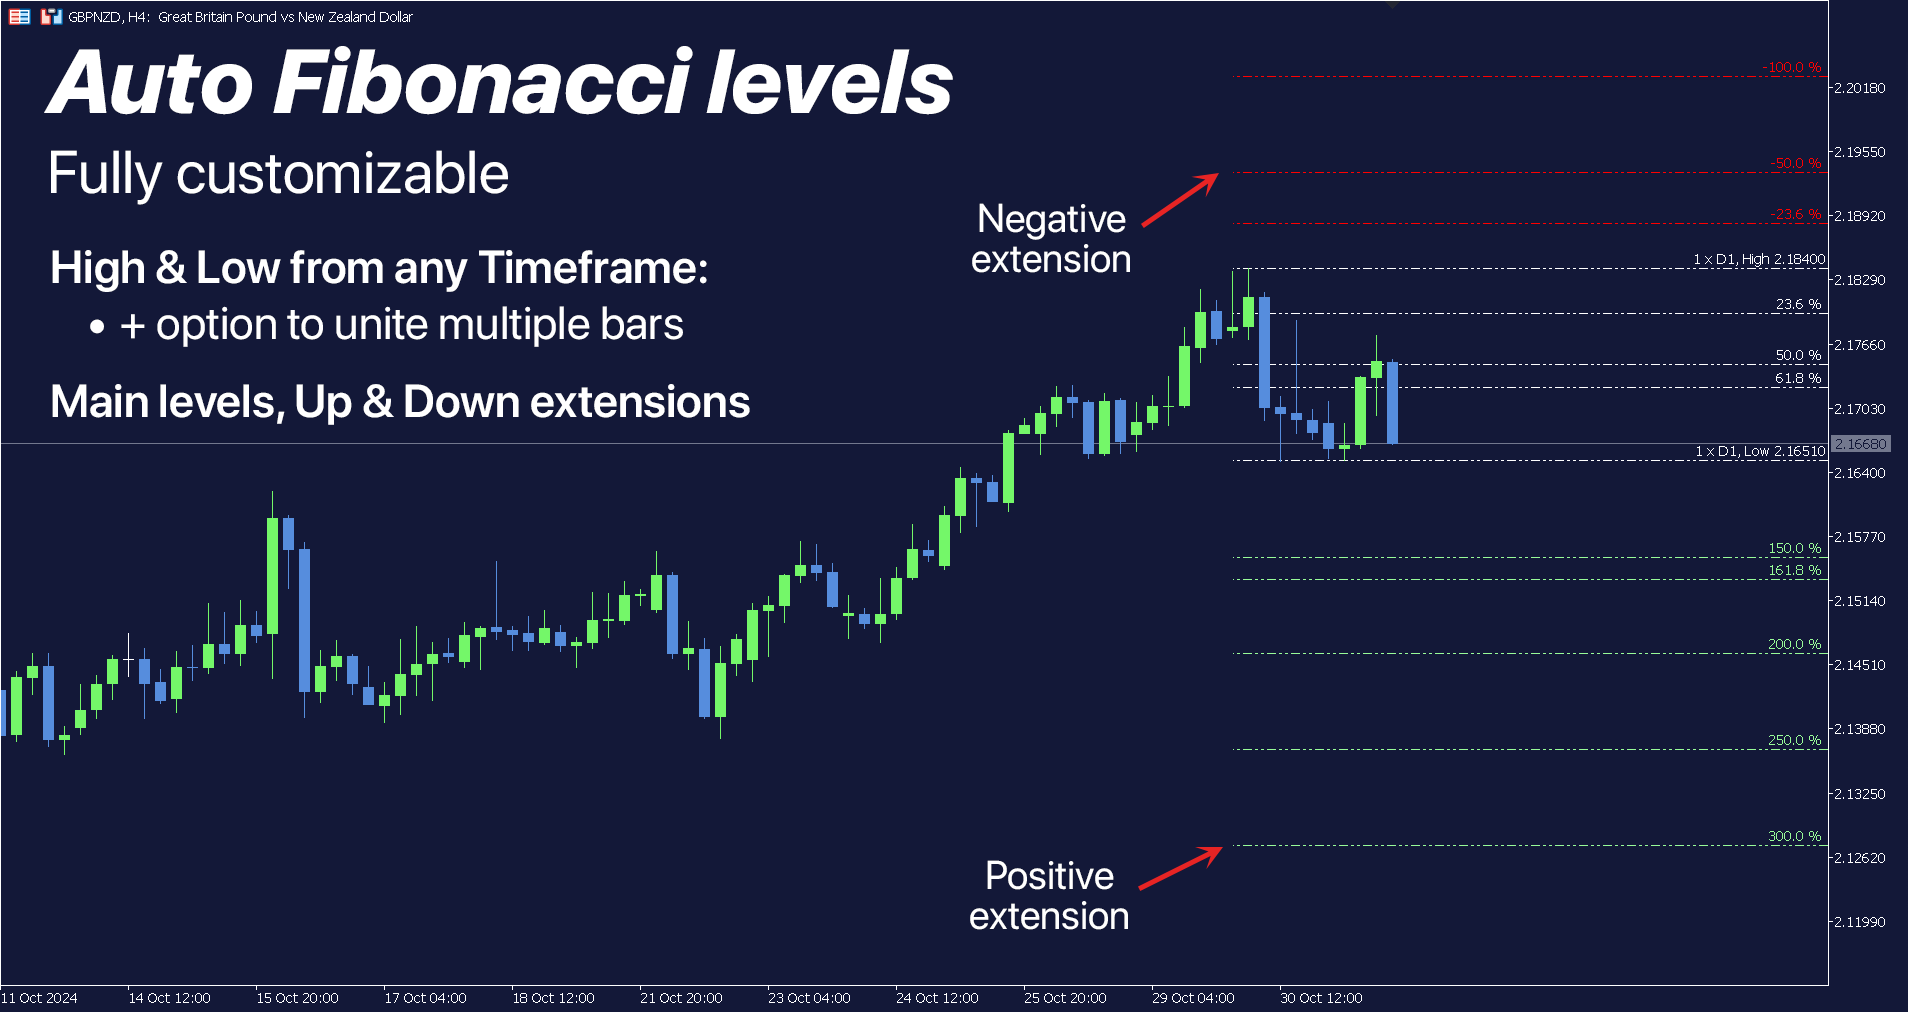
Automatically plots Fibo levels, based on the High & Low prices from the specified time frame
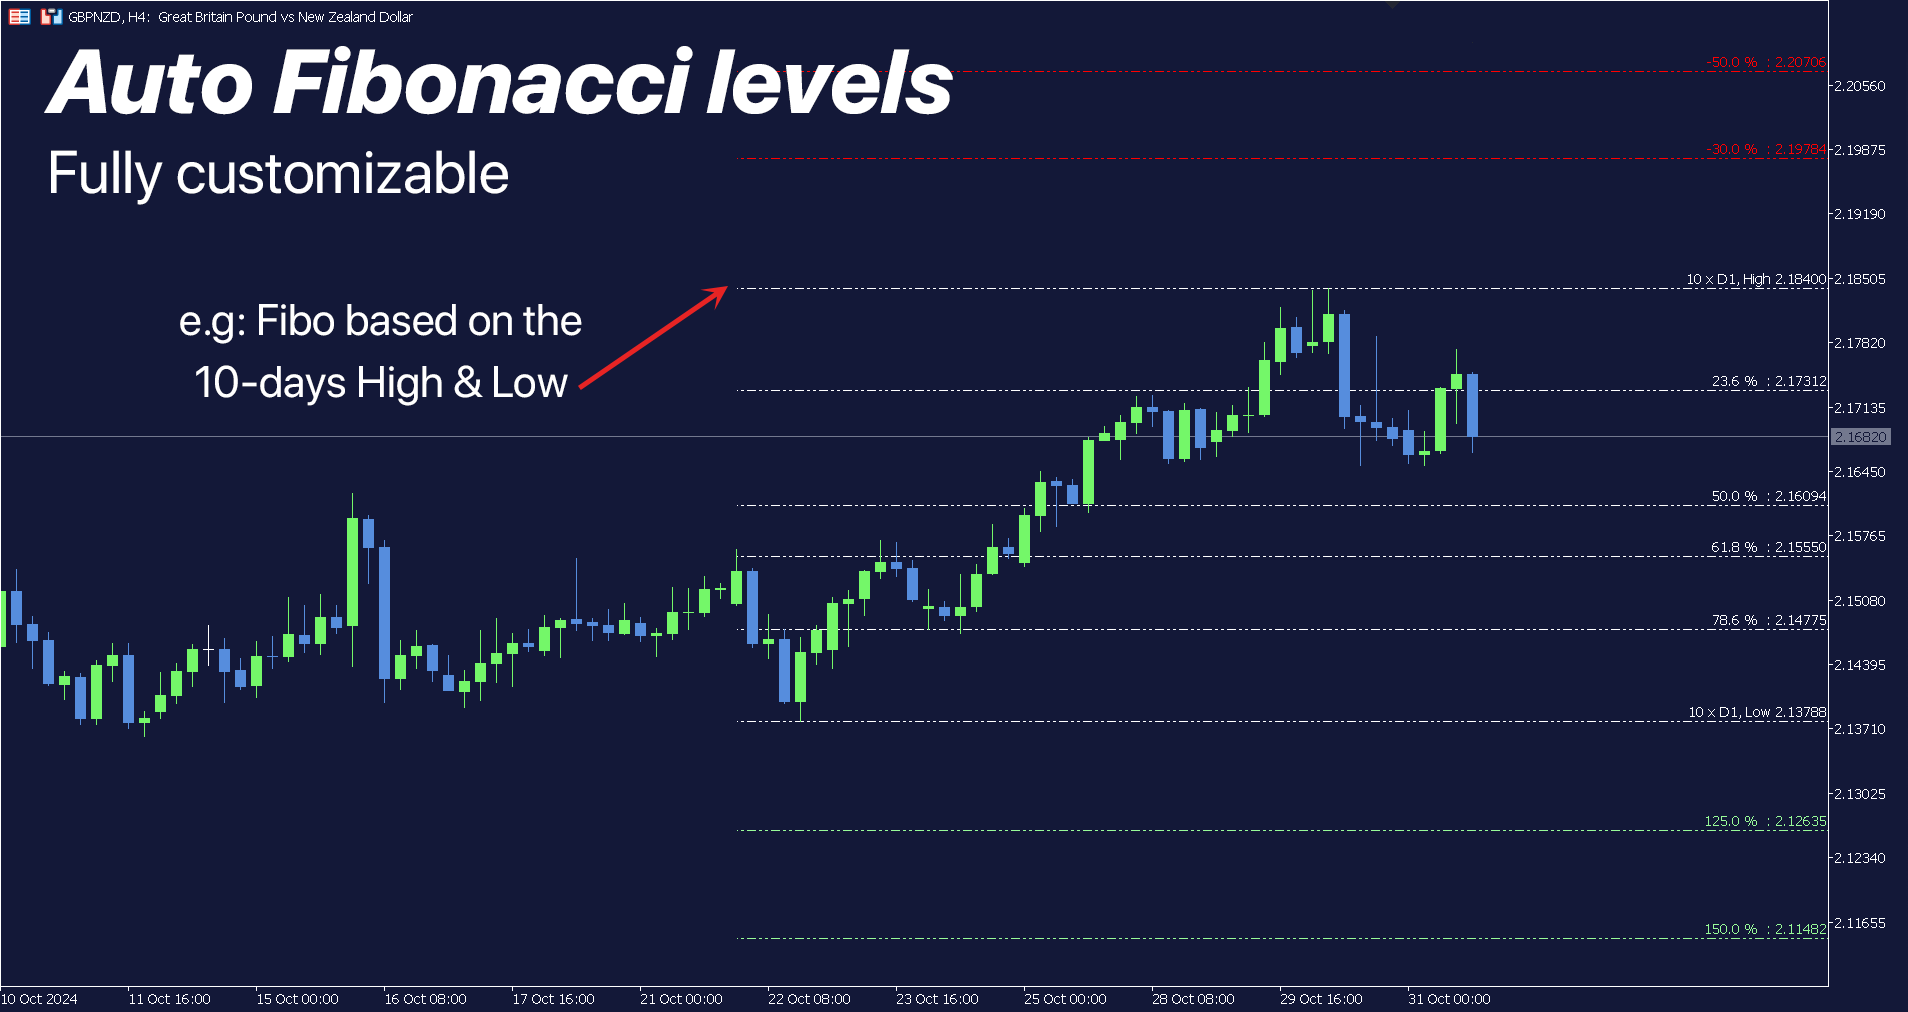
Multiple bars may be united: e.g. you can get a Fibo based on the 10-days Highs and Lows
My #1 Utility: 65+ features, including this indicator | Contact me for any questions | MT4 version
- Helps to see potential reversal levels;
- Patterns formed at the Fibo levels tend to be stronger;
- Significantly reduces the time spent on manual plotting;
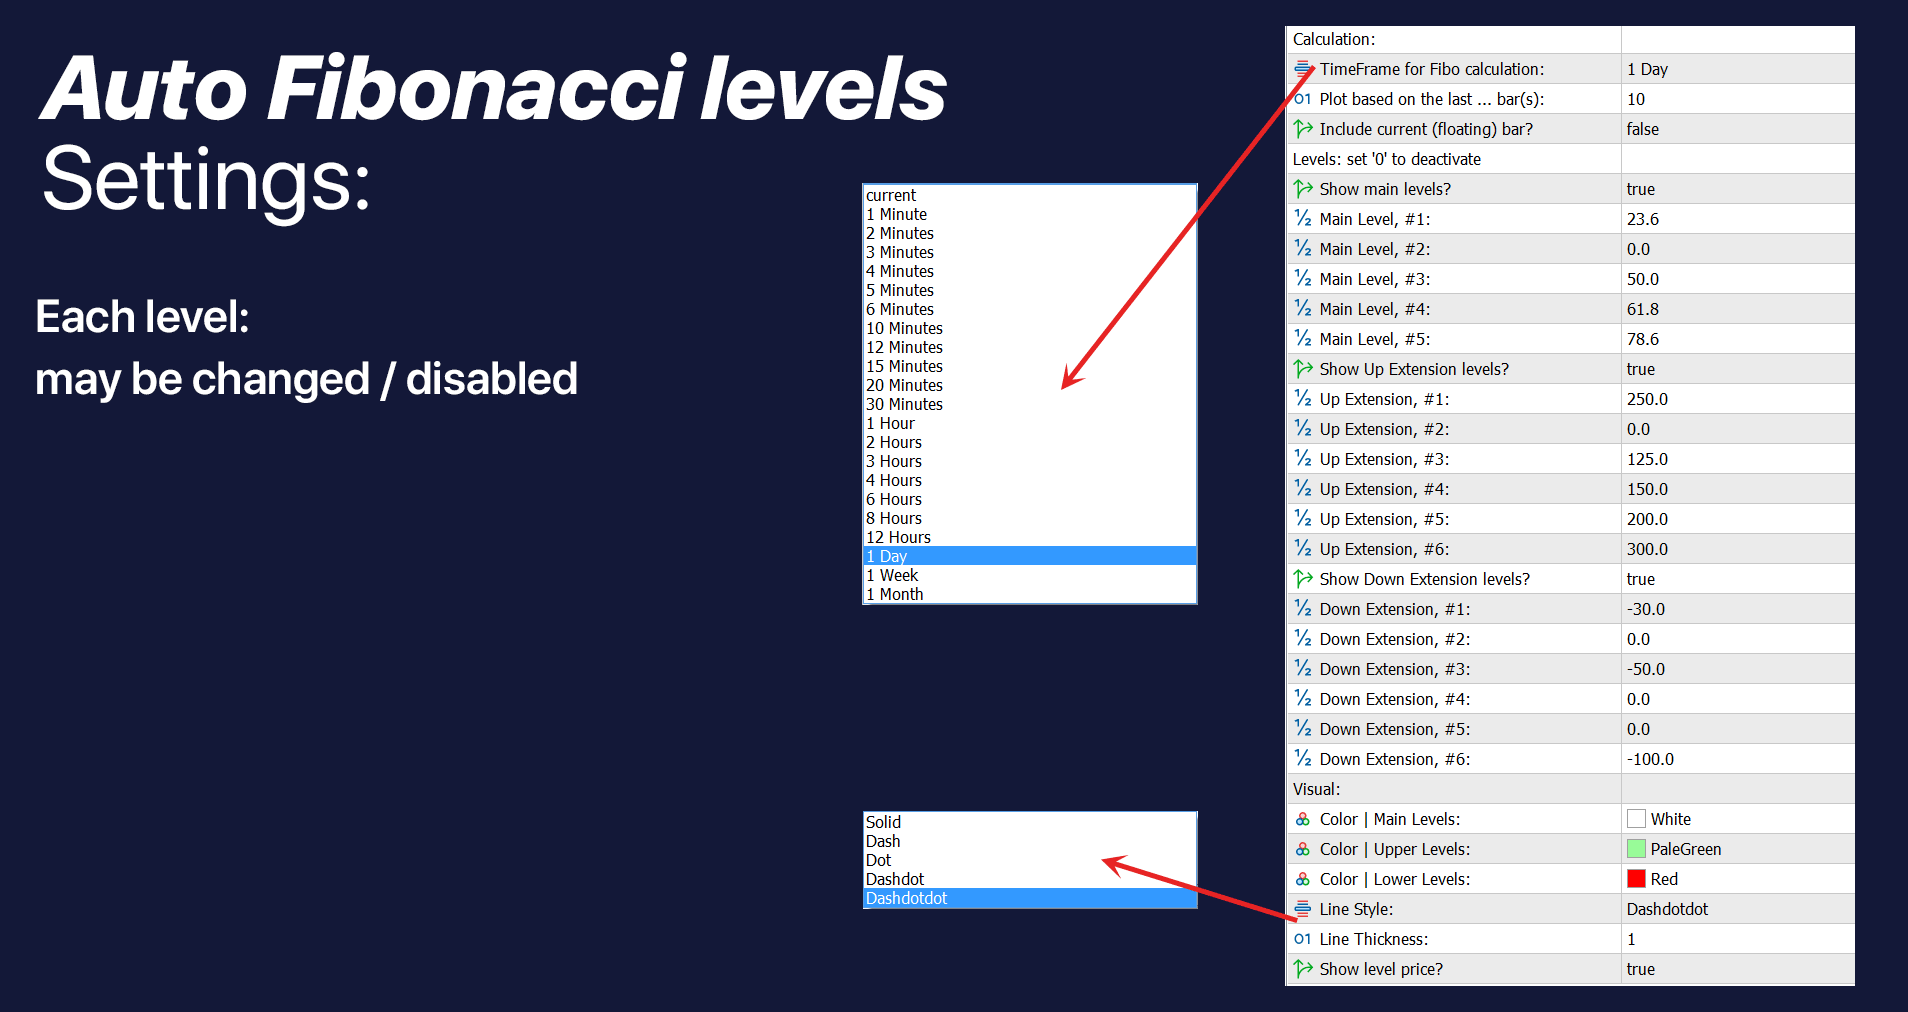
Settings:
- Timeframe to calculate the base High & Low prices
- Amount of periods to calculate the base prices
- Current (floating) bar may be included / excluded
- Each level may be customized, or disabled (set 0 to turn off)
- You can also disable the whole group of levels: separetely for main, Up and Down extensions
- Line colors, style and thickness
- Level prices may enabled / disabled