BTFX Pivot Points
- 지표
- Bradley Thomas Farrington
- 버전: 1.0
- 활성화: 5
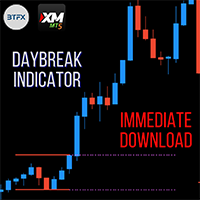
The BTFX Pivot Points is an indicator which calculates the Support and Resistance levels for each day. By using this indicator the pivot levels point out clear targets to aim for. The resistance levels are shown in purple above the silver pivot line. The support levels are shown in Orange and can be found below the silver pivot line. This indicators works very well when used with The BTFX Daybreak Indicator. For a more in depth explanation of these indicators please watch the Youtube video attached. For any other enquiries please contact us either by email or telephone.
support@besttradesfx.co.uk
01827 842 418


