Implied Volatility
- 유틸리티
- Guilherme Emiliao Ferreira
- 버전: 1.2
- 업데이트됨: 26 11월 2020
- 활성화: 5
ImpliedVolatility MT5
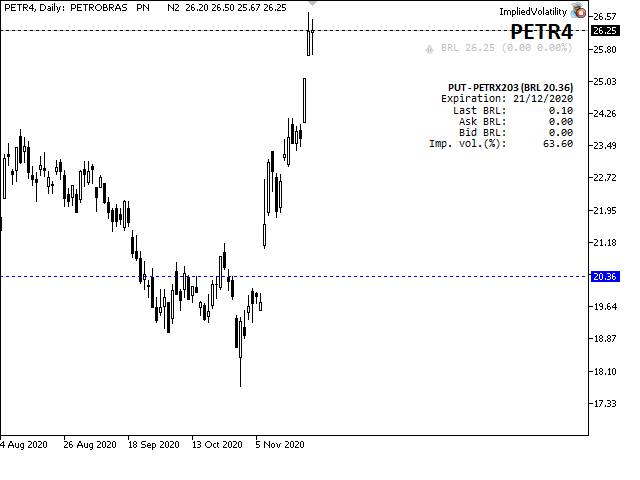
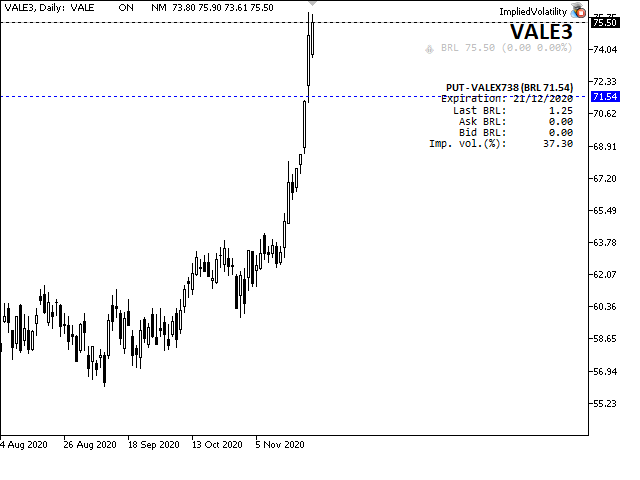
"ImpliedVolatility" is an EA developed to calculate the implied volatility of a stock option. As it is not observable, it is calculated by iteration using the Black & Scholes model.
The implied volatility is not the same as historical volatility, also known as realized volatility or statistical volatility. The historical volatility figure will measure past market changes and their actual results.It does not predict the direction in which the price change will proceed. For example, high volatility means a large price swing, but the price could swing upward (very high) downward (very low) or fluctuate between the two directions. Low volatility means that the price likely won't make broad, unpredictable changes.
The Black-Scholes Model, a widely used and well-known options pricing model, factors in current stock price, options strike price, time until expiration (denoted as a percent of a year), and risk-free interest rates. The Black-Scholes Model is quick in calculating any number of option prices.
Implied volatility does not have a basis on the fundamentals underlying the market assets but is based solely on price. Also, adverse news or big events may impact it.
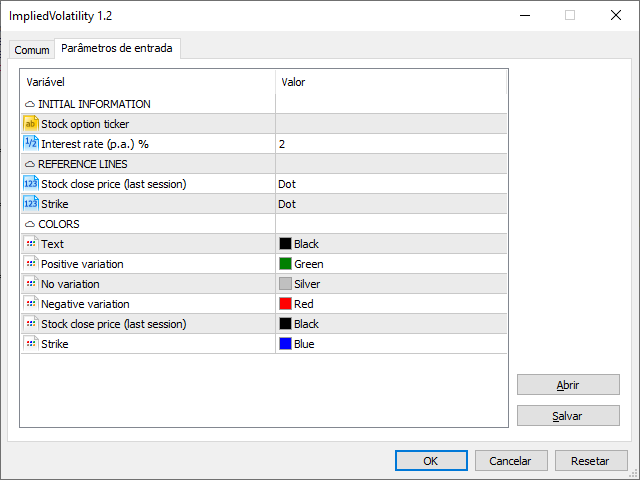
Input Parameters
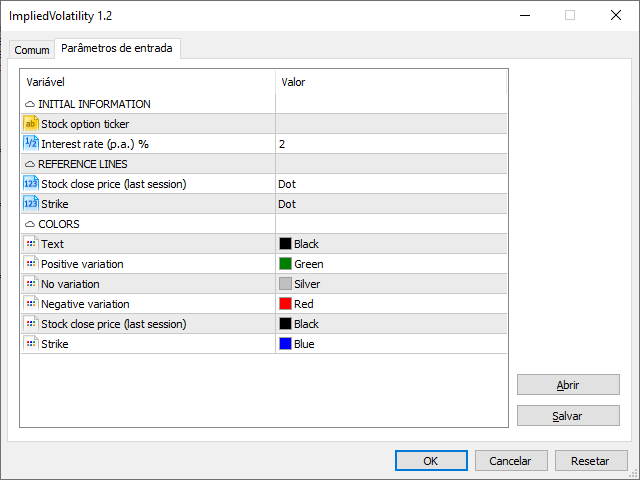
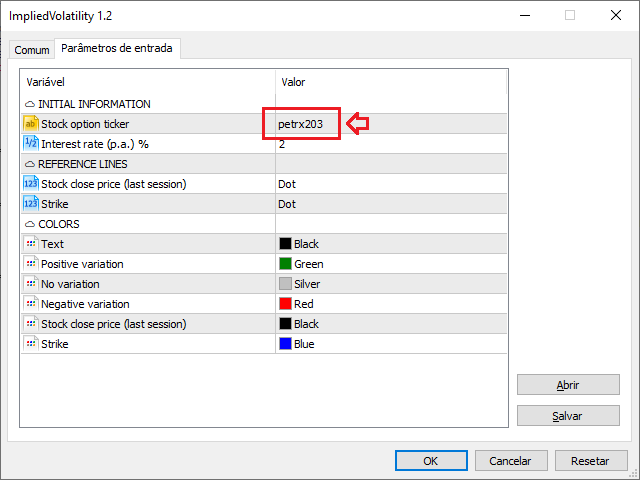
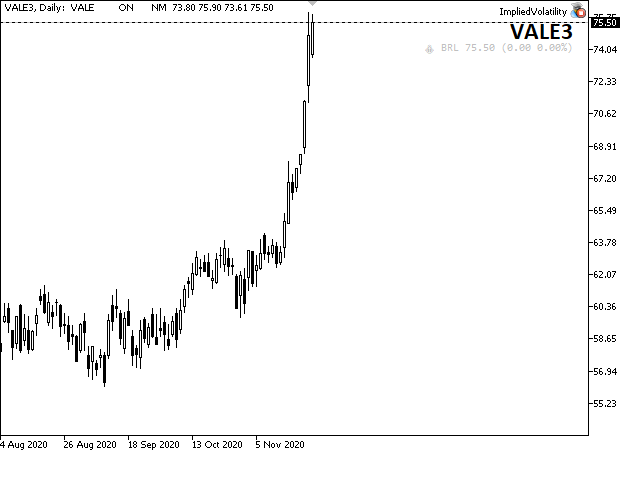
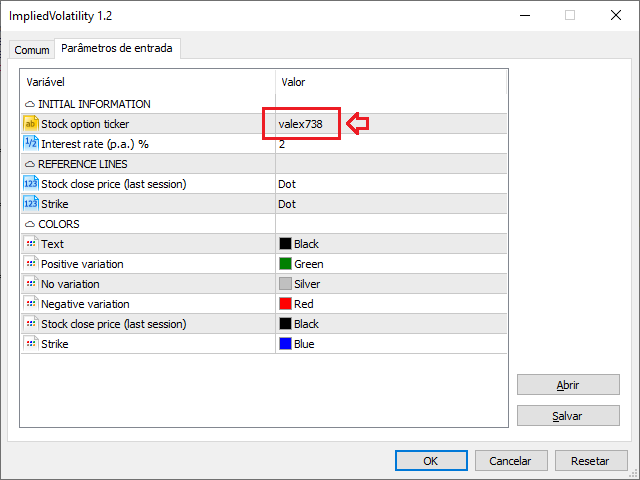
Stock option ticker = ticker of the option to calculate the implied volatility. If left blank it will show basic information of the current chart symbol (last value, variation and percentage from last session close value).
Interest rate (p.a.) % = risk-free interest rate must be entered in p.a. (per annum) %.
Stock close price (last session) = black dot line (default) based on the current chart symbol's last session close value.
Strike = blue dot line (default) based on the option strike price.
Text = color of the default text.
Positive variation = color of the text below the current chart symbol and the price line when the variation is positive.
No variation = color of the text below the current chart symbol and the price line when the variation is null.
Negative variation = color of the text below the current chart symbol and the price line when the variation is negative.
Stock close price (last session) = color of the line based on the current chart symbol's last session close value.
Strike = color of the line based on the option strike price
Holidays considered in 2020
Holidays do not count as business days for calculating implied volatility. The following holidays were considered in the current version, according to the calendar published by the Brazilian Association of Entities in the Financial and Capital Markets:
01/01/2020 Universal fraternization
02/24/2020 Carnival
02/25/2020 Carnival
04/10/2020 Passion of the Christ
04/21/2020 Tiradentes
05/01/2020 Labor Day
06/11/2020 Corpus Christi
09/07/2020 Independence of Brazil
10/12/2020 Our Lady of Aparecida - Patroness of Brazil
11/02/2020 All Souls
11/15/2020 proclamation of the Republic
12/25/2020 Christmas
