Heatmap 105
- 지표
- Alain Verleyen
- 버전: 1.21
- 업데이트됨: 22 11월 2021
- 활성화: 5
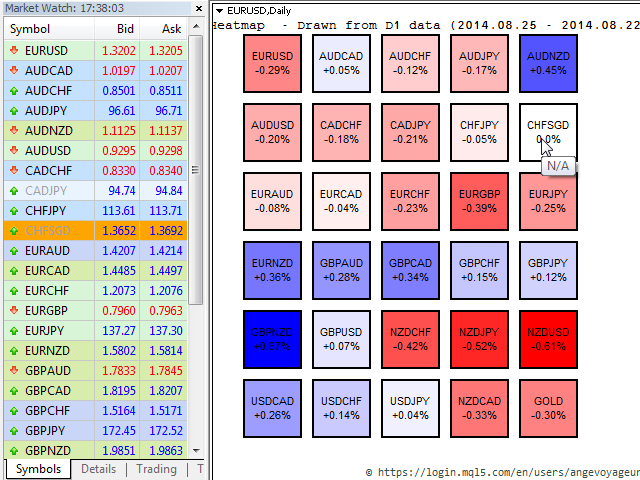
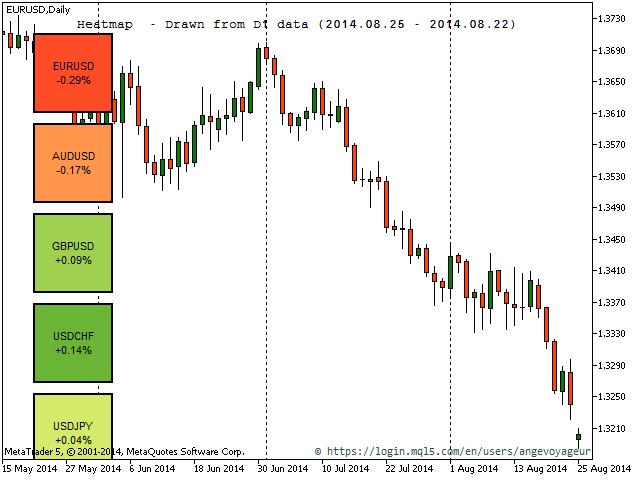
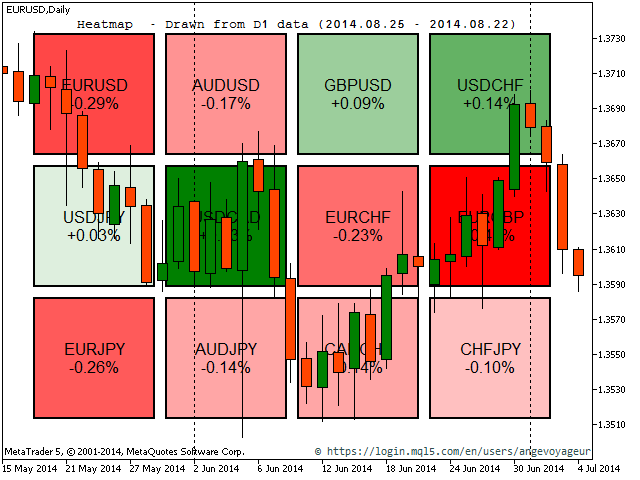
히트맵 인디케이터
이 히트맵 인디케이터를 사용하면 마켓 워치에서 선택한 모든 종목의 "히트맵"을 표시할 수 있습니다. 이 버전에서는 마지막 일일 종가 대비 퍼센트 가격 변동률을 표시하여 시장에 대한 빠른 개요를 제공할 수 있습니다.
이 도구는 트레이더가 다른 모든 통화쌍과 비교하여 통화가 얼마나 강한지 식별하는 데 도움이 되는 도구입니다. 이 도구는 시각적 도구이며 전문가용 어드바이저에서는 사용할 수 없습니다. 따라서 자동 트레이더가 아닌 임의 트레이더를 위한 도구에 가깝습니다. 따라서 이 도구를 자동매매에 사용하고자 하는 분은 안타깝게도 불가능합니다
이 도구는 브라질 거래소 보베스파 등 주식 또는 선물 시장에 특히 유용합니다.
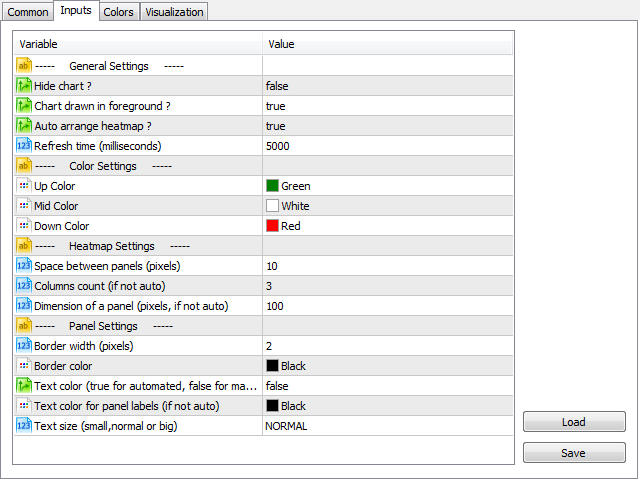
설정
핫맵 인디케이터에서 사용자 지정할 수 있는 몇 가지 설정이 있습니다.
| 설정 | 가능 값 | 설명 |
|---|---|---|
| 차트 숨기기 ? | True/False | 차트를 완전히 숨기거나 그대로 유지할 수 있습니다. 차트에서 인디케이터를 제거하면 차트가 복원됩니다. |
| 차트를 전경에 표시할까요 ? | True/False | 이전 설정이 True인 경우 차트를 전경(true) 또는 배경(false)으로 표시하도록 선택할 수 있습니다. |
| 열맵 자동 정렬 ? | 참/거짓 | 참이면 모든 크기 조정 및 정렬이 자동으로 수행됩니다. 그렇지 않으면 추가 설정을 선택해야 합니다. |
| 새로 고침 시간(밀리초) | >=1000 | 데이터는 기본적으로 5초마다 새로 고쳐집니다. 최소값은 1,000(1초)입니다. |
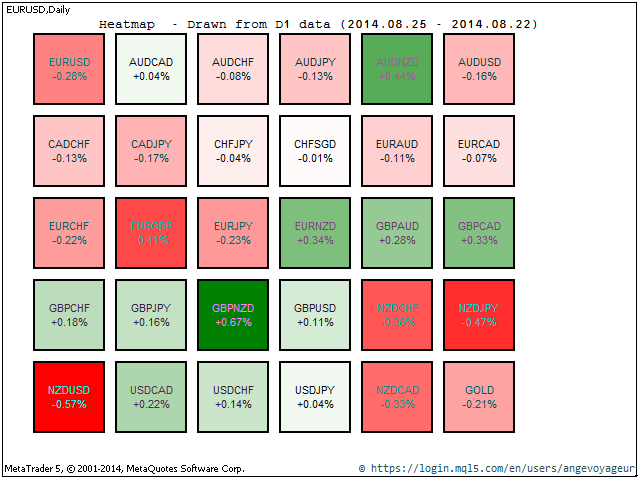
| 상단 색상 | 모든 색상 | 기본값은 파란색입니다. 이 색은 양수 퍼센트 변화율을 가진 기호를 표시하는 데 사용됩니다. |
| 중간색 | 모든 색상 | 기본값은 흰색입니다. 증가 또는 감소가 없는(0%) 기호에 사용되는 중성 색상입니다. |
| 하위 색상 | 모든 색상 | 기본값은 빨간색입니다. 이 색상은 가격의 마이너스 변동률을 나타내는 데 사용됩니다. |
| 패널 사이의 간격(픽셀) | >=0 | 핫맵의 두 패널(기호) 사이의 간격입니다. |
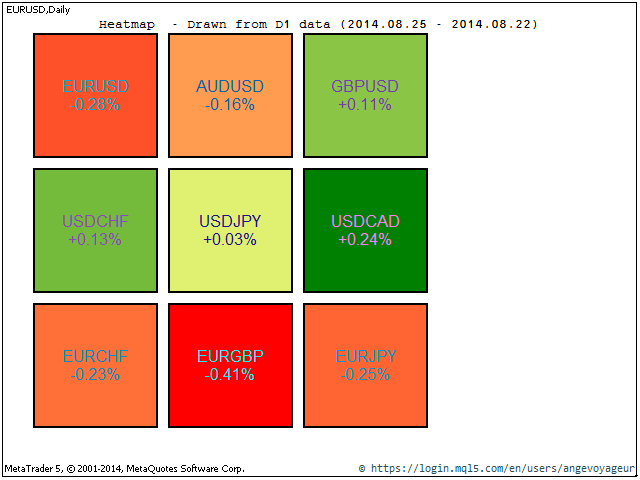
| 열 수(자동이 아닌 경우) | >=1 | "자동 정렬 히트맵?"이 false인 경우에만 사용됩니다. 히트맵을 표시하는 데 사용할 열의 개수를 나타냅니다. |
| 패널의 크기(픽셀, 자동이 아닌 경우) | >=50 | "히트맵 자동 정렬?"이 false인 경우에만 사용됩니다. 히트맵에서 심볼의 패널 크기를 나타냅니다. |
| 테두리 너비(픽셀) | >=0 | 심볼 패널의 테두리 크기. |
| 테두리 색상 | 모든 색상 | 심볼 패널의 테두리 색상입니다. |
| 텍스트 색상(자동의 경우 true, 수동의 경우 false) | True/False | 텍스트 레이블에 사용되는 색상(기호 이름 및 백분율)입니다. True=자동, false=수동(다음 매개변수 참조). |
| 패널 레이블의 텍스트 색상(자동이 아닌 경우) | 모든 색상 | 이전 설정이 false인 경우 패널의 텍스트 레이블에 이 색이 사용됩니다. |
| 텍스트 크기(작음, 보통 또는 큼) | 열거형 | 패널 레이블의 크기(이름 및 백분율) |
최대 허용 기호는 200개입니다. 종합시세에 200개가 넘는 종목이 포함된 경우 처음 200개만 표시됩니다. 많은 종목을 동시에 표시하려면 컴퓨터의 리소스(CPU, 메모리)가 충분해야 합니다.
질문, 의견, 제안이 있으시면 저에게 연락주세요. 좋은 거래 되세요.


Very nice! I would pay some extra bucks for a variable to add specific symbols (not all marketwatch) and the ability to put the symbols in an order.