Heatmap 105
- Indicators
- Alain Verleyen
- Version: 1.21
- Updated: 22 November 2021
- Activations: 5
The Heatmap Indicator
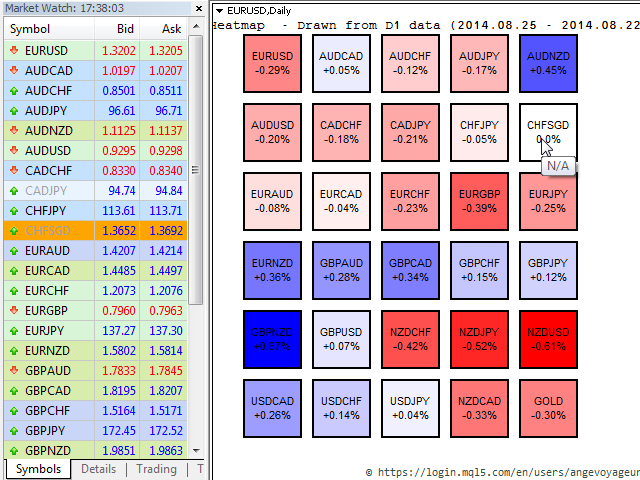
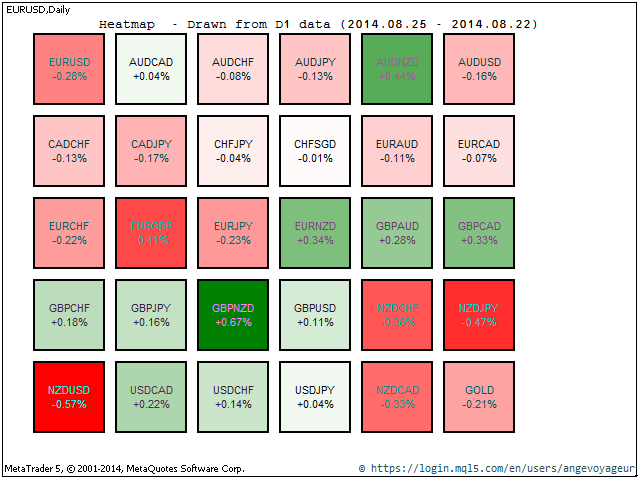
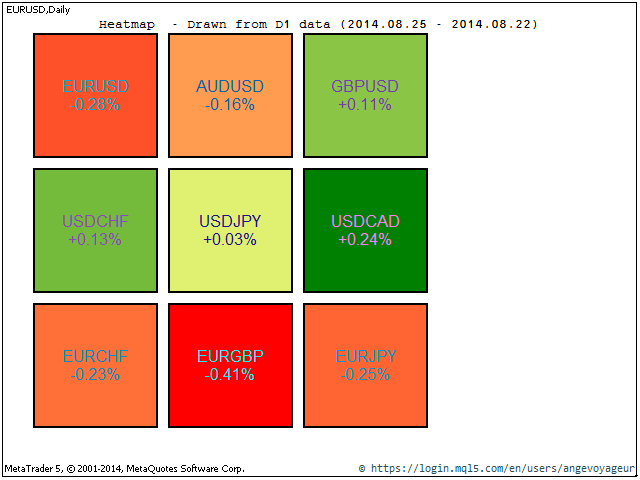
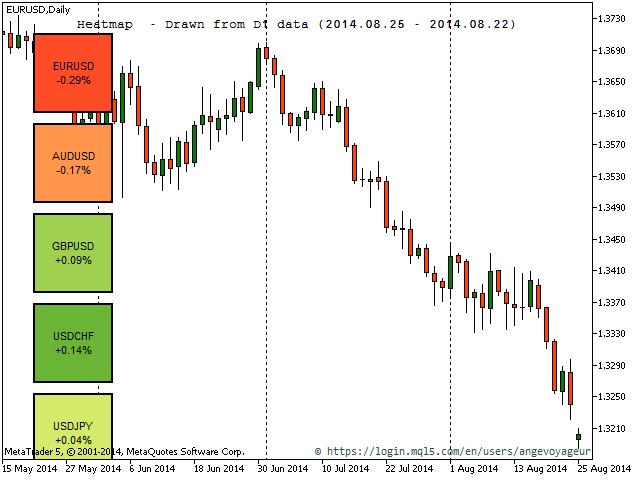
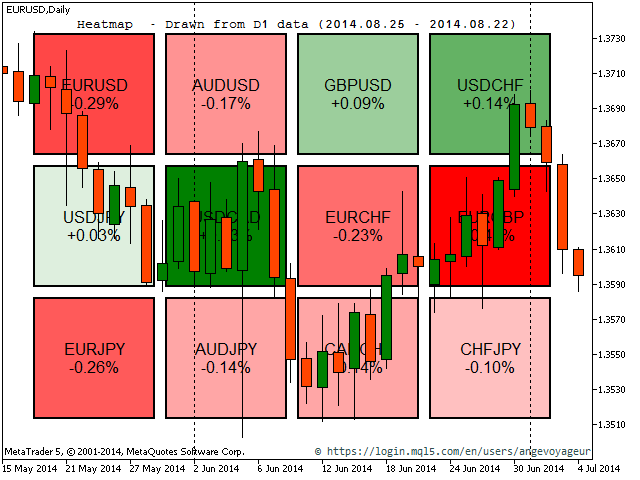
This Heatmap indicator allows you to display a "heatmap" of all symbols selected in the Market Watch. In this version it shows the percent price change in relation to the last daily close, what can give a quick overview of the market.
This is a tool to help traders identify how strong is a currency in relation to all other pairs. This is a visual tool, and cannot be used inside Expert Advisors. In this sense, it's more a tool for discretionary traders, instead of automated traders. So, for those interested in using this tool for automated trading, unfortunately this is not possible.
It's particularly useful for Stocks or Futures markets, like for example Bovespa the Brazilian Exchange.
Settings
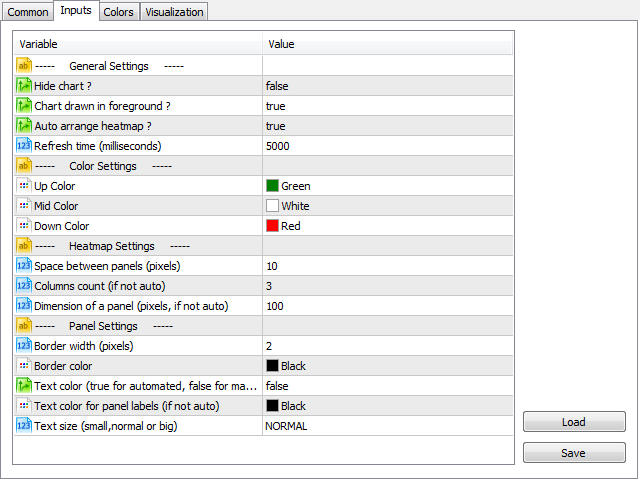
There are several settings to be customized in the heatmap indicator:
| Setting | Possible values | Description |
|---|---|---|
| Hide chart ? | True/False | You can completely hide the chart or keep it as is. Chart will be restored when indicator is removed from chart. |
| Chart drawn in foreground ? | True/False | If previous setting is True, you can choose to display the chart in foreground (true) or background (false). |
| Auto arrrange heatmap ? | True/False | If true, all sizing and arrangements are done automatically. Otherwise further settings must be selected. |
| Refresh time (milliseconds) | >=1000 | Data is refreshed every 5 seconds by default. Minimum value is 1,000 (1 second). |
| Up Color | any Color | Blue by default. This color is used to indicate the symbols with positive percent change. |
| Mid Color | any Color | White by default. This is the neutral color, used for symbols with no increase or decrease (0%). |
| Down Color | any Color | Red by default. The color is used to indicate negative percent change in price. |
| Space between panels (pixels) | >=0 | Space between 2 panels (symbols) of the heatmap. |
| Columns count (if not auto) | >=1 | Used only if "Auto arrange heatmap ?" is false. Indicates the column's count to be used to display the heatmap. |
| Dimension of a panel (pixels, if not auto) | >=50 | Used only if "Auto arrange heatmap ?" is false. Indicates the size of a symbol's panel on the heatmap. |
| Border width (pixels) | >=0 | Border size of a symbol's panel. |
| Border color | any color | Border color of a symbol's panel. |
| Text color (true for automated, false for manual) | True/False | Color used for text labels (symbol's name and percentage). True=automated, false=manual (see next parameter). |
| Text color for panel labels (if not auto) | any color | If previous setting is false, this color will be use for panel's text labels. |
| Text size (small, normal or big) | enum | Size of panel's labels (name and percentage). |
Maximum allowed symbols is 200. If the Market Watch contains more than 200, only the first 200 will be displayed. Please note that you need sufficient resource (CPU, Memory) on your computer if you want to display a lot of symbols simultaneously.
Please contact me if you have any question, remark or suggestion. Good trading.




Very nice! I would pay some extra bucks for a variable to add specific symbols (not all marketwatch) and the ability to put the symbols in an order.