Divergence Range
Divergence Range
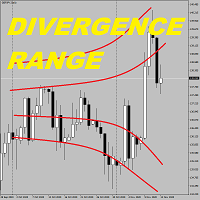
Divergence Range is a very simple and yet effective indicator that calculate the price divergence range from a standard moving average indicator.
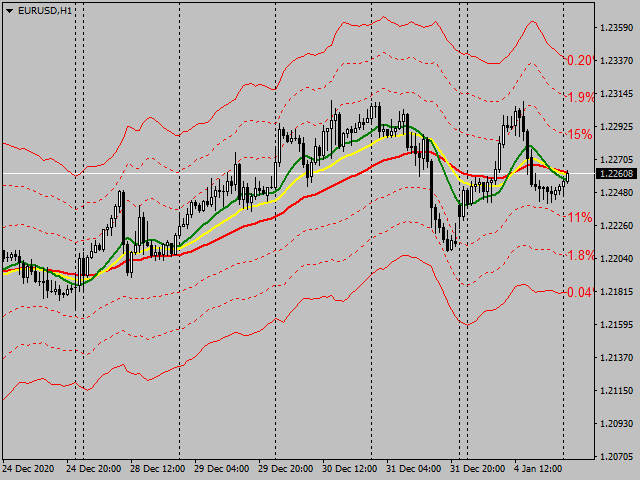
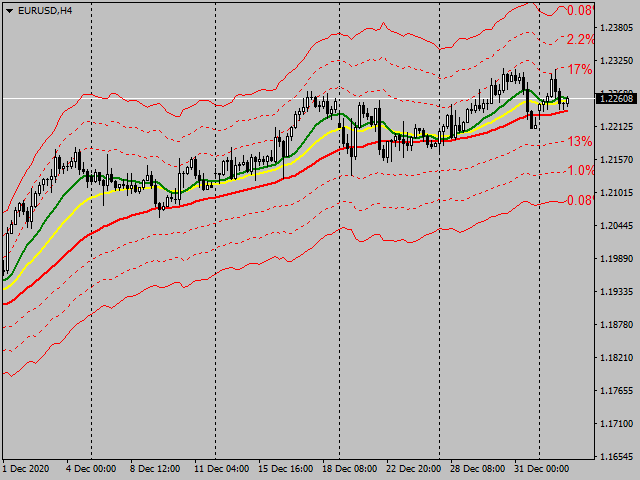
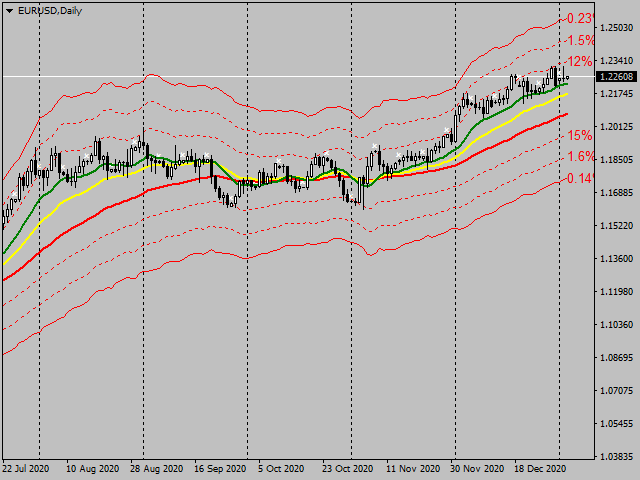
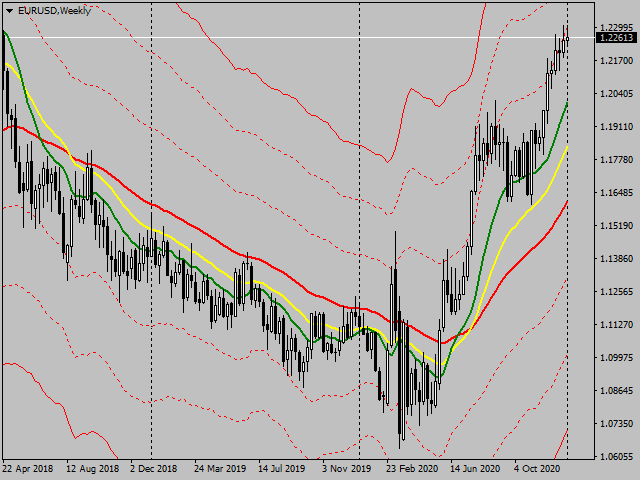
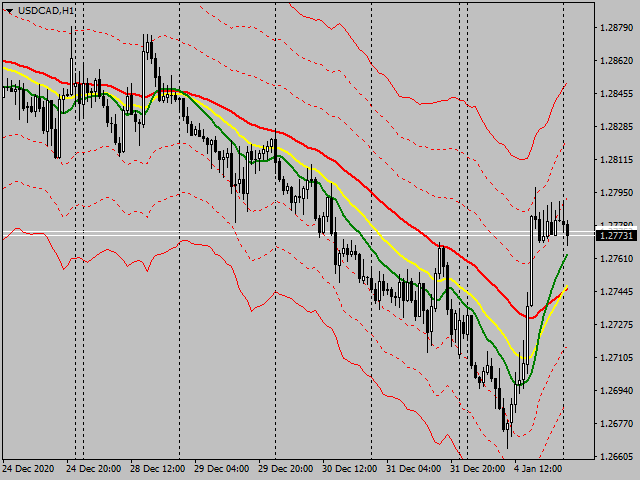
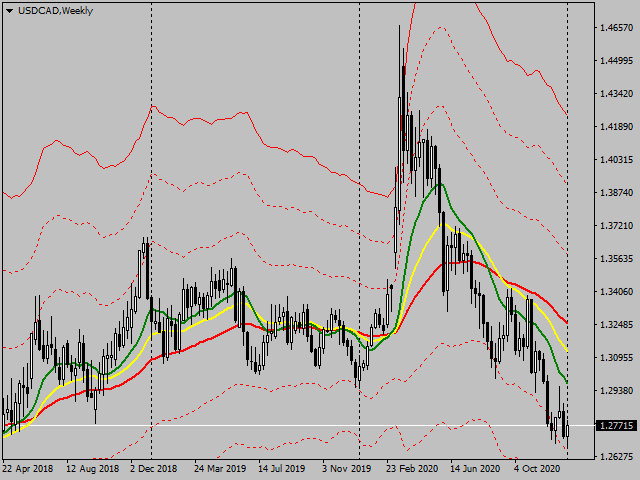
The indicator has two groups of line, three lines, upper1, upper2, upper3 above a standard moving average and three lines below, lower1, lower2, lower3, which shows the divergence range for the price movement from the standard moving average. The two out most line virtually covers more than 95% of the price movement from the standard moving average.
Parameters
Period = 48 (default)
Shift = 0 (default)
Method = Exponential (default)
Show Statistics = true (default)
Statistic Unit = 2500 (default)
Period/shift/Method: This is the standard period parameter for a moving average, you can select any type of moving average. The general guideline is that you shall relative longer period, to obtain a more stable and smooth divergence range.
Show Statistics/Statis unit: This are the parameter to show the statistic of the effectiveness of divergence range. It turns on, the indicator will show a percentage of the price high exceed the respective upper line and the percentage of low falls below the respective lower line.
Main features
1. Usually there are less than 20% of unit exceed the range covered between upper1 and lower1 line.
2. Usually there are less than 5% of unit exceed the range covered between upper2 and lower2 line.
3. Virtually there are less than 2% of unit exceed the range covered between upper3 and lower 3 line. These give you a confidence when price are at extreme situation, therefore the rally make happen soon.
Recommended trading strategy
· Apply the indicator to D1 or H4 chart for any product. And comebine it with other moving average trading strategy.
Please give your valuable feed back for me to improve the indicator.
