Average Price for MT5
- 지표
- Alexandr Ivanov
- 버전: 1.5
- 업데이트됨: 4 3월 2024
- 활성화: 10
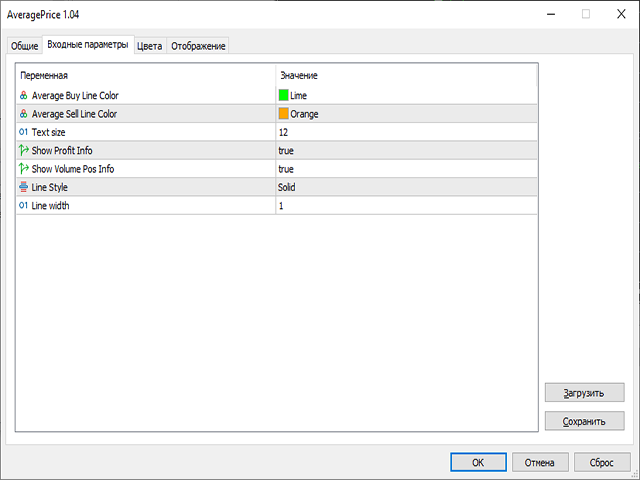
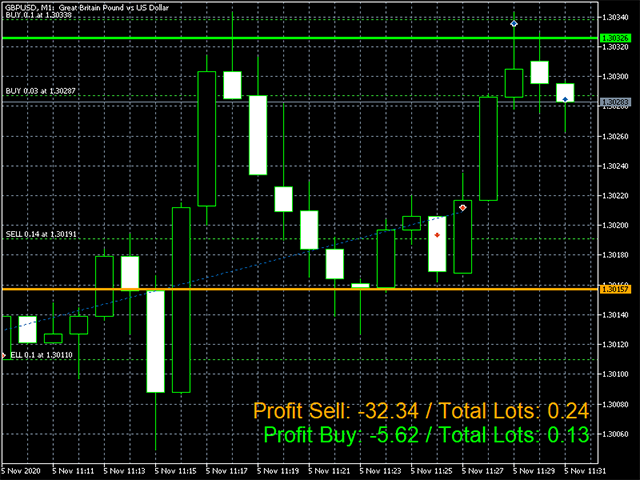
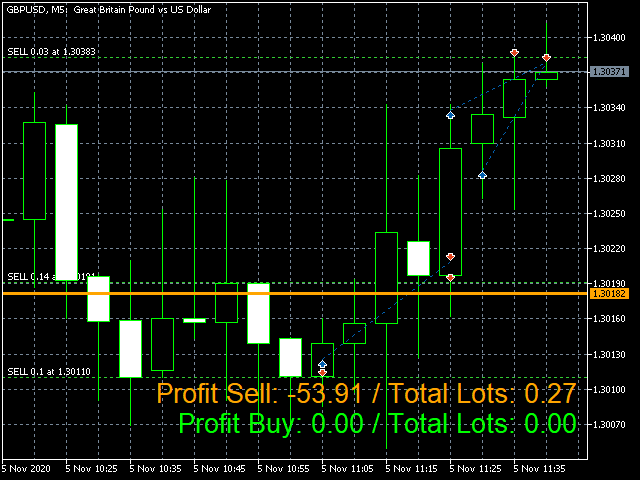
The Average Price indicator calculates the average prices of BUY (LONG) and SELL (SHORT) open positions, taking into account the size of open positions, commissions and swaps.
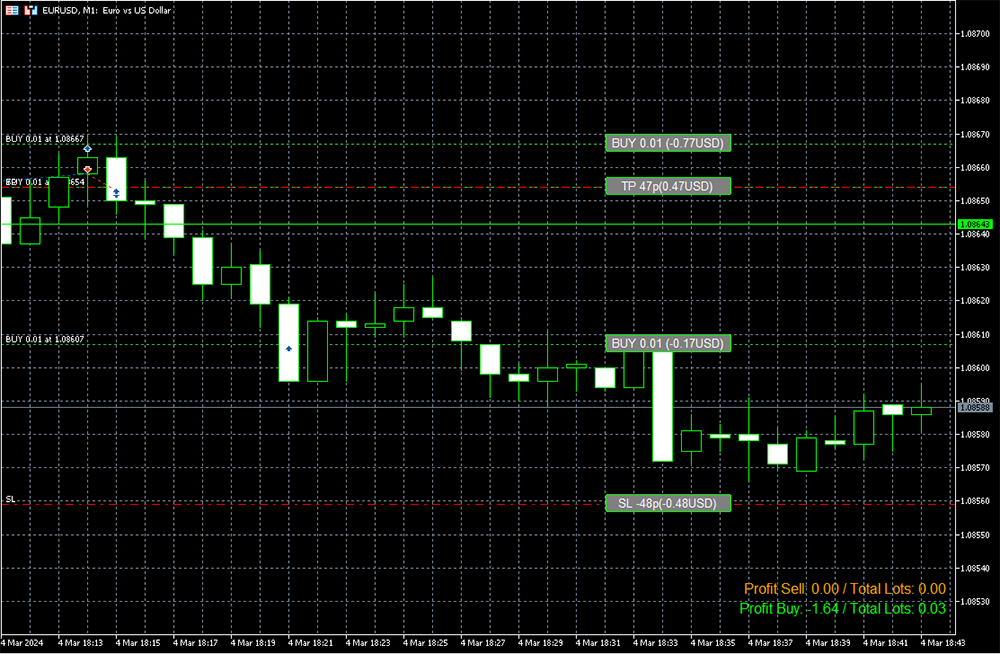
The indicator builds the average line of LONG open positions, after crossing which, from the bottom up, the total profit for all LONG positions for the current instrument becomes greater than 0.
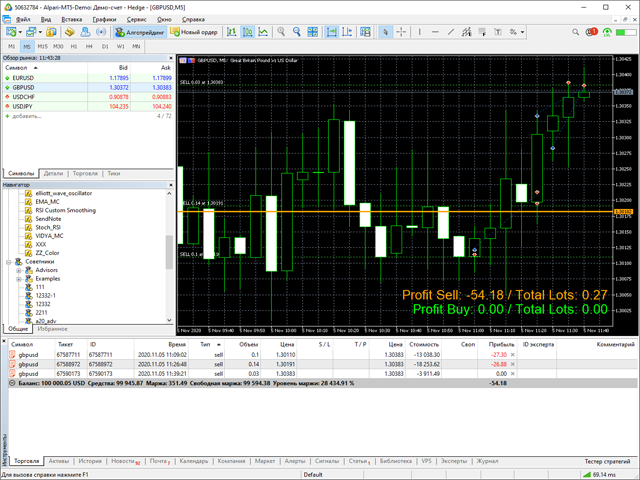
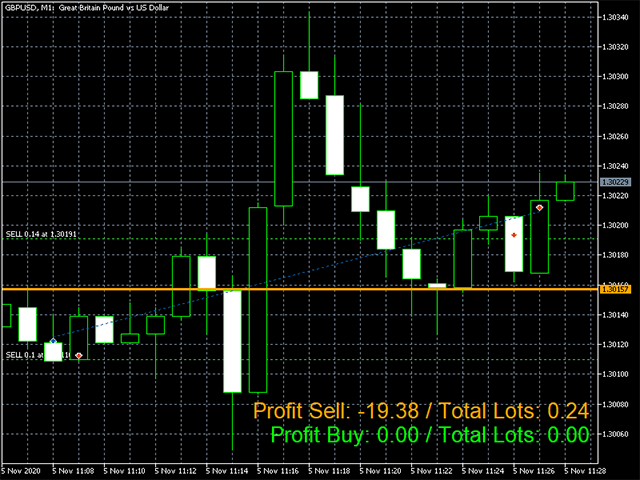
The indicator builds the average line of SHORT open positions, after crossing which, from top to bottom, the total profit for all SHORT positions on the current instrument becomes greater than 0.
In the lower right corner of the chart, the indicator shows the total result for BUY positions and for SELL positions, and the total volume of BUY positions and SELL positions.
The indicator is useful when trading using several open positions, with different volumes, when it is difficult to determine the break-even level of a group of positions, and the Take Profit setting level for a group of positions.
You can find version for Metatrader4 version here