ImportantLevels
- 지표
- Stanislav Korotky
- 버전: 1.1
- 업데이트됨: 19 11월 2021
- 활성화: 5
Indicator finds most prominent extremums (highs and lows) in history and displays their price levels for currently visible range of prices. 8 levels are shown at most.
This is a tool for those who used to lookup the history for important levels formed by reversal points outliers.
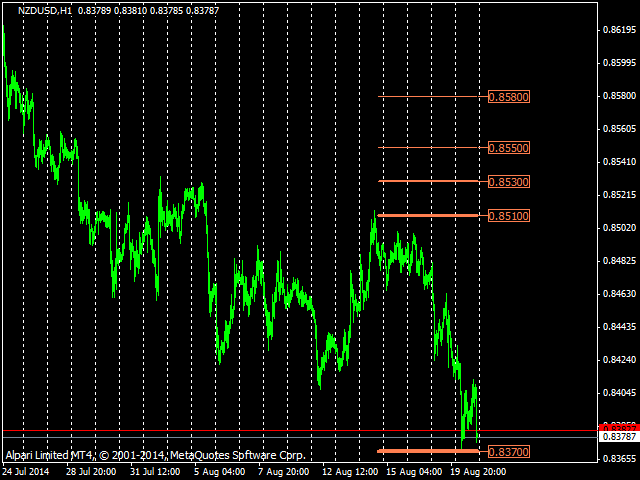
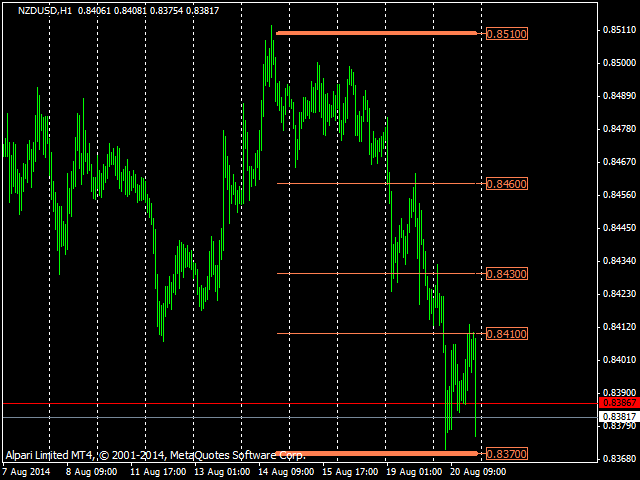
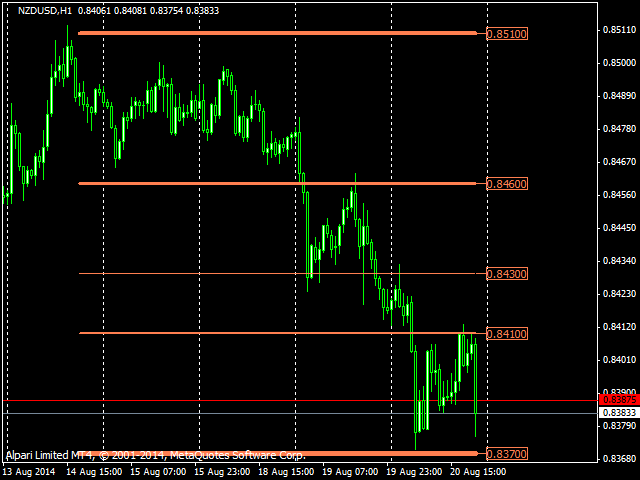
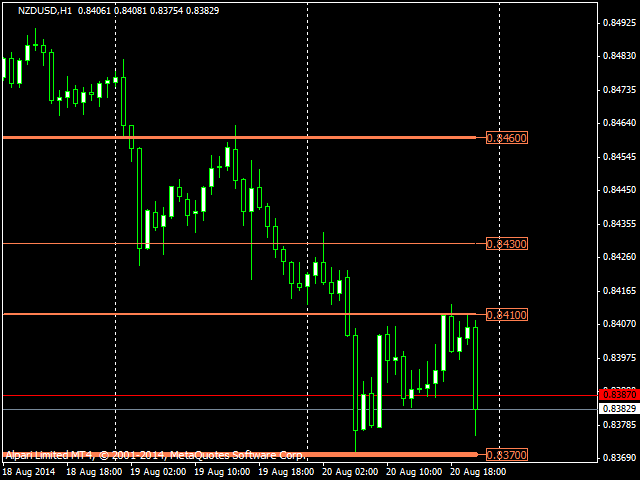
If price scale is changed manually or adjusted automatically for changes in time scale, indicator visualize all found levels (if any) inside visible area.
The width (importance) of a level depends from a number of times that new maximum or new minimum is detected in vicinity of the level (the vicinity is measured by Divider parameter in points) and from how long ago corresponding extremum observed (older ones produce lesser influence).
Parameters
- Offset - bar number, where history analysis begins; by default - 0, all known data up to the latest bar is processed, actual levels are discovered; setting larger values allows you to see levels in the past;
- Divider - step of price sampling (in points) for searching local agglomerations of extremum prices; by default - 100 (5 digits);
- Color - color of the levels; by default - gray;
- ShowOnBars - length of level lines in bars, starting from Offset; by default - 100; whet it's 0, lines output is disabled;
- ShowMarks - enable/disable price marks output for found levels; by default - false.
On the screenshots below the indicator is shown with enabled marks and other parameters with default values (except for the color) for different scales on the same chart.

