
안타깝게도 "Assistant 23 in 1 PRO"을(를) 사용할 수 없습니다
Makarii Gubaydullin의 다른 제품들을 확인할 수 있습니다.

다기능 도구: 로트 계산기, 가격 조치, R/R 비율, 무역 관리자, 공급 및 수요 영역을 포함한 65개 이상의 기능 데모 버전 | 사용자 매뉴얼 | MT5 버전 이 유틸리티는 전략 테스터에서 작동하지 않습니다. 여기에서 데모 버전을 다운로드하여 제품을 테스트할 수 있습니다.
Contact me 질문/개선 아이디어가 있는 경우/버그가 발견된 경우 저에게 연락 하십시오. 거래 프로세스를 간소화, 가속화 및 자동화하십시오. 이 대시보드로 표준 터미널 기능을 확장하십시오. 유틸리티는 외환, 주식, 지수, 암호화폐 등 모든 거래 수단에서 작동합니다. 1. 새로운 거래 열기 : 로트/리스크/RR 계산: 1. Lot 계산기 (리스크 규모에 따른 거래량 계산)
2. 리스크 계산기 (로트 규모에 따른 리스크 금액)
3. 위험/보상 비율(RR)
4. 주문에 대한 활성화 트리거 + StopLimit 구매 / StopLimit 판매
5. 가상 SL / TP 레벨

다기능 도구: 로트 계산기, 가격 조치, R/R 비율, 무역 관리자, 공급 및 수요 영역을 포함한 65개 이상의 기능 데모 버전 | 사용자 매뉴얼 | MT5 버전 이 유틸리티는 전략 테스터에서 작동하지 않습니다. 여기에서 데모 버전을 다운로드하여 제품을 테스트할 수 있습니다. Contact me 질문/개선 아이디어가 있는 경우/버그가 발견된 경우 저에게 연락 하십시오. 거래 프로세스를 간소화, 가속화 및 자동화하십시오. 이 대시보드로 표준 터미널 기능을 확장하십시오. 유틸리티는 외환, 주식, 지수, 암호화폐 등 모든 거래 수단에서 작동합니다. 1. 새로운 거래 열기 : 로트/리스크/RR 계산: 1. Lot 계산기 (리스크 규모에 따른 거래량 계산)
2. 리스크 계산기 (로트 규모에 따른 리스크 금액)
3. 위험/보상 비율(RR)
4. 주문에 대한 활성화 트리거 + StopLimit 구매 / StopLimit 판매
5. 가상 SL / TP 레벨 (숨겨진 SL
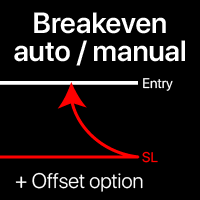
Breakeven levels: manual and automatic Using this utility , you can quickly move trades to breakeven in just 1 click : especially important in short -term trading. You can also set the automatic SL movement when the trade reaches a desired profit. Offset option is also available. My #1 Utility : 65+ features, including this tool | Contact me if you have any questions | MT4 version This tool consists of 2 subsections: 1. [Move SL to BE now]: manually move SL to a breakeven for the sp

Shows the direction of the bars on all major timeframes. My #1 Utility : 65+ features, including this indicator | Version for MT5
The meaning of the visual signals ( squares):
Red : Close price is lower than the Open price: Close < Open; Green : Close price is higher than the Open price: Close > Open; Blue : Close price is equal to the Open price: Close = Open; You can set the Shift of the calculated bar, relative to the current bar: Shift = 0: the direction of the currenttly
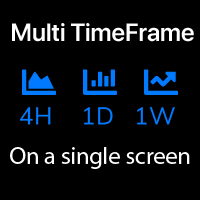
The indicator helps you analyze 3 different Time Intervals on a single screen to see the overall price action. My #1 Utility : includes 65+ functions | Contact me if you have any questions In the initial settings you can configure: TimeFrame 1; TimeFrame 2; TimeFrame 3; The number of bars to be shown; Colors of bullish and bearish bars; My other products:
Indicators: 14 in 1
초당 업데이트와 함께 현재 시장 정보를 표시합니다. 확산 크기; 스왑 크기:짧은 위치와 긴 위치의 경우; 현지 시간(선택 사항); 내#1 조수: 38+기능을 포함| 당신은 질문이있는 경우 저에게 연락 표시기의 설정에서 구성 할 수 있습니다: 글자크기; 텍스트 색상; 위치 선택:차트의 왼쪽/오른쪽 모서리; 현지 시간:온/오프; 프로그램 파일은"표시기"디렉토리에 배치해야합니다. .......................................................................................................................................
FREE

Visualization of the trade deals, distributed by price levels. You can set any period for calculation: between 2 vertical lines, or set a fixed time interval. The histogram levels are relative: a wider bar means more trading volume. Distribution extremes can be used as a support and resistance levels.
All styles, sizes and colors are customizable. My #1 Utility : includes 65+ functions | Contact me if you have any questions | MT4 version In the settings of the indicator, you can config

The indicator displays the levels that are extremes for the specified time frames. Resistance level is the maximum price of the last closed bar; Support level is the minimum price of the last closed bar; My #1 Utility : includes 65+ functions | Contact me if you have any questions 2 operating modes: Real bodies: Open and Close prices will be used; Extremes: High and Low prices will be used;
This indicator: Helps to see potential reversal levels; Patterns formed near the levels have mo

14 Indicators and auxiliary tools for convenient trading This utility contains 14 additional tools that can be useful for certain actions of the trader, thereby simplifying and speeding up the trading process. My #1 Utility : includes 65+ functions | Contact me if you have any questions Due to the different monitor resolutions, some users may encounter the fact that the labels will be displayed with an overlay or be too small. If you encounter such a problem, you can adjust the font size
초당 업데이트와 함께 현재 시장 정보를 표시합니다. 확산 크기; 스왑 크기:짧은 위치와 긴 위치의 경우; 현지 시간(선택 사항); 내#1 조수: 38+기능을 포함| 당신은 질문이있는 경우 저에게 연락 표시기의 설정에서 구성 할 수 있습니다: 글자크기; 텍스트 색상; 위치 선택:차트의 왼쪽/오른쪽 모서리; 현지 시간:온/오프; 프로그램 파일은"표시기"디렉토리에 배치해야합니다. .......................................................................................................................................
FREE
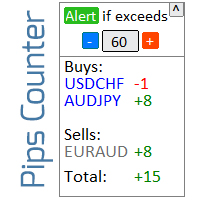
Informer for calculating the results of open trades. My #1 Utility : includes 65+ functions | Contact me if you have any questions The information panel groups open orders into 2 categories: Buys Sells For each category, the symbol and the current number of pips are displayed. The total result for all open trades is shown below. Notifications can be enabled or disabled by simply clicking on the button: When the notification is enabled, you will know when the profit on any symbol has excee

Countdown timer till the bar closure, + % Progress status: My #1 Utility : includes 65+ functions | Contact me if you have any questions In the settings of the indicator, you can configure: Timeframe for Calulculation; true / false: Higher TimeFrame option (next from the currently used: M15->M30, H4->D1...) Position:
1 = Bottom Left corner;
2 = Bottom Right corner;
3 = Top Left corner;
4 = Top Right corner; Font Size; Color; Font Style;
FREE

The indicator displays the specified Risk Level on the chart, for long and short positions. My #1 Utility : includes 65+ functions | Contact me if you have any questions It may be useful when setting the Stop Loss level, the value of which is visible on the right price axis. To calculate the level of risk, a Fixed / or Last used lot size is used. Imput Settings: Last traded lot: set " true " to make the calculation for your last used trading lot; Lot Size: set the value of t

Countdown timer till the bar closure, + % Progress status: My #1 Utility : includes 65+ functions | Contact me if you have any questions In the settings of the indicator, you can configure: Timeframe for Calulculation; true / false: Higher TimeFrame option (next from the currently used: M15->M30, H4->D1...) Position:
1 = Bottom Left corner;
2 = Bottom Right corner;
3 = Top Left corner;
4 = Top Right corner; Font Size; Color; Font Style;
FREE
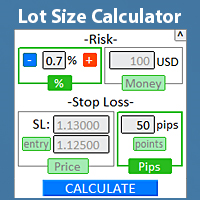
Quickly find the lot size directly in the terminal , to comply with risk management. My #1 Utility : includes 65+ functions | Contact me if you have any questions it works on any trading instruments: Forex, Stocks, Futures, Indices, CFD, Bonds, Cryptocurrencies; interface minimization function; flexibility of use; money management; It is especially useful for short-term traders, when they need to act quickly . For calculation it is necessary to specify 2 parameters:
The size of the ris

The indicator displays the most important Price Action Patterns that indicate a potential reversal / continuation of the trend. My #1 Utility : includes 65+ functions | Contact me if you have any questions Avaliable Patterns: Pin bar; Engulfing; Inside bar (Harami); Morning star; Evening star; Dark Cloud Cover; Piercing Line; Features: You can select patterns to display and disable unnecessary patterns; Notifications : alerts in the terminal, Email and Push-notifications (to the mobil

Automatically plots Fibo levels, based on the High & Low prices from the specified time frame Multiple bars may be united: e.g. you can get a Fibo based on the 10-days Highs and Lows My #1 Utility : 65+ features, including this indicator | Contact me for any questions | MT5 version Helps to see potential reversal levels; Patterns formed at the Fibo levels tend to be stronger; Significantly reduces the time spent on manual plotting ; Settings: Timeframe to calculate the base High & Low p
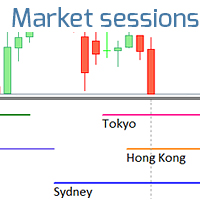
The indicator shows the operating time of the world exchanges. Help you to see which markets are currently most active. My #1 Utility : includes 65+ functions | Contact me if you have any questions Helps to select the most volatile instruments at the moment; Especially useful for an intraday traders;
1) When using on time frames 1H and below: the lines will correspond to the actual location of the bars on the chart, and when moving the chart, the lines of the trading sessions will move

Finds bars that exceed the specified size
My #1 Utility : includes 65+ functions | Contact me if you have any questions 2 operating modes: Real body: the difference between the open and close prices will be used; Extremes: the difference between the maximum and minimum prices will be used;
This Indicator: Convenient for filter patterns in a period of low volatility; Indicates the beginning of a trend ; Helps to see the most significant bars ; Can be used when trading
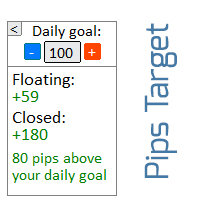
Informer for tracking daily trading results. My #1 Utility : includes 65+ functions | Contact me if you have any questions In the upper part of the panel, you set the daily profit target (in pips): Manually entering a value; Using the + and - buttons (the change step can be configured in the settings); The dashboard then groups trades into 2 categories: Current floating result; Summing up closed trades; The final result is displayed at the bottom: achievement or non-achievement of your da

Displays the appearance of a gap on the chart (when the closing price of the previous bar differs from the opening price of the new bar). My #1 Utility: includes 65+ functions | Contact me if you have any questions In the initial settings you can configure: The size of the gap (in points): only gaps that exceed this value will be displayed. Arrow color : separate for up and down gaps. When you hover the mouse over the gap arrows on the chart, their size will be displayed ; I recommend ch
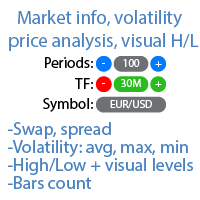
Market information and detailed statistics: analysis of volatility and price bars. My #1 Utility : includes 65+ functions | Contact me if you have any questions Specify any currency pair/trading instrument to get information: Market information:
Current spread; Swap for long positions (buys); Swap for short positions (sells);
Select a time frame and number of periods to analyze price changes: Average volatility; Maximum volatility; Minimum volatility; Maximum price; Minimum price; Numb

Monitor your favorite Symbols My #1 Utility: includes 65+ functions, including this tool | Contact me if you have any questions This tool opens in a separate window: it can be moved (drag anywhere), and minimized [v]. You can adjust the Watchlist on the panel: Click [edit list] to add / remove the Symbols from the Watchlist. Calculated value: it may either be the last [closed bar], or the current [floating bar]. Select the [timeframe] for calculation. There are 2 types of the value sorti
Detailed statistics of your trading for the selected period My #1 Utility : includes 65+ functions | Contact me if you have any questions Statistics display modes: For the selected currency pair/trading instrument Statistics for all trades (" ALL ")
You can select the period for which you want to get statistics: 1 day 1 week 1 month 2 months 3 months 6 months 1 year 2 years All trading history
Displayed information: Gross profit Gross loss Total profit/loss Number of trade
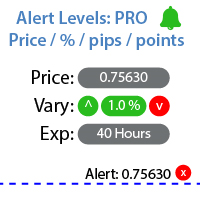
Utility for setting notifications when a given price level is reached. My #1 Utility : includes 65+ functions | Contact me if you have any questions The alert can be set in three ways: Manual entry of the price level; Setting the price change: in percent / in pips / in market points; By moving the level with the mouse: there is also a magnet function, when activated, the level will snap to the nearest OHLC values; Optionally, you can enable / disable each type of alert: Notifications in t
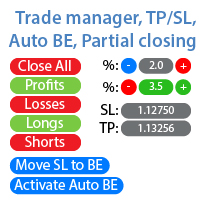
Management of active and pending orders: automatic breakeven, TP/SL changes, partial / full closing, visual display of levels on the chart My #1 Utility : includes 54+ functions | Contact me if you have any questions Ex4 file must be located in the "Experts" directory! Auto Trading must be activated !
1) Main window: to manage orders, you can set a specific symbol [Symbol], or select all symbols [ALL] Close all active positions [ALL] Close all profitable trades [profits] Close all loos
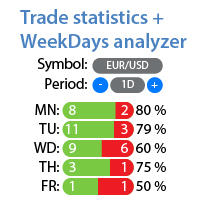
Detailed statistics of your trading for the selected period My #1 Utility : includes 65+ functions | Contact me if you have any questions The utility includes 2 separate tools: Trade Statistics WeekDays Analyzer Statistics display modes: For the selected currency pair/trading instrument Statistics for all trades (" ALL ") You can select the period for which you want to get statistics: 1 day 1 week 1 month 2 months 3 months 6 months 1 year 2 years All trading history 1. Trade Stat
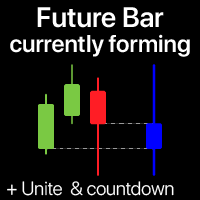
The indicator shows the currently forming candle of the selected time frame Multiple bars may be optionally united into a single candle: helps to see the bigger picture My #1 Utility : 65+ features, including this indicator | Contact me for any questions | MT5 version In the input settings, select the timeframe that will be used for the future bar: To the right of the current price, you will see a bar forming on the specified interval. If activated in the settings, the Countdown to the
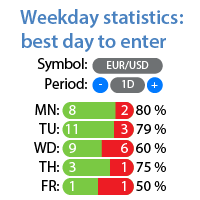
Profit/loss statistics for each day of the week on which the trade was opened My #1 Utility : includes 65+ functions | Contact me if you have any questions Statistics display modes: For the selected currency pair/trading instrument Statistics for all trades (" ALL ") You can select the period for which you want to get statistics: 1 day 1 week 1 month 2 months 3 months 6 months 1 year 2 years All trading history Displayed information: You will see statistics for each day of
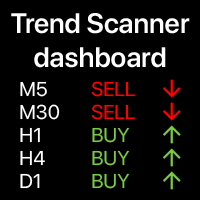
Trend dashboard: multi timeframe indicator, shows you the summary of the current trend This tool is based on the 3 major indicators: RSI, Stochastic and Commodity Channel Index. The alerts option will help you not to miss the beginning of the trend. My #1 Utility : includes 65+ features | Contact me if you have any questions | MT5 version A variety of options will allow you to customize the indicator according to your needs. Settings: Calculated bar: either the cu