WaveTheoryFully automatic calculation
- 지표
- Kaijun Wang
- 버전: 7.10
- 업데이트됨: 11 4월 2023
- 활성화: 5
이 지표는 실용적인 거래를위한 완벽한 웨이브 자동 분석 지표입니다! =》Increase the choice of international style mode, (red fall green rise style)
대역의 표준화된 정의는 더 이상 다른 사람들의 물결이 아니며 인공 간섭의 그림이 제거되어 접근 방식의 엄격한 분석에서 핵심 역할을 합니다.
⭐⭐⭐ 현재 구매 할인 중! ⭐⭐⭐
색인 내용:
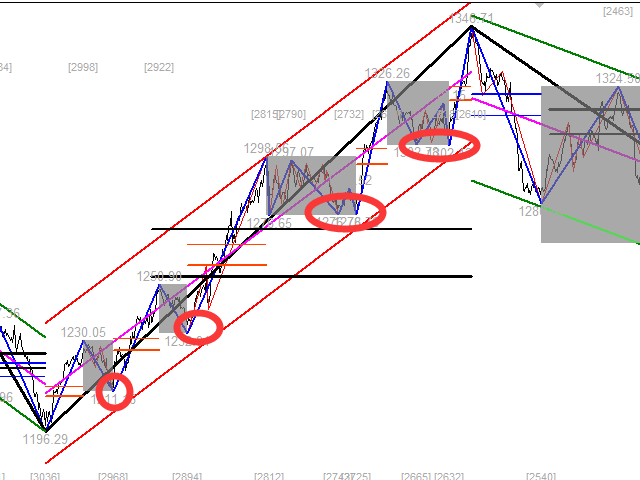
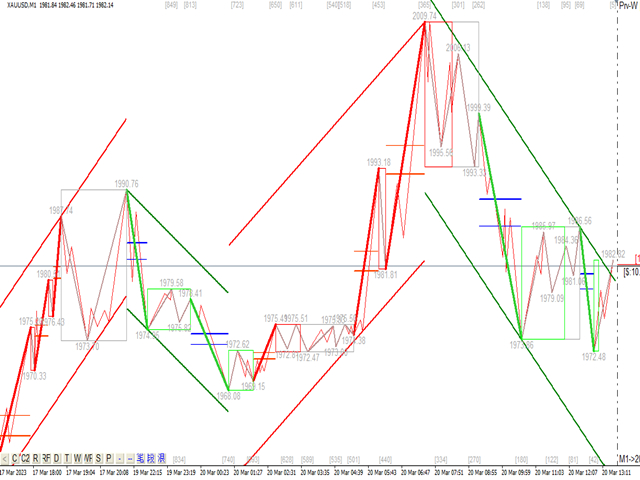
1. 기본파동: 첫째, 가격변동과정에서 기본변동의 변곡점을 찾았고, 물론 그의 주문이 너무 강하지 않아 다음 계산의 기초가 된다.
2. 2차 대역 : 기본파를 기반으로 알고리즘 분석을 통해 보다 명확한 2차 대역을 획득하고, 2차 대역은 파동 분석의 기반 제공
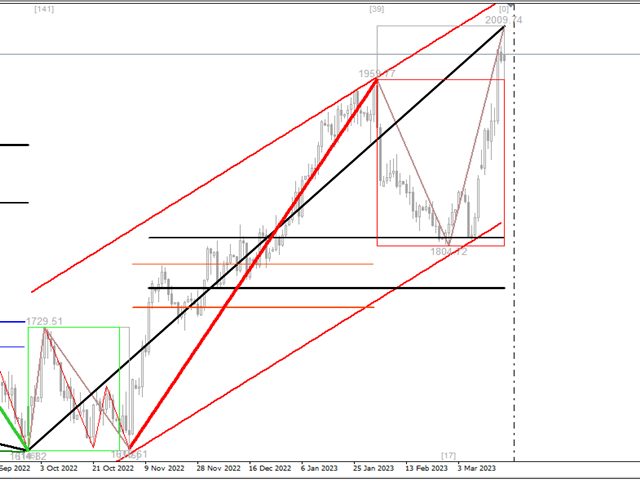
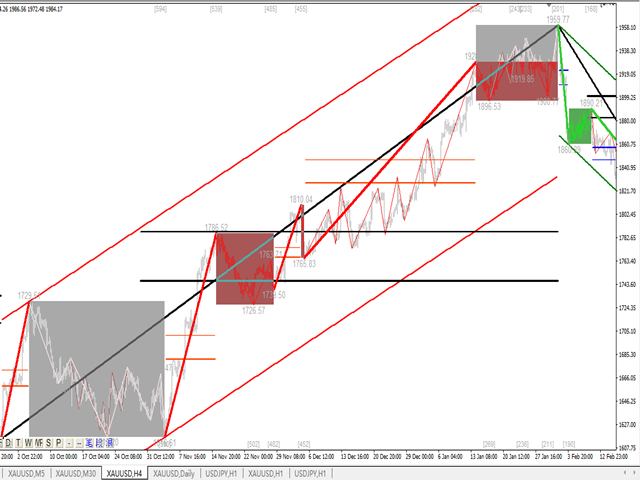
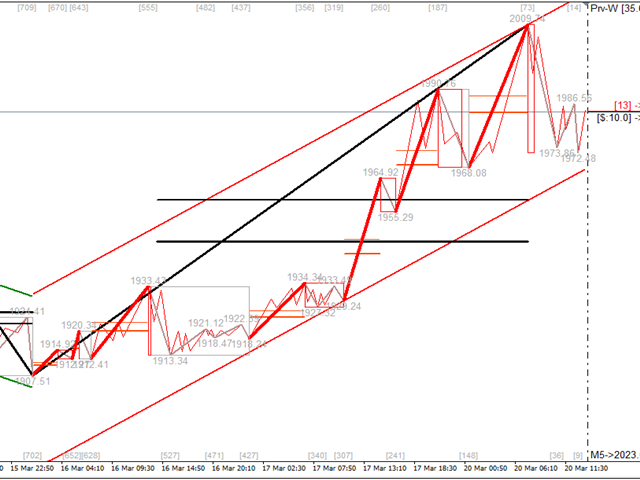
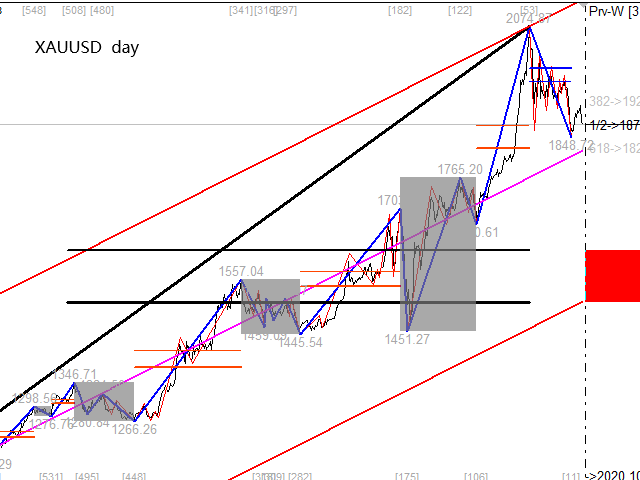
삼. Wave: 추세가 더 명확하고 직관적이고 방향성이 있습니다.파동의 지속 여부를 분석하기 위해서는 2차 파동 대역의 형태를 살펴보고, 2차 파동의 구성을 분석하여 차후의 예측을 얻을 수 있어야 합니다. 파도.
4. 채널: 채널 계산은 계산을 위해 선형 회귀 방법을 사용합니다.
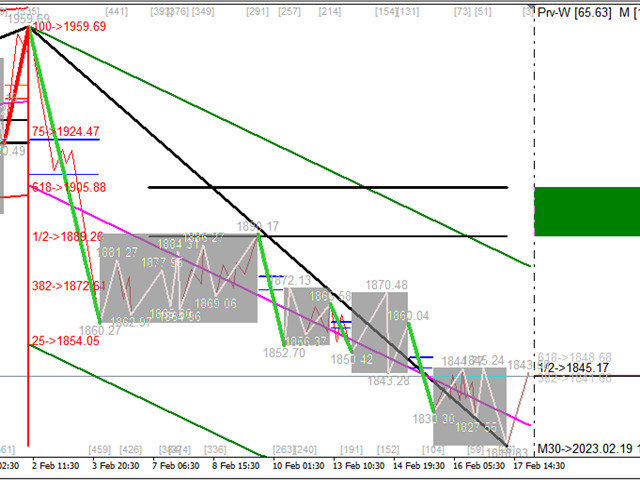
5. 되돌림: 웨이브의 두 가지 중요한 되돌림이 각 웨이브의 끝에 표시됩니다. 실제 전투에서 이러한 중요한 되돌림과 실제 되돌림의 상대적 강도가 추세의 모멘텀을 결정합니다.
6. 진동 간격: 진동 간격 은 표시기에 표시됩니다.
표시 전투:
1. 실제 전투 이론의 근원은 기본 파동 이론, 도교 이론입니다.
2. 실제 전투 이론은 실제 전투에서 더 많이 파생되며 그림을 천 번 읽으면 항상 얻을 수 있습니다.
3. 원래는 실제 경험을 좀 쓰고 싶었지만, 운영 계획이 다른 종류와 강점에서 약간 조정된 것을 발견했습니다. 거래는 지속적으로 작성되고 업데이트되고 있습니다. 거래는 잡아도 모래에 묻힌 선과 같습니다. 밧줄 하지만 모래는 계속해서 모양이 바뀝니다.
4. 파동이 수량화에 의해 정의되면 거래가 간단하고 효과적이 될 것이며 추세가 매우 명확해질 것이며 마음에 일반적인 추세가 있고 모든 것이 간단하고 효과적이 될 것입니다.
5. 왼쪽이든 오른쪽이든, 추세 거래이든 오실레이팅 거래이든, 이 지표 세트에는 답이 있습니다. 모두가 추세와 충격의 리듬, 수준, 모멘텀 및 시간을 느껴야 합니다. 매우 중요합니다.
6. 파동과 거래 파동을 이해하려면 다단계 및 다기간을 분석해야 합니다.
실제 전투 경험:
1.파동설과 도교설이 쓰여져 있지만 자연변동의 법칙과 완전히 일치하지 않고 실제 거래를 분석하는 과정에서 어려운 상황을 많이 발견하게 된다.
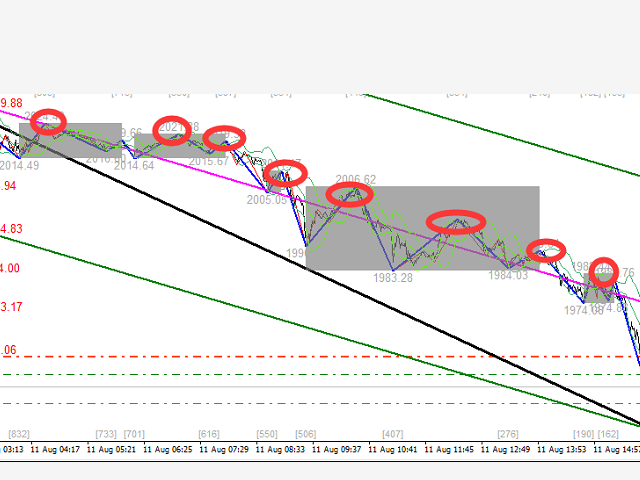
2. 아래에서 우리는 시장을 두 가지 유형, 즉 질서 있는 분석 가능한 시장과 무질서한 시장으로 나눌 수 있습니다.
3. 질서 있고 분석 가능한 시장에는 추세와 충격이 있습니다. 시장의 이 세그먼트, 즉 그래프 가능한 부분과 거래 가능한 부분은 우리가 분석할 수 있습니다. 이 부분이 주문되면 질서 있는 특성을 계속할 것이므로 우리는 충분한 이익을 얻을 수 있습니다
4. 무질서한 시장, 변동이 무질서하게 나타나며, 충격과 달리 무질서한 시장은 참가할 수 없습니다. 순서대로 돈을 줍고, 무질서를 피합니다.
운명의 사람들을 만나고, 거래의 기쁨을 함께 나누며, 함께 성장하기를 바랍니다!
금, 원유, 파운드 데이, 비트코인 및 기타 트렌드 품종에 더 적합합니다.
kjoin에 의해.


I like your indicator but I need to know more on the answer to my question, appreciate your answer to all my question in the comment page so that I can decide to buy your MT5 soon, Thank you.
*Author is very fast he immediately made all the improvement and updated to new version 6.8* the new version 6.8 latest is Amazing, we can diy to customise what information to display and hide on chart, it is 3-in-1 with Support/Resistant + Zig Zag + Trend Channel + all the useful information like Daily Range, Fibo Golden Ratio, it is the indispensable swiss knife multipurpose for trading! very powerful tool, worth every penny Best Buy for 2023! Big Thank you to Author for being so passionate and dedicated to his indicator, deserve more than 5 stars!