• 미리보기
  • 리뷰
  • 코멘트 (7)
  • 새 소식

FutureVisionByWPR

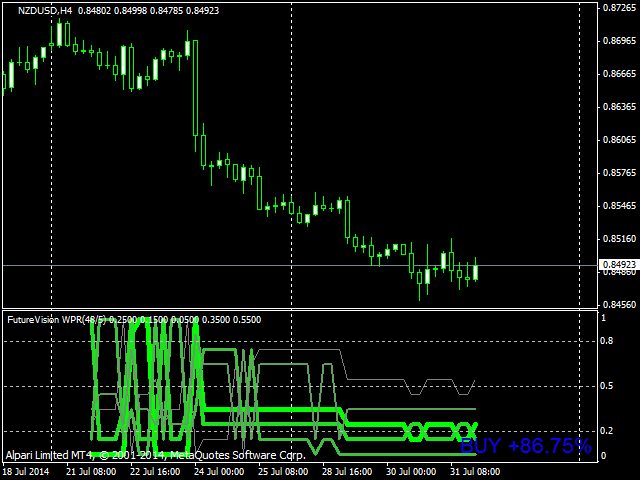
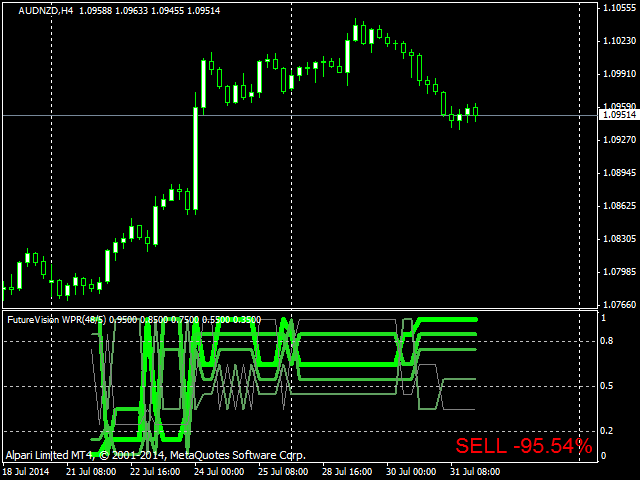
This is a future predictor based on so called backward WPR. The indicator calculates conditional probability of conversions between WPR and backward WPR values on available quotes history. Then it estimates future price movement using these probabilities and latest WPR readings.

The backward WPR is nothing special except that it's counted from right to left, i.e. from the future to the past. The main advantage of the backward WPR is that it knows the future and its values are always optimal for trading. The only thing we need to use it on practice - bind it with standard WPR, which is achieved by statistical analysis of the history.

When placed on a chart, the indicator displays backward WPR predictions for period latest bars. Actually it shows 5 most probable levels. Their meaning is standard: levels at the top indicate overbought state and suggest selling; while levels at the bottom indicate oversold state and suggest buying.

For your convenience the indicator shows a label with overall signal direction calculated from the predicted levels on the latest bar.


Parameters

  • period - base period for calculation of WPR; default - 24;
  • repeat - number of periods to process, including the base period; each next period is calculated as previous period multiplied by 2; default - 5, which means that periods 24, 48, 96, 192, 384 will be used; NB: when the number is too large, you may get no prediction at all, because probabilities for long periods can't be calculated; you should make sure that the largest period fits into available number of bars many times to gather decent statistics;
  • base - base color for lines; default - lime;
추천 제품
Noize Absorption Index MT4
Ekaterina Saltykova
5 (1)
Noize Absorption Index - is the manual trading system that measures the difference of pressure between bears forces and bulls forces. Green line - is a noize free index that showing curent situation. Zero value of index shows totally choppy/flat market.Values above zero level shows how powerfull bullish wave is and values below zero measures bearish forces.Up arrow appears on bearish market when it's ready to reverse, dn arrow appears on weak bullish market, as a result of reverse expectation. S
Старый, добрый "AP" в версии трендового осциллятора. Это простой индикатор, который использует максимум возможностей языка MQL4. Но при этом он работает достаточно быстро даже на процессорах 1 Гигагерц и менее. При анализе следует обращать внимание на пересечение уровня 50, если вы намеренны использовать его как трендовый индикатор. Индикатор не перерисовывает, и работает на всех типах графиков и таймфреймах. Сделаны основные возможности оповещения, оповещения работают в обоих направлениях
Scalping Snake Pro is a unique scalping indicator that shows the trader the price reversal moments and does not redraw. This indicator, unlike many others on the Internet, does not redraw its values. It draws signals on the very first bar, which allows you not to be late with opening deals. This indicator sends notifications to the trader by phone and email when a signal appears. You get all this functionality for only $147. How to trade with this indicator? Open the H1 timeframe. Currency pa
MTF Lines PRO for MT4
Renato Fiche Junior
5 (1)
This indicator was developed to support multiple timeframe analysis. In the indicator settings, the user can set the color, width, and style of the horizontal lines for each timeframe. This way, when the horizontal lines are inserted into the chart, they will be plotted with the timeframe settings. MTF Lines also allows visibility control of another objets like rectangles, trend lines and texts. This is a product developed by Renato Fiche Junior and available to all MetaTrader 4 and 5 users
Hugo
Andriy Sydoruk
The indicator algorithm with the highest accuracy generates input signals using the arrows. Strategy for trading in a flat, all the necessary functions built into one tool! The principle of the indicator is to automatically determine the current state of the market when it is placed on a chart, analyze historical data, based on historical data and display instructions to the trader for further actions. The system itself shows in the form of arrows when to buy and when to sell.
The SafeProfit Market Profile is the most advanced tracking indicator in the Forex Market. It was developed to track the market profile of each session of the day: Asian, European and American. With this indicator you will operate Intraday smiling ... knowing exactly where the Big Players are positioned and the exact moment where they are going to. The indicator is simple, fast and objective, tracking every movement of the Big Players in price. Get out of the 95% statistic that only loses and us
Introduction It is common practice for professional trades to hide their stop loss / take profit from their brokers. Either from keeping their strategy to the themselves or from the fear that their broker works against them. Using this indicator, the stop loss / take profit points will be drawn on the product chart using the bid price. So, you can see exactly when the price is hit and close it manually.  Usage Once attached to the chart, the indicator scans the open orders to attach lines fo
Trade with Gann on your side!! MASTER CIRCLE 360 CIRCLE CHART, originally created by Gann admitted that this is “The Mother of all charts”. It is one of the last studies that this great trader left for us. The numeric tab le is apparently quite simple like all the tables and is based on square numbers, the SQUARE OF 12 and is by evolution, one of the most important square numbers. Here we can find CYCLE, PRICE AND TIME thanks to angles and grades, to show past and future support and resistance.
Master scalping M1
Nataliia Marchuk
Master Scalping M1 is an innovative indicator that uses an algorithm to quickly and accurately determine the trend.The indicator calculates the time of opening and closing positions, the indicator's algorithms allow you to find the ideal moments to enter a deal (buy or sell an asset), which increase the success of transactions for most traders. Benefits of the indicator: Easy to assemble, does not overload the chart with unnecessary information. Can be used as a filter for any strategy. Works on
The Chaikin Oscillator is a technical indicator developed by Marc Chaikin that combines price and volume data to measure the accumulation and distribution of a financial instrument. It aims to identify potential buying and selling opportunities in the market. The Chaikin Oscillator is calculated by subtracting a 10-day exponential moving average of the Accumulation Distribution Line (ADL) from a 3-day exponential moving average of the ADL. Here's how to use the Chaikin Oscillator indicator in tr
Blahtech Market Profile
Blahtech Limited
4.61 (18)
Was: $249  Now: $99   Market Profile defines a number of day types that can help the trader to determine market behaviour. A key feature is the Value Area, representing the range of price action where 70% of trading took place. Understanding the Value Area can give traders valuable insight into market direction and establish the higher odds trade. It is an excellent addition to any system you may be using. Blahtech Limited presents their Market Profile indicator for the MetaTrader community. Ins
TWO PAIRS SQUARE HEDGE METER INDICATOR Try this brilliant 2 pairs square indicator It draws a square wave of the relation between your two inputs symbols when square wave indicates -1 then it is very great opportunity to SELL pair1 and BUY Pair2 when square wave indicates +1 then it is very great opportunity to BUY pair1 and SELL Pair2 the inputs are : 2 pairs of symbols         then index value : i use 20 for M30 charts ( you can try other values : 40/50 for M15 , : 30 for M30 , : 10 for H1 ,
캔들의 종가를 예측하는 지표입니다. 지표는 주로 D1 차트에서 사용하기 위한 것이. 이 지표는 전통적인 외환 거래와 바이너리 옵션 거래 모두에 적합합니다. 지표는 독립형 거래 시스템으로 사용하거나 기존 거래 시스템에 추가로 사용할 수 있습니다. 이 표시기는 현재 양초를 분석하여 양초 본체 내부의 특정 강도 요인과 이전 양초의 매개변수를 계산합니다. 따라서 지표는 시장 움직임의 추가 방향과 현재 양초의 종가를 예측합니다. 이 방법 덕분에 지표는 단기 및 중장기 거래 모두에 적합합니다. 지표를 사용하면 시장 상황을 분석하는 동안 지표가 생성할 잠재적 신호의 수를 설정할 수 있습니다. 표시기 설정에는 이를 위한 특별한 매개변수가 있습니다. 또한 인디케이터는 새로운 신호에 대해 차트의 메시지 형태, 이메일 및 PUSH 알림 형태로 알릴 수 있습니다. 구매 후 저에게 꼭 써주세요! 나는 당신에게 지표와 거래에 대한 나의 추천을 줄 것입니다! 또한 보너스를 받으세요!
Magic Balance
Daniil Evstratenko
The indicator shows which trading pairs, strategies, robots and signals that you use are profitable and which are not. The statistic of trades and balance graph are displayed in the account currency and pips - to switch simply click on the graph. button "$"(top left) - minimize/expand and move the indicator panel button ">"(bottom right) - stretching and resetting to the original size Statistic of trades 1 line - account balance, current profit and lot of open trades; 2 line - the number of al
BoxChart MT4
Evgeny Shevtsov
4.57 (7)
The market is unfair if only because 10% of participants manage 90% of funds. An ordinary trader has slim changes to stand against these "vultures". This problem can be solved. You just need to be among these 10%, learn to predict their intentions and move with them. Volume is the only preemptive factor that faultlessly works on any timeframe and symbol. First, the volume appears and is accumulated, and only then the price moves. The price moves from one volume to another. Areas of volume accumu
History Pattern Search
Yevhenii Levchenko
표시기는 현재 시세를 작성하여 과거 시세와 비교할 수 있으며 이를 바탕으로 가격 변동을 예측합니다. 표시기에는 원하는 날짜로 빠르게 이동할 수 있는 텍스트 필드가 있습니다. 옵션: 기호 - 표시기가 표시할 기호 선택. SymbolPeriod - 지표가 데이터를 가져올 기간 선택. IndicatorColor - 표시기 색상. HorisontalShift - 지시자가 그린 따옴표를 지정된 막대 수만큼 이동합니다. Inverse - true는 인용 부호를 반대로, false - 원래 보기를 반전합니다. ChartVerticalShiftStep - 차트를 수직으로 이동합니다(키보드의 위/아래 화살표). 다음은 날짜를 입력할 수 있는 텍스트 필드의 설정으로, '엔터'를 누르면 즉시 이동할 수 있습니다.
Indicator Candle Direction
Veridiana Adorno Kendrick
Simple indicator that supports decision makers. You will have the candles directions for different timeframes on your screen. That will allowed you to be one more scenario to analyze before you open your orders. In case you would like to have more details, just let me know.. so we can add it to the chart. Multicurrency that in inform you the directions for multi-timeframes!
VR Grid
Vladimir Pastushak
4.57 (7)
VR 그리드 표시기는 사용자 정의 설정으로 그래픽 그리드를 생성하도록 설계 되었습니다. 표준 그리드 와 달리 VR 그리드는 원형 레벨 을 구축하는 데 사용됩니다. 사용자의 선택에 따라 라운드 수준 사이의 단계는 임의적일 수 있습니다. 또한 VR Grid는 다른 인디케이터나 유틸리티와는 달리 기간이 바뀌거나 단말기를 재부팅해도 그리드의 위치 를 유지합니다. 설정, 세트 파일, 데모 버전, 지침, 문제 해결 등은 다음에서 얻을 수 있습니다. [블로그] 다음에서 리뷰를 읽거나 작성할 수 있습니다. [링크] 버전 [MetaTrader 5] 수직 수준 은 실제 시간 간격을 기준으로 하며 누락 또는 존재하지 않는 기간은 무시 합니다. 따라서 레벨 사이의 단계는 사용자가 선택한 값과 엄격하게 일치합니다. VR 그리드 표시기를 사용할 때 트레이더는 모든 수준에서 스타일 , 수직선 및 수평선의 색상 및 두께를 변경할 수 있습니다. 이를 통해 금융 상품의 라운드 수준 을 제어할 수 있습니다.
FREE
Reversal zones x2
Andrii Malakhov
The indicator looks for buying and selling zones, where a deal can be opened with a minimal stop loss and a better Risk Reward Ratio. The indicator is based on qualitative search of the Double top/Double bottom pattern. Indicator operation principle Looks for local tops/bottoms which can potentially become a Reversal zone It waits for an impulse movement that would exceed the Reversal zone and draws a red/blue wide rectangle Within the Reversal zone, it looks for the strongest area of the zone
Monster Harmonic Indicator
Paul Geirnaerdt
4.61 (31)
Monster Harmonics Indicator is a harmonic pattern indicator. It recognizes Gartley, Bat, Crab, Butterfly, Cypher, White Swan, Black Swan, Shark and several other patterns. Projected patterns that are not yet completed are recognized, too. Monster even shows the PRZ (Potential Reversal Zone). Users can add their own user defined patterns to Monster. Besides the current pattern, Monster also shows all patterns in the symbols history. Monster will provide alerts for developing patterns. Introduced
Fast rollback
Yaroslav Varankin
can recognize candlestick patterns he also recognizes the lows and highs of the price for a certain time. MTF works on all currency pairs in futures and sulfur, cryptocurrency does not redraw. his work can be seen in the test. you can trade at any time of the day but the preferred trading time during the European American session ----------------------------------------------------------------------------------------------------------------------------------------------------------
RTrends
Nikolay Likhovid
The RTrends indicator does two things: first, it automatically draws the layout of the price chart by plotting trend lines and, secondly, it produces bearish and bullish signals. The layout reflects the fractal nature of the market. Trends from different time horizons are applied simultaneously on the chart. Thus, from a single chart a trader can see trend lines of higher timeframes. The lines, depending on the horizon, differ in color and width: the older the horizon, the thicker the line is. T
Infinity Trend Pro
Yaroslav Varankin
1 (1)
This is a trend indicator without redrawing Developed instead of the binary options strategy (by the color of the Martingale candlestick) Also works well in forex trading When to open trades (binary options) A signal will appear in the place with a candle signaling the current candle It is recommended to open a deal for one candle of the current timeframe M1 and M5 When a blue dot appears, open a deal up When a red dot appears, open a trade down. How to open trades on Forex. When a signal is rec
SIRR Scalper for PipFinite is a robot that has been designed to work with the PipFinite Trend PRO Indicator. It is a dynamic EA that is very active with trades and capital management. The EA can trade the popular symbols EURUSD, GBPUSD, USDCHF, USDJPY, USDCAD, AUDUSD, EURGBP, EURCHF, EURJPY, AUDNZD, AUDCAD, EURNZD. Check our   Blogs   where we share news and set files When you buy my robot, you are welcome to drop me a message to discuss the best setup in combination with the set files 2 purcha
VR Cub
Vladimir Pastushak
VR Cub 은 고품질 진입점을 얻는 지표입니다. 이 지표는 수학적 계산을 용이하게 하고 포지션 진입점 검색을 단순화하기 위해 개발되었습니다. 지표가 작성된 거래 전략은 수년 동안 그 효율성을 입증해 왔습니다. 거래 전략의 단순성은 초보 거래자라도 성공적으로 거래할 수 있다는 큰 장점입니다. VR Cub은 포지션 개시 지점과 이익 실현 및 손절매 목표 수준을 계산하여 효율성과 사용 편의성을 크게 높입니다. 간단한 거래 규칙을 이해하려면 아래 전략을 사용한 거래 스크린샷을 살펴보세요. 설정, 세트 파일, 데모 버전, 지침, 문제 해결 등은 다음에서 얻을 수 있습니다. [블로그] 다음에서 리뷰를 읽거나 작성할 수 있습니다. [링크] 버전 [MetaTrader 5] 진입점 계산 규칙 포지션 개설 진입점을 계산하려면 VR Cub 도구를 마지막 최고점에서 마지막 최저점까지 늘려야 합니다. 첫 번째 지점이 두 번째 지점보다 빠른 경우, 거래자는 막대가 중간선 위에서 마감될 때까지 기다립
MT4용 외환 지표 "슈팅 스타 패턴" 지표 "슈팅 스타 패턴"은 가격 행동 거래에 대한 매우 강력한 지표입니다. 다시 칠하지 않고 지연도 없습니다. 지표가 차트에서 약세 슈팅 스타 패턴을 감지합니다. 차트의 빨간색 화살표 신호(그림 참조) PC, 모바일 및 이메일 알림이 포함되어 있습니다. 표시기 "슈팅 스타 패턴"은 지원/저항 수준과 결합하는 데 탁월합니다: https://www.mql5.com/en/market/product/100903 // 더 훌륭한 전문가 자문 및 지표는 여기에서 확인할 수 있습니다: https://www.mql5.com/en/users/def1380/seller // 또한 수익성 있고 안정적이며 신뢰할 수 있는 신호 https://www.mql5.com/en/signals/1887493에 참여하실 수 있습니다. 본 MQL5 홈페이지에서만 제공되는 오리지널 제품입니다.
Gold Phoenix
Yaroslav Varankin
The perfect tool for Scalng in the Forex markets You can trade both from signal to signal and using take profit  The algorithm does not use Zigzag!  No redrawing!  This is a channel instrument that uses a moving average as a filter. Moving Average  There are 2 parameters for the settings Ma Period = 5 period Moving Average  Channel 1.0 distance of channel lines from the chart Price Signal Filter - calculation of signal opening and filter There is a complete set of Alert There is a multi-timefram
This copier was originally developed for the professional order management of a team of traders and therefore, first of all, a risk manager was built into it. For simple operation, you need to configure the following settings: For the master! 1. Select the program type ''Program mode'' - master 2. Enter a new name for the ''Folder name'' folder, in which the EA will record information on working with orders. The name must be the same for both master and slave!!! 3. In the ''Feedback from
표시기는 가능한 최소 지연으로   다시 칠하지 않고   차트의 고조파 패턴을 보여줍니다. 지표 상단 검색은 가격 분석의 파동 원리를 기반으로 합니다. 고급 설정을 통해 거래 스타일에 대한 매개변수를 선택할 수 있습니다. 양초(막대)가 열릴 때 새로운 패턴이 형성되면 가격 변동의 가능성이 있는 방향의 화살표가 고정되어 변경되지 않습니다. 표시기는 ABCD, Gartley(Butterfly, Crab, Bat), 3Drives, 5-0, Batman, SHS, One2One, Camel, Triangles, WXY, Fibo, Vibrations와 같은 패턴과 그 종류를 인식합니다. 기본적으로 ABCD 및 Gartley 수치만 설정에 표시됩니다. 많은 추가 구성 가능한 매개변수. 주요 매개변수: ShowUpDnArrows - 가능한 방향 화살표 표시/숨기기 ArrowUpCode - 위쪽 화살표 코드 ArrowDnCode - 아래쪽 화살표 코드 Show old history pattern
What are Heiken Ashi Candles? Heiken Ashi, derived from the Japanese term 'Heikin Ashi,' translates to average price bars. It's an indicator depicting price bars on a chart. Formula for Heiken Ashi candles: - Heiken Ashi opening price: (previous candle's opening + closing price) / 2 - Closing price Heiken Ashi: (opening + high + low + closing) / 4 - Heiken Ashi peak: Max of high, opening, or closing price - Heiken Ashi bottom price: Min of low, opening, or closing price How to Read Heik
이 제품의 구매자들이 또한 구매함
TPSpro RFI Levels
Roman Podpora
4.84 (19)
Reversal First Impulse levels (RFI)    INSTRUCTIONS        RUS       -       ENG              R ecommended to use with an indicator   -   TREND PRO -  Version MT5 A key element in trading is zones or levels from which decisions to buy or sell a trading instrument are made. Despite attempts by major players to conceal their presence in the market, they inevitably leave traces. Our task was to learn how to identify these traces and interpret them correctly. Main functions: Displaying active zones
TPSproTREND PrO
Roman Podpora
4.78 (18)
TPSpro TRENDPRO  - is a trend indicator that automatically analyzes the market and provides information about the trend and each of its changes, as well as giving signals for entering trades without redrawing! The indicator uses each candle, analyzing them separately. referring to different impulses - up or down impulse. Exact entry points into transactions for currencies, crypto, metals, stocks, indices!  -  Version MT5               DETAILED DESCRIPTION                R ecommended to use with
Enigmera
Ivan Stefanov
5 (3)
에니메라: 시장의 핵심 https://www.enigmera.com 소개 이 지표 및 트레이딩 시스템은 금융 시장에 대한 놀라운 접근 방식입니다. 에니메라는 프랙탈 주기를 사용하여 지지선과 저항선을 정확하게 계산합니다. 진정한 축적 단계를 보여주고 방향과 목표를 제시합니다.  추세에 있든 조정에 있든 작동하는 시스템입니다.  어떻게 작동하나요? 에니메라는 지지선/저항선, 목표선, 편차선의 세 가지 라인으로 구성됩니다. 이 시스템은 과거 데이터를 현재와 미래로 추정하는 일반적인 시장 지표와 달리 현재에 대한 완전한 그림을 제공합니다. 지지선 위에 있으면 실제 지지를 의미하고 저항선 위에 있으면 실제 저항을 의미합니다. 레벨이 깨지면 추세의 변화를 나타냅니다. 다시 그리지 않습니다. 시장이 지속적으로 진화함에 따라 에니메라는 평가 도구를 조정하여 전략을 정기적으로 수정합니다.   이를 통해 모든 시나리오를 철저히 평가할 수 있습니다. 이 시장 지표의 고유성은 분명하며 그 기
Trend Punch
Mohamed Hassan
5 (13)
Manual guide:   Click here PROMO of  $79!  -- Next price is  $149 .  This indicator is unstoppable when combined with our other indicator called  Support & Resistance . After purchase, send us a message and you will get it   for  FREE as a BONUS! I like to use Trend Punch on XAUUSD & BTCUSD on the M1 timeframe!  Introducing Trend Punch , the revolutionary forex trend indicator that will transform the way you trade! Trend Punch is uniquely designed to provide precise buy and sell ar
Scalper Inside PRO
Alexey Minkov
4.74 (58)
An exclusive indicator that utilizes an innovative algorithm to swiftly and accurately determine the market trend. The indicator automatically calculates opening, closing, and profit levels, providing detailed trading statistics. With these features, you can choose the most appropriate trading instrument for the current market conditions. Additionally, you can easily integrate your own arrow indicators into Scalper Inside Pro to quickly evaluate their statistics and profitability. Scalper Inside
FX Volume
Daniel Stein
4.6 (35)
모닝 브리핑을 통해 세부 정보와 스크린샷으로 매일 시장 업데이트를 받으세요 여기 mql5 및 텔레그램에서 FX 거래량은 브로커의 관점에서 시장 심리에 대한 실제 통찰력을 제공하는 최초이자 유일한 거래량 지표입니다. 브로커와 같은 기관 시장 참여자가 외환 시장에서 어떤 포지션을 취하고 있는지에 대한 훌륭한 통찰력을 COT 보고서보다 훨씬 빠르게 제공합니다. 차트에서 이 정보를 직접 확인하는 것은 트레이딩의 진정한 판도를 바꾸고 획기적인 솔루션입니다. 다음과 같은 고유한 시장 데이터 인사이트의 이점 비율 는 통화의 매수/매도 포지션 비율을 백분율로 표시 비율 변화 는 선택한 기간 내 매수 비율과 비율 변화를 표시 총 거래량 는 해당 통화의 총 거래량(롱 및 숏)을 로트 단위로 보여줍니다 Volumes Long 는 해당 통화의 모든 롱 포지션의 거래량을 보여줍니다 Volumes Short 는 해당 통화의 모든 숏 포지션의 거래량을 보여줍니다 Net Long 는 순 롱 포지션의 거래량
Advanced Supply Demand
Bernhard Schweigert
4.92 (313)
현재 33% 할인! 초보자나 전문 트레이더를 위한 최고의 솔루션! 이 보조지표는 우리가 다수의 독창적 기능과 새로운 공식을 통합한 독특하고 고품질이며 저렴한 거래 도구입니다. 이 업데이트를 통해 이중 시간대를 표시할 수 있습니다. 더 높은 TF를 표시할 수 있을 뿐만 아니라 차트 TF와 더 높은 TF 모두를 표시할 수 있습니다: 중첩 영역 표시. 모든 Supply Demand 트레이더들이 좋아할 것입니다. :) 중요한 정보 공개 Advanced Supply Demand의 잠재력을 극대화하려면 다음을 방문하십시오. https://www.mql5.com/ko/blogs/post/720245   진입 또는 목표의 명확한 트리거 포인트를 정확히 찾아냄으로 해서 거래가 어떻게 개선될지 상상해 보십시오. 새로운 알고리즘을 기반으로 매수자와 매도자 간의 잠재적인 불균형을 훨씬 더 쉽게 분간할 수 있습니다. 왜냐하면 가장 강한 공급영역과 가장 강한 수요 영역과 과거에 어떻게 진행 되었는지를(이
TrendMaestro
Stefano Frisetti
5 (3)
note: this indicator is for METATRADER4, if you want the version for METATRADER5 this is the link:  https://www.mql5.com/it/market/product/108106 TRENDMAESTRO ver 2.4 TRENDMAESTRO recognizes a new TREND in the bud, he never makes mistakes. The certainty of identifying a new TREND is priceless. DESCRIPTION TRENDMAESTRO identifies a new TREND in the bud, this indicator examines the volatility, volumes and momentum to identify the moment in which there is an explosion of one or more of these data a
Gold Stuff
Vasiliy Strukov
4.89 (260)
Gold Stuff는 금을 위해 특별히 설계된 추세 지표이며 모든 금융 상품에서도 사용할 수 있습니다. 표시기가 다시 그려지지 않고 지연되지 않습니다. 권장 기간 H1. 표시기에서 완전 자동 Expert Advisor EA Gold Stuff를 작동합니다. 내 프로필에서 찾을 수 있습니다. 설정 및 개인 보너스를 받으려면 구매 후 즉시 저에게 연락하십시오!   강력한 지원 및 트렌드 스캐너 표시기의 무료 사본을 받으실 수 있습니다. 메시지를 보내주세요. 나!   설정 화살표 그리기 - 켜기 끄기. 차트에 화살표 그리기. 경고 - 가청 경고를 끕니다. 이메일 알림 - 켜기 끄기. 이메일 알림. Puch-notification - 켜기 끄기. 푸시 알림. 다음으로 색 영역을 조정합니다. Gold Stuff는 금을 위해 특별히 설계된 추세 지표이며 모든 금융 상품에서도 사용할 수 있습니다. 표시기가 다시 그려지지 않고 지연되지 않습니다. 권장 기간 H1. 표시기에서 완
Atomic Analyst
Issam Kassas
5 (3)
우선적으로 언급할 점은이 거래 지표가 다시 그리지 않고 지연되지 않으며 이를 통해 수동 및 로봇 거래 모두에 이상적이라는 점입니다. 사용자 매뉴얼: 설정, 입력 및 전략. Atomic Analyst는 가격의 강도와 모멘텀을 활용하여 시장에서 더 나은 이점을 찾는 PA Price Action Indicator입니다. 고급 필터를 장착하여 잡음과 거짓 신호를 제거하고 거래 잠재력을 높이는 데 도움이 됩니다. 복잡한 지표의 다중 레이어를 사용하여 Atomic Analyst는 차트를 스캔하고 복잡한 수학적 계산을 간단한 신호와 색상으로 변환하여 초보 트레이더가 이해하고 일관된 거래 결정을 내릴 수 있도록합니다. "Atomic Analyst"는 새로운 및 경험이 풍부한 트레이더를위한 종합적인 거래 솔루션입니다. 프리미엄 지표와 최고 수준의 기능을 하나의 거래 전략에 결합하여 모든 종류의 트레이더에 대한 다재다능한 선택지가되었습니다. 인트라데이 거래 및 스캘핑 전략 : 빠르고 정확한
Advanced Currency Strength28 Indicator
Bernhard Schweigert
4.91 (665)
현재 26% 할인 초보자 또는 전문가 트레이더를 위한 최고의 솔루션! 이 지표는 우리가 독점 기능과 새로운 공식을 통합했기 때문에 독특하고 고품질이며 저렴한 거래 도구입니다. 단 하나의 차트로 28 Forex 쌍의 통화 강도를 읽을 수 있습니다! 새로운 추세 또는 스캘핑 기회의 정확한 트리거 포인트를 정확히 찾아낼 수 있기 때문에 거래가 어떻게 개선될지 상상해 보십시오. 사용 설명서: 여기를 클릭  https://www.mql5.com/en/blogs/post/697384 그것이 첫 번째, 원본입니다! 쓸모없는 지망생 클론을 사지 마십시오. 더 스페셜  강력한 통화 모멘텀을 보여주는 하위 창의 화살표 GAP가 거래를 안내합니다! 기본 또는 호가 통화가 과매도/과매도 영역(외부 시장 피보나치 수준)에 있을 때 개별 차트의 기본 창에 경고 표시가 나타납니다. 통화 강도가 외부 범위에서 떨어질 때 풀백/반전 경고. 교차 패턴의 특별 경고 추세를 빠르게 볼 수 있는
GOLD Impulse with Alert
Bernhard Schweigert
4.56 (9)
이 지표는 Advanced Currency IMPULSE with ALERT  +   Currency Strength Exotics  의 2가지 제품의 슈퍼 조합입니다. 그것은 모든 시간 프레임에 대해 작동하며 8개의 주요 통화와 하나의 기호에 대한 강약의 충동을 그래픽으로 보여줍니다! 이 표시기는 금, 이국적인 쌍, 상품, 지수 또는 선물과 같은 기호에 대한 통화 강도 가속을 표시하는 데 특화되어 있습니다. 금, 은, 오일, DAX, US30, MXN, TRY, CNH 등의 진정한 통화 강도 가속(충동 또는 속도)을 표시하기 위해 9번째 줄에 모든 기호를 추가할 수 있습니다. 새로운 기본 알고리즘을 기반으로 구축되어 잠재적인 거래를 훨씬 더 쉽게 식별하고 확인할 수 있습니다. 이는 통화의 강세 또는 약세가 가속되는지 여부를 그래픽으로 표시하고 가속 속도를 측정하기 때문입니다. 자동차의 속도계처럼 생각하면 됩니다. 가속화할 때 Forex 시장에서 동일한 일이 분명히
Quantum Trend Sniper Indicator MT4
Bogdan Ion Puscasu
4.6 (40)
소개       Quantum Trend Sniper Indicator는   추세 반전을 식별하고 거래하는 방식을 변화시키는 획기적인 MQL5 지표입니다! 13년 이상의 거래 경험을 가진 숙련된 트레이더 팀이 개발한       Quantum Trend Sniper 표시기       매우 높은 정확도로 추세 반전을 식별하는 혁신적인 방법으로 거래 여정을 새로운 차원으로 끌어올리도록 설계되었습니다. ***Quantum Trend Sniper Indicator를 구입하면 Quantum Breakout Indicator를 무료로 받을 수 있습니다!*** Quantum Trend Sniper Indicator는 추세 반전을 식별하고 세 가지 이익실현 수준을 제안할 때 경고, 신호 화살표를 제공합니다. 초보자 거래자와 전문 거래자 모두에게 적합합니다. Quantum EA 채널:       여기를 클릭하세요 MT5 버전:       여기를 클릭하세요
ON Trade Optuma Astro
Abdullah Alrai
5 (4)
물론입니다. 아래는 제공해주신 텍스트의 한국어 번역입니다: MT4용 천문학 지표 소개: 귀하의 최상급 하늘 트레이딩 동반자 트레이딩 경험을 천체의 높이로 끌어올리기 준비가 되셨나요? MT4용 천문학 지표를 소개합니다. 이 혁신적인 도구는 복잡한 알고리즘의 힘을 활용하여 탁월한 천문학적 통찰과 정밀한 계산을 제공합니다. 정보의 우주를 손에 담다: 천문학적 데이터의 보물함을 드러내는 포괄적인 패널을 살펴보세요. 행성의 지오/헬리오센트릭 좌표, 태양/지구 거리, 크기, 길이, 별자리, 황도 좌표 및 적도 좌표, 심지어 수평 좌표 등 각각이 정밀하게 계산되고 아름답게 제시됩니다. 지표에 의해 생성된 수직선은 시간 값에 해당하여 트레이딩 여정에 우주적인 시각을 부여합니다. 행성 라인과 관계: 수정 가능한 스케일과 각도로 차트를 장식하는 행성 라인의 마법을 경험해보세요. 직관적인 컨트롤 패널을 통해 각 행성의 라인의 가시성을 손쉽게 전환할 수 있습니다. 쥰션이나 섹스타일, 사분각, 삼분각, 트
Advanced Currency IMPULSE with ALERT
Bernhard Schweigert
4.91 (495)
현재 31% 할인!! 초보자 또는 전문가 트레이더를 위한 최고의 솔루션! 이 지표는 우리가 독점 기능과 비밀 공식을 통합했기 때문에 독특하고 고품질이며 저렴한 거래 도구입니다. 단 하나의 차트로 28개 통화 쌍 모두에 대한 경고를 제공합니다. 새로운 추세 또는 스캘핑 기회의 정확한 트리거 포인트를 정확히 찾아낼 수 있기 때문에 거래가 어떻게 개선될지 상상해 보십시오! 새로운 기본 알고리즘을 기반으로 구축되어 잠재적인 거래를 훨씬 더 쉽게 식별하고 확인할 수 있습니다. 이는 통화의 강세 또는 약세가 가속되는지 여부를 그래픽으로 표시하고 가속 속도를 측정하기 때문입니다. 자동차의 속도계처럼 생각하면 됩니다. 가속화할 때 Forex 시장에서 동일한 일이 분명히 더 빠르게 발생합니다. 즉, 반대 방향으로 가속화되는 통화를 페어링하면 잠재적으로 수익성 있는 거래를 식별한 것입니다. 통화 모멘텀의 수직선과 화살표가 거래를 안내합니다! 역동적인 Market Fibonacci 23
FX Power MT4 NG
Daniel Stein
5 (11)
모닝 브리핑 여기 mql5 와 텔레그램에서 FX Power MT4 NG 는 오랫동안 인기 있는 통화 강도 측정기인 FX Power의 차세대 버전입니다. 이 차세대 강도 측정기는 무엇을 제공합니까? 기존 FX Power에서 좋아했던 모든 것 PLUS GOLD/XAU 강도 분석 더욱 정밀한 계산 결과 개별 구성 가능한 분석 기간 더 나은 성능을 위한 사용자 정의 가능한 계산 한도 특별 멀티더 많은 것을보고 싶은 사람들을위한 특별한 다중 인스턴스 설정 모든 차트에서 좋아하는 색상을위한 끝없는 그래픽 설정 수많은 알림 옵션, 중요한 것을 다시는 놓치지 않도록 Windows 11 및 macOS 스타일의 둥근 모서리가 있는 새로운 디자인 마법처럼 움직이는 인디케이터 패널 FX 파워 키 특징 모든 주요 통화의 완전한 강세 이력 모든 시간대에 걸친 통화 강세 이력 모든 브로커 및 차트에서 고유 계산 결과 100% 신뢰할 수있는 실시간100 % 신뢰할 수있는 실시간 계산-> 다시 칠하지 않음
Trend Screener
STE S.S.COMPANY
4.83 (88)
트렌드 표시기, 트렌드 트레이딩 및 필터링을 위한 획기적인 고유 솔루션, 하나의 도구 안에 내장된 모든 중요한 트렌드 기능! Forex, 상품, 암호 화폐, 지수 및 주식과 같은 모든 기호/도구에 사용할 수 있는 100% 다시 칠하지 않는 다중 시간 프레임 및 다중 통화 표시기입니다. Trend Screener는 차트에 점이 있는 화살표 추세 신호를 제공하는 효율적인 지표 추세 추종 지표입니다. 추세 분석기 표시기에서 사용할 수 있는 기능: 1. 트렌드 스캐너. 2. 최대 이익 분석이 있는 추세선. 3. 추세 통화 강도 측정기. 4. 경고가 있는 추세 반전 점. 5. 경고가 있는 강력한 추세 점. 6. 추세 화살표 Trend Screener Indicator가 있는 일일 분석 예, 일일 신호 성능...등은 여기에서 찾을 수 있습니다.   여기를 클릭하십시오. LIMITED TIME OFFER : Trend Screener Indicator는 50 $ 및 평생 동안만 사용할 수 있
The indicator " ZigZag on Trend " is an assistant in determining the direction of price movement, as well as a calculator of bars and points. It consists of a trend indicator, which follows the price direction by the trend line presented in the form of a zigzag and a counter calculating the number of bars traversed in the direction of the trend and the number of points on the vertical scale. (calculations are carried out by the opening of the bar) The indicator does not redraw. For convenience,
현재 20% 할인 ! 초보자 또는 전문가 트레이더를 위한 최고의 솔루션! 이 대시보드 소프트웨어는 28개의 통화 쌍에서 작동합니다. 2가지 주요 지표(Advanced Currency Strength 28 및 Advanced Currency Impulse)를 기반으로 합니다. 전체 Forex 시장에 대한 훌륭한 개요를 제공합니다. 고급 통화 강도 값, 통화 이동 속도 및 모든(9) 시간대의 28 Forex 쌍에 대한 신호를 보여줍니다. 추세 및/또는 스캘핑 기회를 정확히 파악하기 위해 차트의 단일 지표를 사용하여 전체 시장을 볼 수 있을 때 거래가 어떻게 개선될지 상상해 보십시오! 잠재적인 거래를 식별하고 확인하면서 강력한 통화와 약한 통화를 더욱 쉽게 식별할 수 있도록 이 지표에 기능을 내장했습니다. 이 표시기는 통화의 강세 또는 약세가 증가 또는 감소하는지 여부와 모든 시간대에서 수행되는 방식을 그래픽으로 보여줍니다. 추가된 새로운 기능은 현재 시장 조건 변화에 적
TakePropips Donchian Trend Pro
Eric John Pajarillaga Aldana
4.82 (17)
TakePropips Donchian Trend Pro   (MT4)는 Donchian 채널을 사용하여 추세의 방향을 자동으로 감지하고 진입 및 퇴장 거래 신호를 제공하는 강력하고 효과적인 도구입니다! 이 다기능 지표에는 추세 스캐너, 거래 신호, 통계 패널, 스크리너, 거래 세션 및 경고 내역 대시보드가 포함됩니다. 거래 신호를 제공하고 차트 분석 시간을 절약하도록 설계되었습니다! 다음 블로그 게시물에서 사용자 설명서 및 설치 가이드를 다운로드할 수 있습니다.   https://www.mql5.com/en/blogs/post/751368 오늘 50% 할인을 받으세요! 가격이 $98에서 $49로 인하되었습니다! 전략 테스터에서 이 지표를 테스트할 수 있습니다(비주얼 모드 활성화).  자세한 내용은 설명 아래에 비디오 자습서도 제공됩니다. 질문이 있거나 도움이 필요하면 저에게 연락하십시오. TakePropips Donchian Trend Pro 지표는 모든 Forex 쌍, 금속
Quantum Breakout Indicator PRO
Bogdan Ion Puscasu
4.96 (26)
소개       Quantum Breakout PRO   , 브레이크아웃 존 거래 방식을 변화시키는 획기적인 MQL5 지표! 13년 이상의 거래 경험을 가진 숙련된 트레이더 팀이 개발한   Quantum Breakout PRO는   혁신적이고 역동적인 브레이크아웃 영역 전략으로 거래 여정을 새로운 차원으로 끌어올리도록 설계되었습니다. Quantum Breakout Indicator는 5개의 이익 목표 영역이 있는 브레이크아웃 영역의 신호 화살표와 브레이크아웃 상자를 기반으로 한 손절 제안을 제공합니다. 초보자 거래자와 전문 거래자 모두에게 적합합니다. Quantum EA 채널:       여기를 클릭하세요 MT5 버전 :   여기를 클릭하세요 중요한! 구매 후 설치 매뉴얼을 받으려면 개인 메시지를 보내주십시오. 추천: 기간: M15 통화쌍: GBPJPY, EURJPY, USDJPY,NZDUSD, XAUUSD 계정 유형: 스프레드가 매우 낮은 ECN, Ra
How to use Pair Trading Station Pair Trading Station is recommended for H1 time frame and you can use it for any currency pairs. To generate buy and sell signal, follow few steps below to apply Pair Trading Station to your MetaTrader terminal. When you load Pair Trading Station on your chart, Pair Trading station will assess available historical data in your MetaTrader platforms for each currency pair. On your chart, the amount of historical data available will be displayed for each currency pai
XQ Indicator MetaTrader 4
Marzena Maria Szmit
3.67 (3)
Step into the realm of Forex trading with confidence and precision using XQ, a cutting-edge Forex indicator designed to elevate your trading game to unprecedented heights. Whether you're a seasoned trader or just stepping into the world of currency exchange,   XQ Forex Indicator   empowers you with the insights and signals needed to make informed trading decisions. The signal conditions are a combination of three indicators, and XQ Forex Indicator only display  medium and long-term trends . The
Currency Strength Exotics
Bernhard Schweigert
4.88 (33)
현재 20% 할인! 초보자 또는 전문가 트레이더를 위한 최고의 솔루션! 이 표시기는 Exotic Pairs Commodities, Indexes 또는 Futures와 같은 기호에 대한 통화 강도를 표시하는 데 특화되어 있습니다. 금, 은, 석유, DAX, US30, MXN, TRY, CNH 등의 진정한 통화 강도를 보여주기 위해 9번째 줄에 모든 기호를 추가할 수 있습니다. 이것은 독특하고 고품질이며 저렴한 거래 도구입니다. 우리는 많은 독점 기능과 새로운 공식을 통합했습니다. 새로운 추세 또는 스캘핑 기회의 정확한 트리거 포인트를 정확히 찾아낼 수 있기 때문에 거래가 어떻게 개선될지 상상해 보십시오. 사용 설명서: 여기를 클릭 https://www.mql5.com/en/blogs/post/708876 모든 시간대에 작동합니다. TREND를 빠르게 확인할 수 있습니다! 새로운 기본 알고리즘을 기반으로 설계되어 잠재적인 거래를 더욱 쉽게 식별하고 확인할 수 있습니다.
Supply and Demand Dashboard PRO
Bernhard Schweigert
4.82 (22)
현재 20% 할인! 이 대시보드는 여러 기호와 최대 9개의 타임프레임에서 작동하는 매우 강력한 소프트웨어입니다. 주요 지표(최상의 리뷰: 고급 공급 수요)를 기반으로 합니다.   Advanced Supply Demand 대시보드는 훌륭한 개요를 제공합니다. 다음과 같이 표시됩니다.  영역 강도 등급을 포함하여 필터링된 공급 및 수요 값, 영역에 대한/및 영역 내 Pips 거리, 중첩된 영역을 강조 표시하고 모든 (9) 시간 프레임에서 선택한 기호에 대해 4가지 종류의 경고를 제공합니다. 그것은 당신의 개인적인 필요에 맞게 고도로 구성 가능합니다! 당신의 혜택! 모든 트레이더에게 가장 중요한 질문: 시장에 진입하기에 가장 좋은 수준은 무엇입니까? 최고의 성공 기회와 위험/보상을 얻으려면 강력한 공급/수요 영역 내 또는 그 근처에서 거래를 시작하십시오. 손절매를 위한 최적의 장소는 어디입니까? 가장 안전하려면 강력한 수요/공급 구역 아래/위에 정
Max Paynex
Abdulkarim Karazon
Max Payne은 화살표 형태로 신호를 제공하는 반전/추세 신호 지표입니다. 이 지표는 동일한 막대 종가에 신호를 제공하며, 이 지표는 신호의 이중/삼중 확인을 위해 다양한 기간으로 차트에서 여러 번 떨어질 수 있습니다. 표시기는 다시 칠하거나 다시 칠하지 않는 동안 모든 거래 스타일에 맞게 고도로 조정 가능합니다. 사용된 템플릿과 함께 구매 후 스크린샷에 표시된 전체 시스템을 얻을 수 있습니다. ----------------- 거래 방법: 트렌드 필터(구매 후 얻을 수 있는 Payne 트렌드)가 방향에 동의하는 동안 동일한 바에서 세 번의 확인을 받을 때까지 기다리세요. 거래를 개시하고 매수 거래의 경우 황금색 화살표(템플릿) 아래에 정지 손실을 설정하고 매도 거래의 경우 황금색 화살표(템플릿) 위에 설정하면 종료 신호는 반대쪽 첫 번째 흰색 점 신호(템플릿)입니다. ----------------- 매개변수: 신호주기 : 화살표주기 필터: 신호 필터 거리 : 양초로부터의 화살표
Please send me Direct message on MQL5 CHAT after purchasing the Indicator for Training and Installation Support There are some additional files that is important to use with the Indicator . So be sure to contact me after purchasing the Indicator So that I can add you for training and support . If you find any difficulty with installation then send me Direct message here So that I can connect with you via Anydesk or Teamview for the product installation. " Smart Order Block Indicator " to find
NAM Order Blocks
NAM TECH GROUP, CORP.
5 (1)
MT4 Multi-timeframe Order Blocks detection indicator. Features - Fully customizable on chart control panel, provides complete interaction. - Hide and show control panel wherever you want. - Detect OBs on multiple timeframes. - Select OBs quantity to display. - Different OBs user interface. - Different filters on OBs. - OB proximity alert. - ADR High and Low lines. - Notification service (Screen alerts | Push notifications). Summary Order block is a market behavior that indicates order collection
Up down v6T
Guner Koca
5 (1)
Thise indicator is up down v6  comes with tradingwiev pinescript. purchased people, after installed on terminal ,contact me on mql5  to get BONUS  TradingView pinescript. up-down indicator is no repaint and works all pairs and lower than weekly time frames charts. it is suitable also 1 m charts for all pairs. and hold long way to signal. dont gives too many signals. when red histogram cross trigger line that is up signal.and price probably will down when blue histogram cross trigger line that
Reversal Master
Alexey Minkov
4.92 (12)
The Reversal Master is an indicator for determining the current direction of price movement and reversal points. The indicator will be useful for those who want to see the current market situation better. The indicator can be used as an add-on for ready-made trading systems, or as an independent tool, or to develop your own trading systems. The Reversal Master indicator, to determine the reversal points,  analyzes a lot of conditions since the combined analysis gives a more accurate picture of t
제작자의 제품 더 보기
WalkForwardOptimizer MT5
Stanislav Korotky
3.86 (7)
WalkForwardOptimizer library allows you to perform rolling and cluster walk-forward optimization of expert advisers (EA) in MetaTrader 5. To use the library include its header file WalkForwardOptimizer.mqh into your EA source code, add call provided functions as appropriate. Once the library is embedded into EA, you may start optimization according to the procedure described in the User guide . When it's finished, intermediate results are saved into a CSV file and some special global variables.
RenkoFromRealTicks
Stanislav Korotky
4.67 (3)
This non-trading expert utilizes so called custom symbols feature ( available in MQL API as well) to build renko charts based on history of real ticks of selected standard symbol. RenkoFromRealTicks generates custom symbol quotes, thus you may open many charts to apply different EAs and indicators to the renko. It also transmits real ticks to update renko charts in real time. The generated renko chart uses M1 timeframe. It makes no sense to switch the renko chart to a timeframe other than M1. T
Order Book, known also as Market Book, market depth, Level 2, - is a dynamically updated table with current volumes of orders to buy and to sell specific financial instument at price levels near Bid and Ask. MetaTrader 5 provides the means for receiving market book from your broker, but in real time only, without access to its history. The library OrderBook History Library reads market book state in the past from archive files, created by OrderBook Recorder . The library can be embedded into you
AutomaticZigZag
Stanislav Korotky
4.67 (3)
This is a non-parametric ZigZag providing 4 different methods of calculation. Upward edge continues on new bars while their `highs` are above highest `low` among previous bars, downward edge continues on next bars while their `lows` are below lowest `high` among previous; Gann swing: upward edge continues while `highs` and `lows` are higher than on the left adjacent bar, downward edge continues while `highs` and `lows` are lower than on the left adjacent bar. Inside bars (with lower `high` and
FREE
ADXSignal
Stanislav Korotky
Classical ADX revamped to provide faster and more solid trading signals. This indicator calculates ADX values using standard formulae, but excludes operation of taking the module of ADX values, which is forcedly added into ADX for some reason. In other words, the indicator preserves natural signs of ADX values, which makes it more consistent, easy to use, and gives signals earlier than standard ADX. Strictly speaking, any conversion to an absolute value destroys a part of information, and it mak
CustomVolumeDelta
Stanislav Korotky
4.5 (2)
This indicator displays volume delta (of either tick volume or real volume) encoded in a custom symbol, generated by special expert advisers, such as RenkoFromRealTicks . MetaTrader does not allow negative values in the volumes, this is why we need to encode deltas in a special way, and then use CustomVolumeDelta indicator to decode and display the deltas. This indicator is applicable only for custom instruments generated in appropriate way (with signed volumes encoded). It makes no sense to ap
FREE
VolumeDeltaWaves
Stanislav Korotky
5 (1)
This indicator is an extended implementation of Weis waves. It builds Weis waves on absolute volumes (which is the classical approach) or delta of volumes (unique feature) using different methods of wave formation and visualization. It works with real volumes, if available, or with tick volumes otherwise, but also provides an option to use so called "true volume surrogates", as an artificial substitution for missing real volumes (for example, for Forex symbols), which was introduced in correspo
PointsVsBars
Stanislav Korotky
This indicator provides a statistical analysis of price changes (in points) versus time delta (in bars). It calculates a matrix of full statistics about price changes during different time periods, and displays either distribution of returns in points for requested bar delta, or distribution of time deltas in bars for requested return. Please, note, that the indicator values are always a number of times corresponding price change vs bar delta occurred in history. Parameters: HistoryDepth - numbe
FREE
Comparator
Stanislav Korotky
4.25 (8)
This indicator compares the price changes during the specified period for the current symbol and other reference symbol. It allows to analyze the similar movements of highly correlated symbols, such as XAUUSD and XAGUSD, and find their occasional convergences and divergences for trading opportunities. The indicator displays the following buffers: light-green thick line - price changes of the current symbol for TimeGap bars; light-blue thin line - price changes of the reference symbol ( LeadSymbo
FREE
SOMFX1Predictor
Stanislav Korotky
If you like trading by candle patterns and want to reinforce this approach by modern technologies, this indicator and other related tools are for you. In fact, this indicator is a part of a toolbox, that includes a neural network engine implementing Self-Organizing Map (SOM) for candle patterns recognition, prediction, and provides you with an option to explore input and resulting data. The toolbox contains: SOMFX1Builder  - a script for training neural networks; it builds a file with generalize
VolumeDeltaBars
Stanislav Korotky
This indicator is a conventional analytical tool for tick volumes changes. It calculates tick volumes for buys and sells separately, and their delta on every bar, and displays volumes by price clusters (cells) within a specified bar (usually the latest one). The algorithm used internally is the same as in the indicator VolumeDeltaMT5 , but results are shown as cumulative volume delta bars (candlesticks). Analogous indicator for MetaTrader 4 exists - CumulativeDeltaBars . This is a limited substi
This is a demo version of a non-trading expert , which utilizes so called the custom symbols feature ( available in MQL as well ) to build renko charts based on historical quotes of selected standard symbol and to refresh renko in real-time according to new ticks. Also it translates real ticks to the renko charts, which allows other EAs and indicators to trade and analyze renko. Place the EA on a chart of a working instrument. The lesser timeframe of the source chart is, the more precise resulti
FREE
OrderBook Utilities is a script, which performs several service operations on order book hob-files, created by OrderBook Recorder . The script processes a file for work symbol of the current chart. The file date is selected by means of the input parameter CustomDate (if it's filled in) or by the point where the script is dropped on the chart. Depending from the operation, useful information is written into the log, and optionally new file is created. The operation is selected by the input parame
FREE
Order Book, known also as Market Book, market depth, Level 2, - is a dynamically updated table with current volumes of orders to buy and to sell specific financial instument at price levels near Bid and Ask. MetaTrader 5 provides the means for receiving market book from your broker, but in real time only, without access to its history. This expert adviser OrderBook History Playback allows you to playback the market book events on the history using files, created by OrderBook Recorder . The exper
FREE
Time And Sales Layout indicator shows traded buy and sell volumes right on the chart. It provides a graphical representation of most important events in the time and sales table. The indicator downloads and processes a history of real trade ticks. Depending from selected depth of history, the process may take quite some time. During history processing the indicator displays a comment with progress percentage. When the history is processed, the indicator starts analyzing ticks in real time. The l
Year2Year
Stanislav Korotky
This indicator shows price changes for the same days in past years. D1 timeframe is required. This is a predictor indicator that finds D1 bars for the same days in past 8 years and shows their relative price changes on the current chart. Parameters: LookForward - number of days (bars) to show "future" price changes; default is 5; Offset - number of days (bars) to shift back in history; default is 0; ShowAverage - mode switch; true - show mean value for all 8 years and deviation bounds; false - s
FREE
HZZM
Stanislav Korotky
3.25 (4)
This is an adaptive ZigZag based on modification of  HZZ indicator (original source code is available in this article ). Most important changes in this version: two additional indicator buffers added for zigzag evolution monitoring - they show cross signs at points where zigzag direction first changes; zigzag range (H) autodetection on day by day basis; time-dependent adjustment of zigzag range. Parameters: H - zigzag range in points; this parameter is similar to original HZZ, but it can take 0
FREE
WalkForwardBuilder MT5
Stanislav Korotky
5 (1)
This script allows performing a walk-forward analysis of trading experts based on the data collected by the WalkForwardLight MT5 library. The script builds a cluster walk forward report and rolling walk forward reports that refine it, in the form of a single HTML page. This script is optional, as the library automatically generates the report immediate after the optimization in the tester is complete. However, the script is convenient because it allows using the same collected data to rebuild th
FREE
WalkForwardDemo MT5
Stanislav Korotky
4 (2)
WalkForwardDemo is an expert adviser (EA) demonstrating how the built-in library WalkForwardOptimizer (WFO) for walk-forward optimization works. It allows you to easily optimize, view and analyze your EA performance and robustness in unknown trading conditions of future. You may find more details about walk-forward optimization in Wikipedia . Once you have performed optimization using WFO, the library generates special global variables (saved in an "archived" file with GVF-extension) and a CSV-f
FREE
CyclicPatterns
Stanislav Korotky
This indicator shows price changes for the same days in the past. This is a predictor that finds bars for the same days in past N years, quarters, months, weeks, or days (N is 10 by default) and shows their relative price changes on the current chart. Number of displayed buffers and historical time series for comparison is limited to 10, but indicator can process more past periods if averaging mode is enabled (ShowAverage is true) - just specify required number in the LookBack parameter. Paramet
Order Book, known also as Market Book, market depth, Level 2, - is a dynamically updated table with current volumes of orders to buy and to sell specific financial instument at price levels near Bid and Ask. MetaTrader 5 provides the means for receiving market book from your broker in real time. The expert OrderBook Recorder records market book changes and stores them in local files for further usage in indicators and expert adviser, including testing in the tester. The expert stores market book
FREE
SOMFX1Builder
Stanislav Korotky
5 (1)
If you like trading by candle patterns and want to reinforce this approach by modern technologies, this script is for you. In fact, it is a part of a toolbox, that includes a neural network engine implementing Self-Organizing Map (SOM) for candle patterns recognition, prediction, and provides you with an option to explore input and resulting data. The toolbox contains: SOMFX1Builder  - this script for training neural networks; it builds a file with generalized data about most characteristic pric
FREE
ReturnAutoScale
Stanislav Korotky
5 (2)
The indicator calculates running total of linear weighted returns. It transforms rates into integrated and difference-stationary time series with distinctive buy and sell zones. Buy zones are shown in blue, sell zones in red. Parameters: period - number of bars to use for linear weighted calculation; default value - 96; smoothing - period for EMA; default value - 5; mode - an integer value for choosing calculation mode: 0 - long term trading; 1 - medium term trading; 2 - short term trading; defa
FREE
Mirror
Stanislav Korotky
This indicator predicts rate changes based on the chart display principle. It uses the idea that the price fluctuations consist of "action" and "reaction" phases, and the "reaction" is comparable and similar to the "action", so mirroring can be used to predict it. The indicator has three parameters: predict - the number of bars for prediction (24 by default); depth - the number of past bars that will be used as mirror points; for all depth mirroring points an MA is calculated and drawn on the ch
If you like trading crosses (such as AUDJPY, CADJPY, EURCHF, and similar), you should take into account what happens with major currencies (especially, USD and EUR) against the work pair: for example, while trading AUDJPY, important levels from AUDUSD and USDJPY may have an implicit effect. This indicator allows you to view hidden levels, calculated from the major rates. It finds nearest extremums in major quotes for specified history depth, which most likely form resistence or support levels, a
EvoLevels
Stanislav Korotky
The indicator displays most prominent price levels and their changes in history. It dynamically detects regions where price movements form attractors and shows up to 8 of them. The attractors can serve as resistance or support levels and outer bounds for rates. Parameters: WindowSize - number of bars in the sliding window which is used for detection of attractors; default is 100; MaxBar - number of bars to process (for performance optimization); default is 1000; when the indicator is called from
ExtraMovingPivots
Stanislav Korotky
This is an intraday indicator that uses conventional formulae for daily and weekly levels of pivot, resistance and support, but updates them dynamically bar by bar. It answers the question how pivot levels would behave if every bar were considered as the last bar of a day. At every point in time, it takes N latest bars into consideration, where N is either the number of bars in a day (round the clock, i.e. in 24h) or the number of bars in a week - for daily and weekly levels correspondingly. So,
Most of traders use resistance and support levels for trading, and many people draw these levels as lines that go through extremums on a chart. When someone does this manually, he normally does this his own way, and every trader finds different lines as important. How can one be sure that his vision is correct? This indicator helps to solve this problem. It builds a complete set of virtual lines of resistance and support around current price and calculates density function for spatial distributi
The indicator draws a histogram of important levels for several major currencies attached to the current cross rates. It is intended for using on charts of crosses. It displays a histogram calculated from levels of nearest extremums of related major currencies. For example, hidden levels for AUDJPY can be detected by analyzing extremums of AUD and JPY rates against USD, EUR, GBP, and CHF. All instruments built from these currencies must be available on the client. This is an extended version of
StatBars
Stanislav Korotky
The indicator provides a statistic histogram of estimated price movements for intraday bars. It builds a histogram of average price movements for every intraday bar in history, separately for each day of week. Bars with movements above standard deviation or with higher percentage of buys than sells, or vice versa, can be used as direct trading signals. The indicator looks up current symbol history and sums up returns on every single intraday bar on a specific day of week. For example, if current
필터:
리뷰 없음
리뷰 답변
버전 1.1 2021.11.22
Recomplilation.