Market Profile Singles indicator MT5
- 지표
- Tomas Papp
- 버전: 4.0
- 업데이트됨: 6 2월 2022
- 활성화: 5
This indicator is based on market profile theory.
What exactly is a singles area?
Theory: Market Profile Singles :
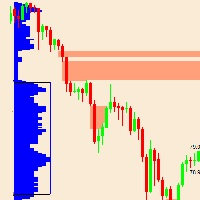
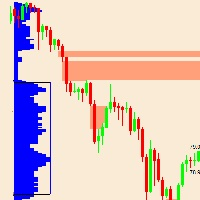
Singles or single prints or gap of the profile are placed in the inside of a profile structure, not at the upper or lower edge.
They are represented with single TPOs printed on the Market profile.
Singles draw our attention to places where the price moved very fast (impulse movements). They leave low volume nodes with liquidity gaps and therefore the market imbalance and show us the area of imbalance.Singles are usually created when the market reacts to unexpected news. It is these reports that are capable of causing extreme imbalances and preparing the spawn for the extreme emotional reactions of buyers and sellers.
The market will want to revisit this area and examine whether these price levels are not traders interested in trading at these prices. Why should these merchants be there? Because the market literally flew through the area and only a small number of traders got a chance to trade there. For that these areas are likely to be filled in the future .
These inefficient moves tend to get filled and we can seek trading opportunities once they get filled or we can also enter before they get filled and use these single prints as targets.
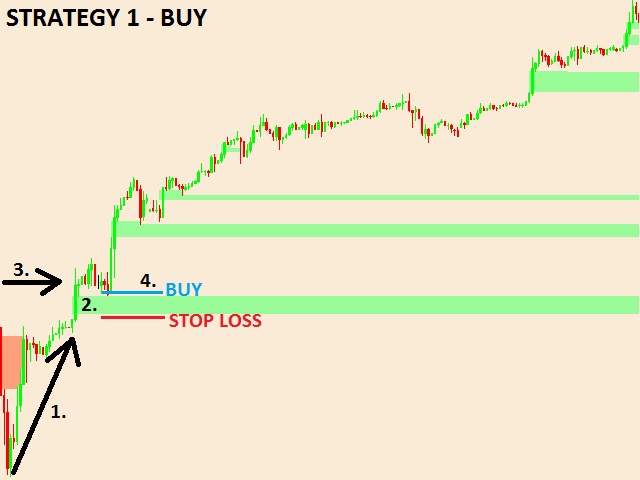
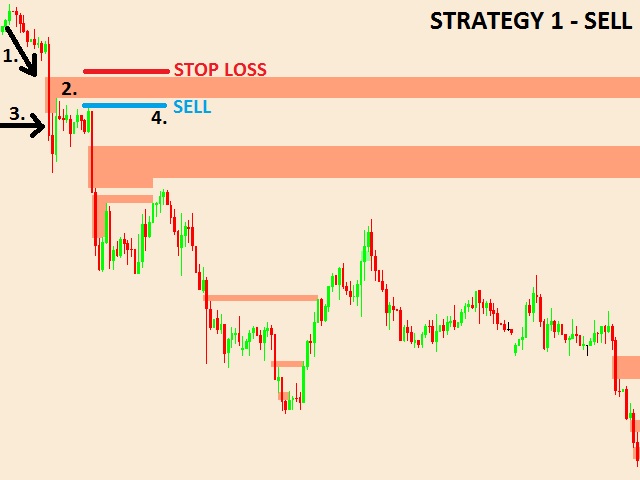
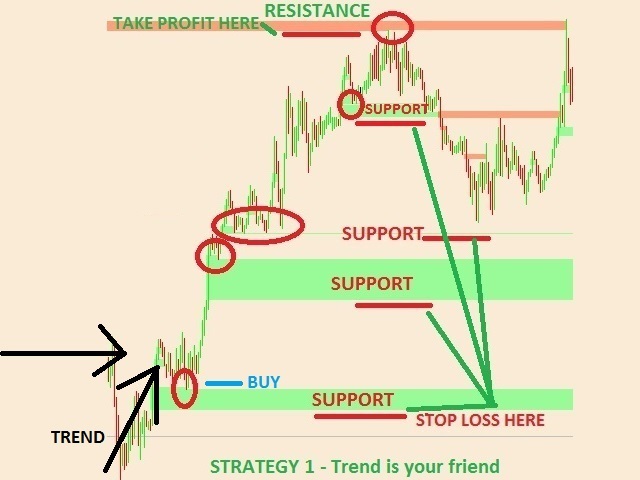
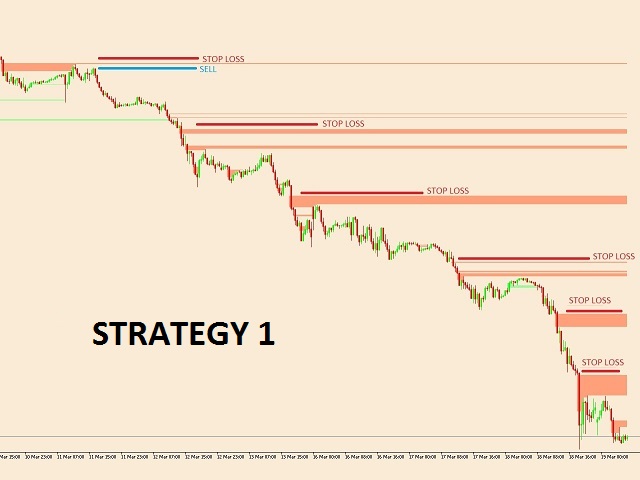
Used as support/resistance zones , but be careful not always.Usually it works very well on trend days . See market profile days: trend day (Strategy 1 - BUY - third picture) and trend day with double distribution (Strategy 1 - SELL- third picture) .
It is good to start the trend day
but Be aware that trend days are only 15 - 20% of the time
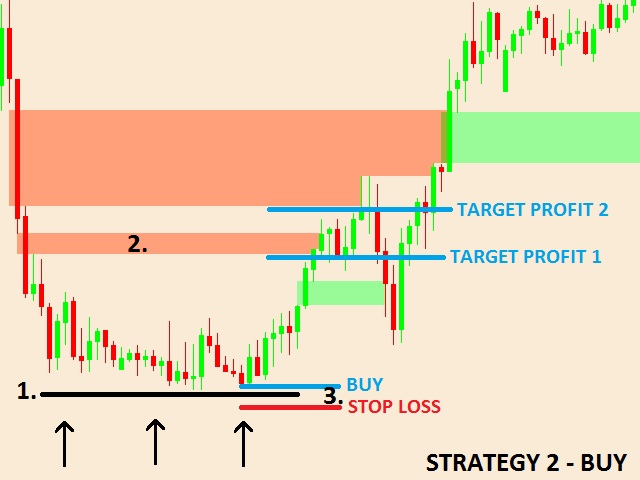
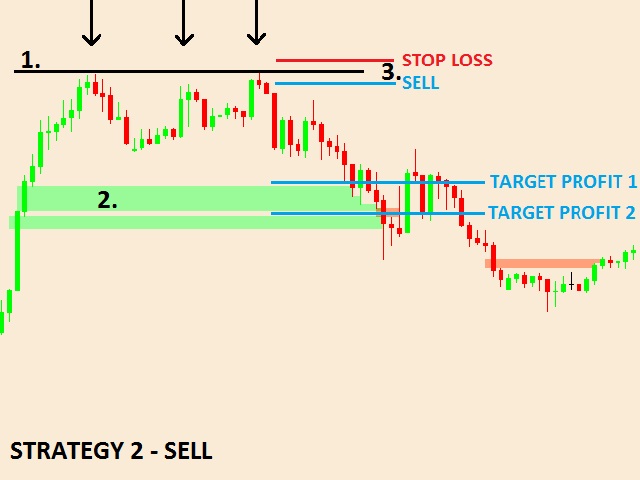
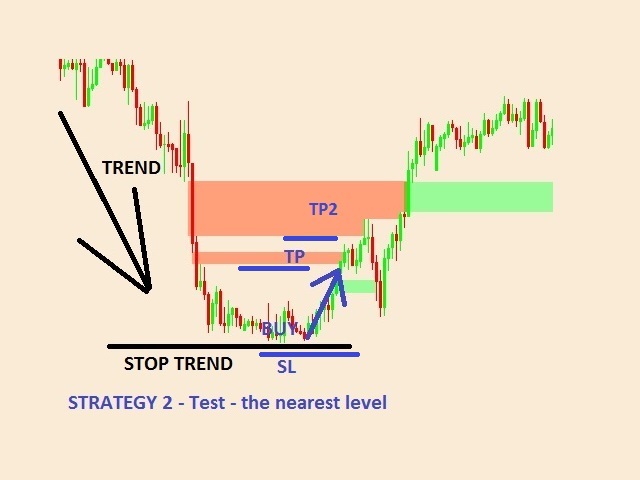
Therefore, I mainly recommend strategy 2, which is 75-80% of the time .
These levels are watched by the big boys and the banks. This indicator will show you these levels.
Remember there is more than a 80% chance that these areas will be tested in the future. This puts the probability to our side.
Observe money and risk management .Always use a stop loss . RRR minimum 3:1 .Take a risk a maximum of 0.5 - 1% of the account per trade.
I enclose three strategies that I trade myself.
These three strategies are repeated in the market, so it is good to trade all three .
Strategy 1: Trend is your friend
Strategy 2 : Test the nearest level
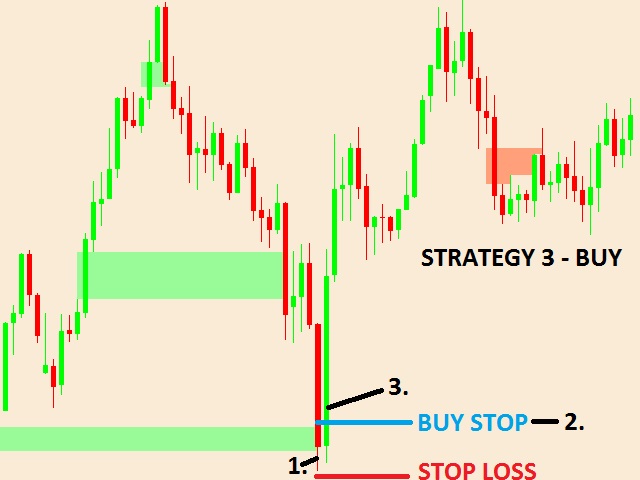
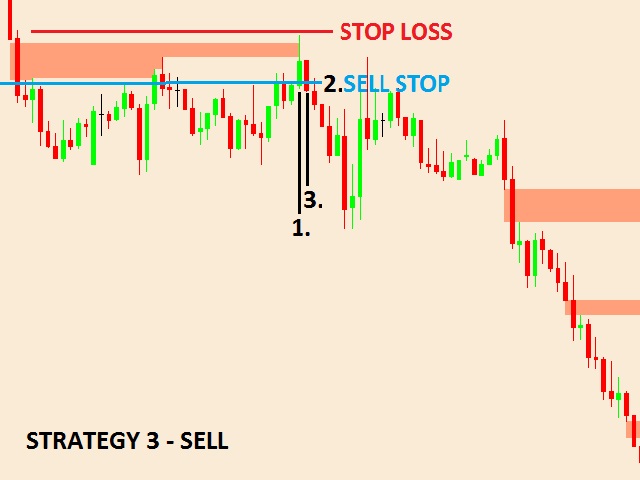
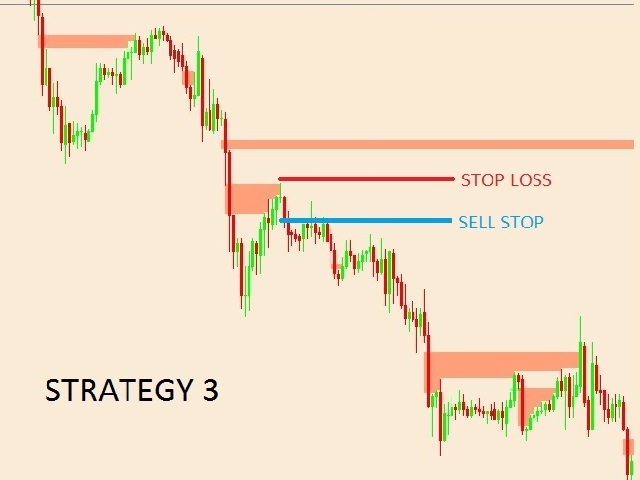
Strategy 3 : Close singles and continuing the trend
Recommended time frame is M30 and especially strategy 2.
A complete description of the strategies and all the pictures can be seen HERE . Please study it .
After purchasing this indicator, you will get another 2 indicators. Market profile indicator + support and resistance indicator .
After purchasing the indicator, please write me:
Date of purchase, country of origin. And you get this indicators for FREE.




I am very satisfied with the indicator