Joe DiNapoli
- 지표
- Luigi Nunes Labigalini
- 버전: 1.0
- 활성화: 5
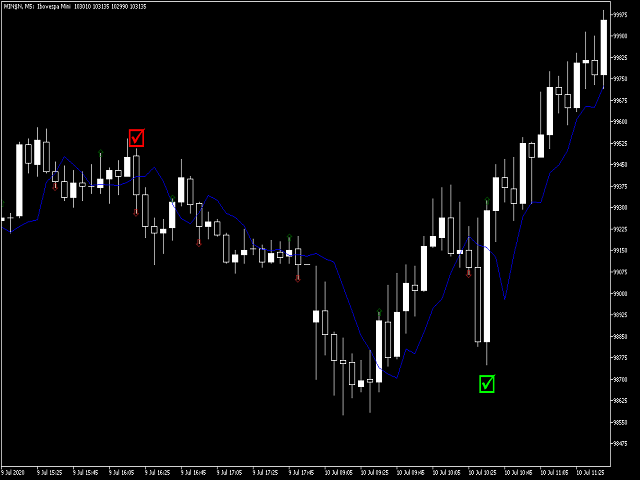
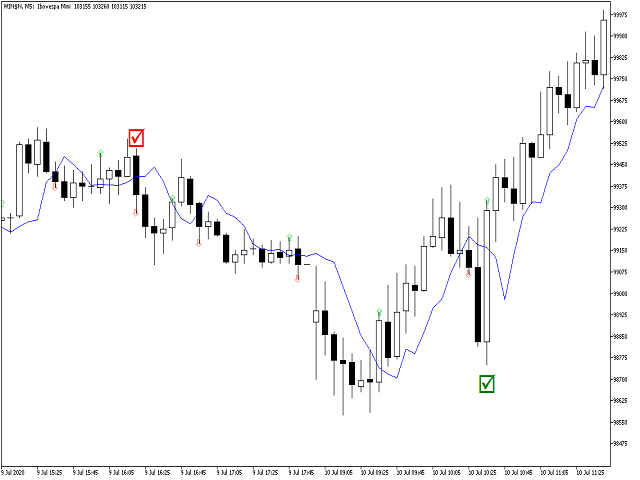
Buy and sell signals based on Joe DiNapoli's shifted 3 period exponential moving average strategy for trend reversals.
Who is he?
Joe DiNapoli is a professional trader and author that has been involved in the markets for more than 38 years. He is also a registered Commodity Trading Advisor (C.T.A.) for over 15 years and has taught his techniques in the major financial capitals of Europe, Asia, South Africa, the Middle East, Russia and in the United States.
How does the indicator work?
The indicator activates the buy and sell signal when their respective conditions are met, anticipating the breakout of a pivot.
For a buy signal, first we need the price to be trending down and closing below the 3-period exponential moving average shifted by 3 periods. When the price closes above the EMA3(3) we have the first bottom. Then, we need the price to close below the EMA3(3) and then again above the EMA3(3), to form the second bottom. For the setup to be valid, the second bottom can have a lower low than the first bottom's low, but can not close below the first bottom's low.
For a sell signal, first we need the price to be trending up and closing above the 3-period exponential moving average shifted by 3 periods. When the price closes below the EMA3(3) we have the first top. Then, we need the price to close above the EMA3(3) and then again below the EMA3(3), to form the second top. For the setup to be valid, the second top can have a higher high than the first top's high, but can not close above the first top's high.
How to use it?
Enter the trade with a buy stop order one tick above the high of the candle with the buy signal, placing the stop loss order one tick below the candle's low.
When there's a sell signal instead, place a sell stop order one tick below the low of the candle with the sell signal, and a stop loss one tick above the candle's high.
If the entry stop order is not filled on the next candle, you can cancel it and wait for another signal.
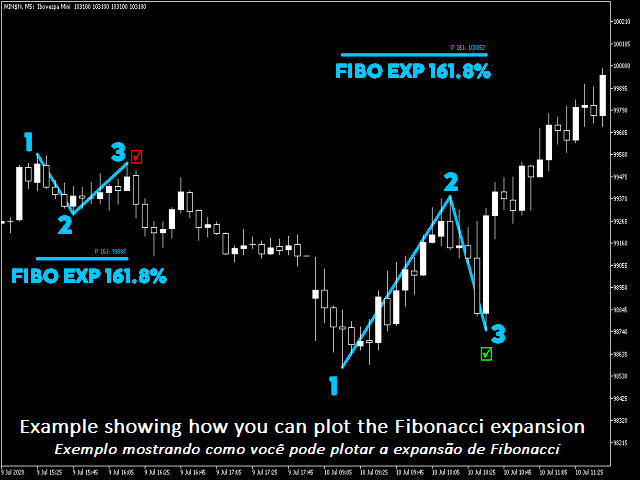
For the profit target, use the Fibonacci expansion on the first swing with the third point being the second bottom/top, aiming for the 161.8% level.
Tips:
- It is more effective in the weekly chart, but it can be used on any timeframe.
- To give more room for the trade, you can place the stop loss order on the first or second bottom for the buy signal and on the first or second top for the sell signal.
- Ideally, the second top/bottom should be slightly below/above the first one.
Features you can edit to your preference:
- Five options of distance between the arrow signals and the candle's high/low, that auto adjust itself for different symbols and timeframes.
- Trend filter: how many bars in trend with the shifted exponential moving average before the first reversal.
- Color and size of the Buy and Sell signal arrows.
- Color, thickness and style of the exponential moving average.

