• 미리보기
  • 리뷰
  • 코멘트 (1)

BeST Keltner Channels Strategies MT5

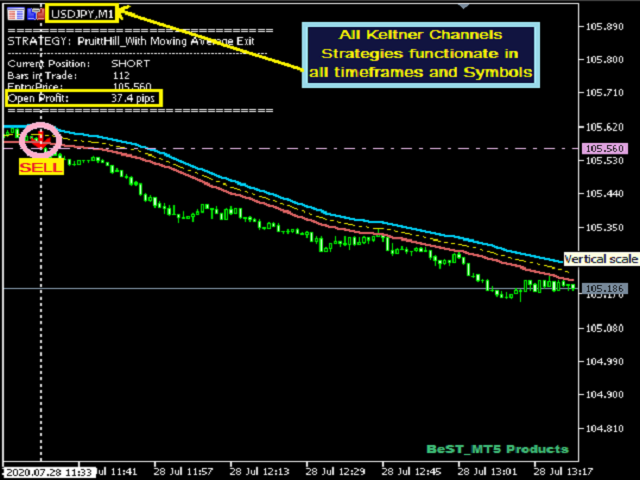
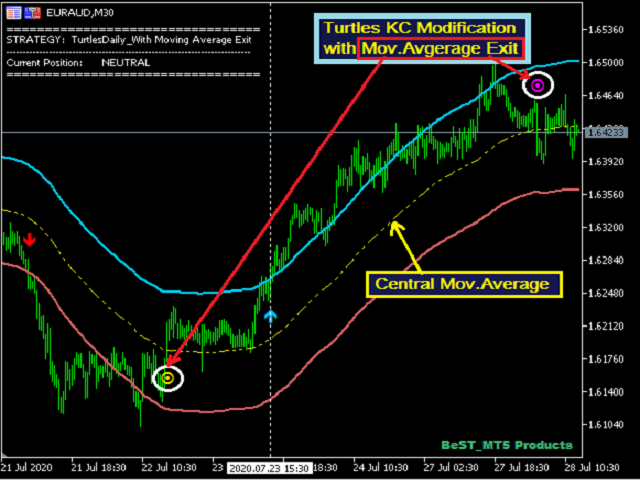
BeST_Keltner Channels Strategies MT5  is an  MT5  Indicator based on the original Keltner Channels Indicator and it can display in the Chart all the known Variations of Keltner Channels and also the corresponding 10 totally Strategies. Every such generally consists of a Central Moving Average Line and two Boundary Bands at a distance above and below it and can be traded mainly in a Trending Mode but also in a Ranging ReEntry Mode. 

BeST_Keltner Channels Strategies Indicator

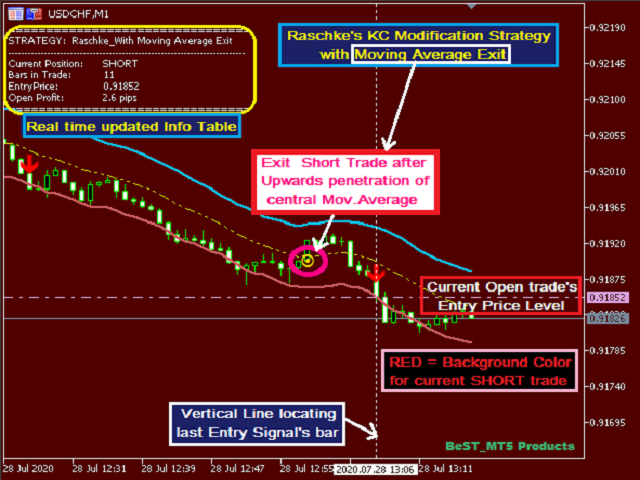
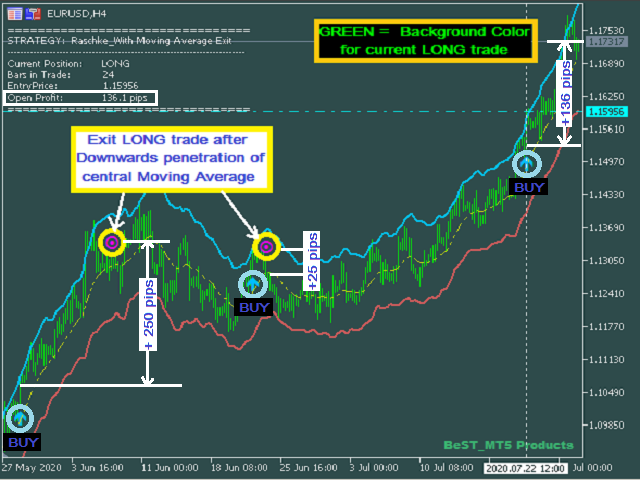
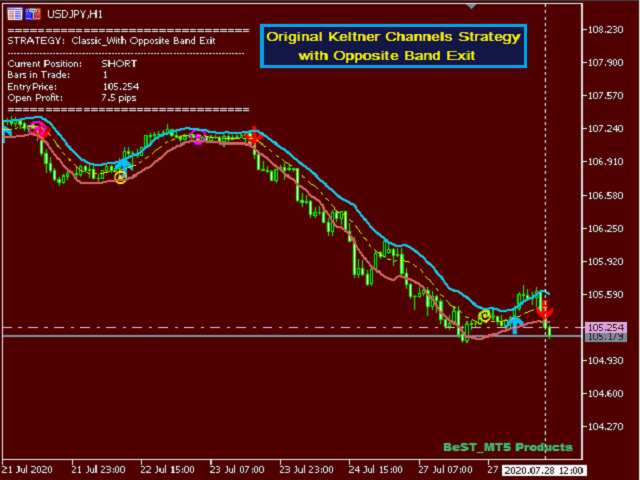
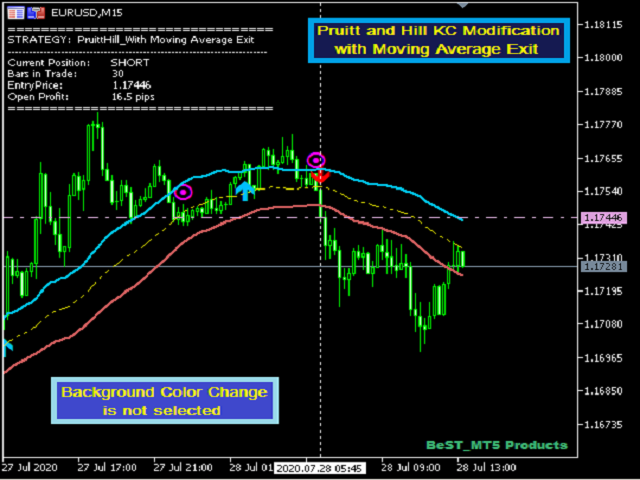
  • Draws definite Buy/Sell Arrows and Exit Signals
  • Draws always only after the bar closing and so is non-repainting and non-backpainting
  • Displays the corresponding Keltner Channels Variations 
  • Displays a real-time updated Info Comment Table
  • It can be used as a standalone Trading System
  • Has fully customizable colors, sizes & distances of all Chart objects
  • Implements all MT5 Alerts for the Entry and Exit Signals
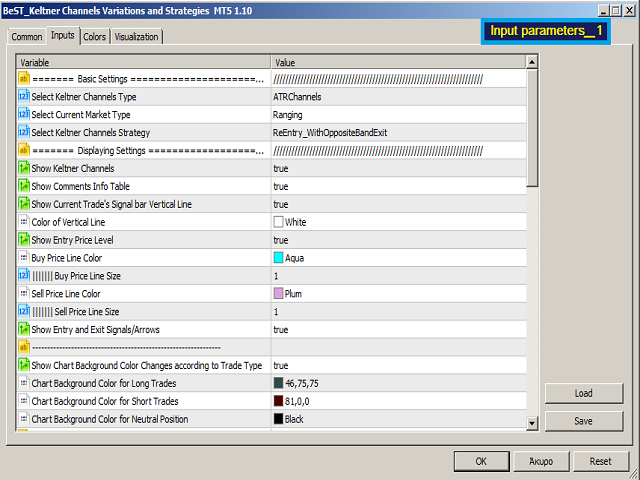
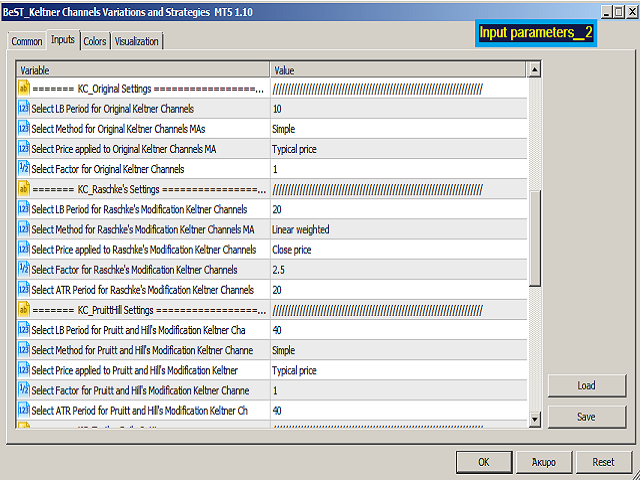
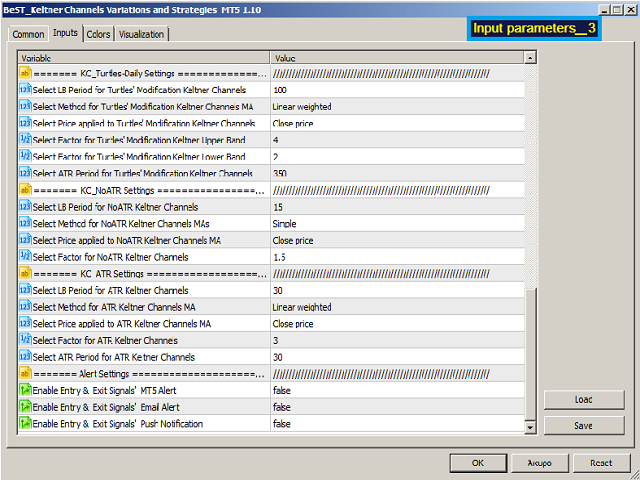
Input parameters

== Basic Settings
  • Select Keltner Channels Type
  • Select Current Market Type
  • Select Keltner Channels Strateg
    == Displaying Settings - for selecting which chart objects and features to show / activate.
      == Every other selection is related to the Keltner Channels parameters
      •  KC_Original Settings
      •  KC_Raschke's Settings
      •  KC_PruittHill Settings
      •  KC_Turtles-Daily Settings
      •  KC_NoATR Settings
      •  KC_ATR Settings
      == Alert Settings – for controlling all types of MT5 Alerts

      For EA Developers

      Buy Arrow :             Buffer = 4
      Sell Arrow :             Buffer = 5
      Exit Long :              Buffer = 6
      Exit Short :             Buffer = 7


      추천 제품
      Keltner Channel indicator for MT5
      Renaud Herve Francois Candel
      Keltner Channel Indicator Keltner Channel is an oscillator like Bollinger Bands. Keltner Channel is a very good tool to time entries for your strategy. Keltner Channel displays a channel where price is supposed to stay unless we are in overbought or oversold situations. Various strategies use Keltner Channel indicator successfully to spot overbought / oversold situations and look for reversals. Keltner Channel indicator uses ATR to determine overbought and oversold situations. Inputs of the
      Ichimoku Aiko MTF
      Michael Jonah Randriamampionontsoa
      Ichimoku Aiko MTF is a collection of technical indicators that show support and resistance levels, as well as momentum and trend direction. It is a multi-timeframe indicator so you don't need to change the chart timeframe when you want to see the ichimoku clouds on a higher timeframe.  eg. The chart timeframe is M15 and you want to see on the M15 timeframe chart the H1 ichimoku indicators (the ichimoku in Metatrader can't do that) that's why you need to use Ichimoku Aiko MTF.
      K Channel
      Pavel Gotkevitch
      K_Channel is a technical indicator defining the current Forex market status - trend or flat. The indicator works on any timeframe. H1 and higher timeframes are recommended though to minimize false signals. The indicator is displayed as lines above and below EMA. Average True Range (ATR) is used as bands' width. Therefore, the channel is based on volatility. This version allows you to change all the parameters of the main Moving Average. Unlike Bollinger Bands that applies the standard deviation
      Gekko RSI Plus
      Rodrigo Galeote
      This is Gekko's Cutomized Relative Strength Index (RSI), a customized version of the famous RSI indicator. Use the regular RSI and take advantage two entry signals calculations and different ways of being alerted whenever there is potential entry or exit point. Inputs Period: Period for the RSI calculation; How will the indicator calculate entry (swing) signals: 1- Produces Exit Signals for Swings based on RSI entering and leaving Upper and Lower Levels Zones; 2- Produces Entry/Exit Signals fo
      Swing Tracer
      Ely Alsedy
      5 (2)
      it depends on ATR period to get swing points to help make better trading decisions  blue dot and red dot is the default color scheme of course you can change it later if you'd like  you can change the following : ATR PERIOD  sending notifications number of times to send notifications  sending notifications to your smart phone that's it very simple to use just drag and drop and follow the trend 
      Owl Smart Levels MT5
      Sergey Ermolov
      4.38 (37)
      MT4 버전  |  FAQ Owl Smart Levels Indicator 는 Bill Williams 의 고급 프랙탈, 시장의 올바른 파동 구조를 구축하는 Valable ZigZag, 정확한 진입 수준을 표시하는 피보나치 수준과 같은 인기 있는 시장 분석 도구를 포함하는 하나의 지표 내에서 완전한 거래 시스템입니다. 시장과 이익을 취하는 장소로. 전략에 대한 자세한 설명 표시기 작업에 대한 지침 고문-거래 올빼미 도우미의 조수 개인 사용자 채팅 ->구입 후 나에게 쓰기,나는 개인 채팅에 당신을 추가하고 거기에 모든 보너스를 다운로드 할 수 있습니다 힘은 단순함에 있습니다! Owl Smart Levels 거래 시스템은 사용하기 매우 쉽기 때문에 전문가와 이제 막 시장을 연구하고 스스로 거래 전략을 선택하기 시작한 사람들 모두에게 적합합니다. 전략 및 지표에는 눈에 보이지 않는 비밀 공식 및 계산 방법이 없으며 모든 전략 지표는 공개되어 있습니다. Owl Smart Levels를
      Pan PrizMA CD Phase
      Aleksey Panfilov
      The Expert Advisor and the video are attached in the Discussion tab . The robot applies only one order and strictly follows the signals to evaluate the indicator efficiency. Pan PrizMA CD Phase is an option based on the Pan PrizMA indicator. Details (in Russian). Averaging by a quadric-quartic polynomial increases the smoothness of lines, adds momentum and rhythm. Extrapolation by the sinusoid function near a constant allows adjusting the delay or lead of signals. The value of the phase - wave s
      All about time and price by ICT. This indicator provides a comprehensive view of ICT killzones, Silver Bullet times, and ICT Macros, enhancing your trading experience.  In those time windows price either seeks liquidity or imbalances and you often find the most energetic price moves and turning points. Features: Automatic Adaptation: The ICT killzones intelligently adapt to the specific chart you are using. For Forex charts, it follows the ICT Forex times: In EST timezone: Session: Asia: 20h00-0
      InfinX Slope MT5
      Stanislav Shtiliyanov
      The Slope indicator   measures the slope of a linear regression , which is the line of best fit for a data series. A 20-period Slope, therefore, measures the slope of a 20-day linear regression. ... In general, a positive slope indicates an uptrend, while a negative slope indicates a downtrend. How do you use slope Indicator? By applying the slope indicator  to both the price chart and the price relative , chartists can quantify the price trend and relative performance with one indicator. A po
      Renko System
      Marco Montemari
      This indicator can be considered as a trading system. It offers a different view to see the currency pair: full timeless indicator, can be used for manual trading or for automatized trading with some expert advisor. When the price reaches a threshold a new block is created according to the set mode. The indicator beside the Renko bars, shows also 3 moving averages. Features renko mode median renko custom median renko 3 moving averages wicks datetime indicator for each block custom notificatio
      Noize Absorption Index
      Ekaterina Saltykova
      Noize Absorption Index - is the manual trading system that measures the difference of pressure between bears forces and bulls forces. Green line - is a noize free index that showing curent situation. Zero value of index shows totally choppy/flat market.Values above zero level shows how powerfull bullish wave is and values below zero measures bearish forces.Up arrow appears on bearish market when it's ready to reverse, dn arrow appears on weak bullish market, as a result of reverse expectation.
      Premium level Pro
      Dmitriy Kashevich
      Premium level is a unique indicator with more than 80% accuracy of correct predictions! This indicator has been tested for more than two months by the best Trading Specialists! The author's indicator you will not find anywhere else! From the screenshots you can see for yourself the accuracy of this tool! 1 is great for trading binary options with an expiration time of 1 candle. 2 works on all currency pairs, stocks, commodities, cryptocurrencies Instructions: As soon as the red ar
      Indicator and Expert Adviser  EA Available in the comments section of this product. Download with Indicator must have indicator installed for EA to work. Mt5 indicator alerts for bollinger band and envelope extremes occurring at the same time. Buy signal alerts occur when A bullish candle has formed below both the lower bollinger band and the lower envelope  Bar must open and close below both these indicators. Sell signal occur when A bear bar is formed above the upper bollinger band and upp
      KDJ Index 4   交易实用必备工具指标 波浪自动计算指标,通道趋势交易 完美的趋势-波浪自动计算通道计算 , MT4版本 完美的趋势-波浪自动计算通道计算 , MT5版本 本地跟单复制交易 Easy And Fast Copy , MT4版本 Easy And Fast Copy , MT5版本 本地跟单复制交易 模拟试用 Easy And Fast Copy , MT4 模拟账号运行 Easy And Fast Copy , MT5 模拟账号运行 "Cooperative QQ:556024  "  "Cooperation wechat:556024"  "Cooperative email:556024@qq.com" 强烈推荐趋势指标, 波浪的标准自动计算   和   波浪的标准自动计算MT5版本     KDJ指标又叫 随机指标 ,是一种相当新颖、实用的技术分析指标,它起先用于期货市场的分析,后被广泛用于股市的中短期趋势分析,是期货和股票市场上最常用的技术分析工具。 随机指标KDJ一般是用于股票分析的统计体系,根据统计学原理,通过一个特定的周期(常为9日、9周等
      Double HMA MTF for MT5
      Pavel Zamoshnikov
      3.67 (3)
      This is an advanced multi-timeframe version of the popular Hull Moving Average (HMA) Features Two lines of the Hull indicator of different timeframes on the same chart. The HMA line of the higher timeframe defines the trend, and the HMA line of the current timeframe defines the short-term price movements. A graphical panel with HMA indicator data from all timeframes at the same time . If the HMA switched its direction on any timeframe, the panel displays a question or exclamation mark with a tex
      Gartley Projections D
      Oleksandr Medviediev
      3 (2)
      The indicator identifies the harmonic patterns (XABCD) according to developments of H.M.Gartley ( "Profits in the Stock Market" , 1935г). It projects D-point as a point in the perspective projection (specify ProjectionD_Mode = true in the settings). Does not redraw. When a bar of the working timeframe closes, if the identified pattern point has not moved during Patterns_Fractal_Bars bars, an arrow appears on the chart (in the direction of the expected price movement). From this moment on, the ar
      Terra Infinity
      Ivan Simonika
      Terra Infinity is a flat indicator. This improved version of the CalcFlat indicator has three additional lines that significantly increase its effectiveness. Unlike its predecessor with two static levels, Terra Infinity adds three dynamic lines above the main histogram, which are interpreted as follows: base signal line, minimum signal line, maximum signal line. These lines are formed using the additional parameter Avg, which is the average value of the histogram. Averaging produces a line
      Big Player Range
      Thalles Nascimento De Carvalho
      5 (2)
      "BigPlayerRange" 지표에 오신 것을 환영합니다. 이것은 시장에서 금융 기관이 주목하는 중요한 영역을 식별하기 위해 개발된 기술 분석 도구입니다. 이 지표는 시장 주요 참여자들이 상당한 활동과 관심을 나타내는 가격 범위를 정확하게 분석합니다. 주요 기능: 1. 기관 관심 영역 매핑: "BigPlayerRange"는 금융 기관이 강한 활동을 나타내는 차트 영역을 정확하게 강조합니다. 이러한 지점은 전략적으로 중요하며 시장 움직임에 대한 통찰력을 제공합니다. 2. 출구 참조로서 예측: 관심 영역을 식별하는 것뿐만 아니라, 이 지표는 예측을 두 단계로 나눠 가능한 출구 참조로 사용합니다. 이러한 예측은 향후 가격 방향을 기반으로 전략을 계획하는 데 도움이 됩니다. 3. 식별된 범위로의 복귀 시 Pullback 확률: "BigPlayerRange"의 독특한 기능 중 하나는 가격이 관심 범위로 복귀할 때 Pullback 확률을 계산할 수 있는 능력입니다. 이는
      IndicateMe
      Dani Cyril Bakkum
      The IndicateMe indicator has been specially created to remove as much noise as possible from the signals it gives. The indicator has been combined with several other well-known indicators. Indicators  that have been used: "Moving average, stocastic indicator, relative strenght index, moving". All indicators that are used can be adjusted by yourself. The default settings are set to the values ​​I like to use. Easily set alerts to always stay informed of the indicator's signals. Important: thi
      This indicator draws the Keltner Channel using the rates chart calculated from any other timeframe. The available Moving Averages are: Simple Moving Average Exponential Moving Average Smoothed Moving Average Linear Weighted Moving Average Tillson's Moving Average Moving Average line is coded into RED or BLUE according to its direction from the previous candle. Example: User can display the Keltner Channel calculated on the basis of a Daily (D1) chart on a H4 chart. NOTE: Timeframe must be higher
      Market Overview MT5
      Mehran Sepah Mansoor
      시장 강세 및 심리지표로 매매 결정을 최적화하고 더 이상 추세에 역행하는 트레이딩을 하지 마세요! 정확하고 시기 적절한 정보를 중요시하는 진지한 트레이더를 위해 세심하게 설계된 이 지표는 28개 주요 통화쌍을 매우 간단한 방법으로 한눈에 볼 수 있습니다. 이 도구는 인기도, 강세 또는 약세 추세 강도, 매수자 및 매도자 비율 /   MT5   버전을 기준으로 통화쌍의 순위를 매길 수 있습니다.  특징 실시간 추세 강도: 각 통화쌍의 추세 강도를 정확하게 평가하여 거래 기회를 파악할 수 있는 확실한 가이드를 제공합니다. 매수자 및 매도자 분석: 각 통화쌍에 대한 매수 및 매도자 강세 순위를 통해 시장 역학에 대한 즉각적인 통찰력을 얻고 중요한 움직임을 예측할 수 있습니다. 트레이더 관심도: 각 통화쌍에 대한 트레이더 관심도 및 활동 데이터에 액세스하여 새로운 추세와 잠재적 전환점을 더 잘 이해할 수 있습니다. 직관적이고 사용자 지정 가능한 대시보드: 사용하기 쉬운 대시
      Trend Reader Indicator MT5
      Lachezar Krastev
      5 (2)
      SUPER SALE! --> BUY Trend Reader Indicator with -$180 OFF and GET a BONUS EA: News Scope EA PRO with AMAZING results! NOTE: Trend Reader Indicator PROMO price: $117 (The next price $297) - The offer ends soon! Click here to check News Scope EA PRO results and learn more about the promotion! Trend Reader Indicator is a revolutionary trading indicator designed to empower forex traders with the tools they need to make informed trading decisions. This cutting-edge indicator utilizes complex mathema
      Gekko MACD Plus
      Rodrigo Galeote
      3 (3)
      Type: Oscillator This is Gekko's Cutomized Moving Average Convergence/Divergence (MACD), a customized version of the famous MACD indicator. Use the regular MACD and take advantage of several entry signals calculations and different ways of being alerted whenever there is potential entry point. Inputs Fast MA Period: Period for the MACD's Fast Moving Average (default 12); Slow MA Period: Period for the MACD's Slow Moving Average (default 26); Signal Average Offset Period: Period for the Signal
      The Predicting Donchian Channel MT5 indicator allows predicting the future changes in the levels of the Donchian channel based on the channel position of the price. The standard ZigZag indicator starts drawing its ray in 99% of the time the opposite Donchian channel is touched. The forecast of the channel boundary levels will help in finding the points, where the correction ends or the trend changes, an also to estimate how soon those events can occur. Configurations Period - Donchian channel
      TrendDetect
      Pavel Gotkevitch
      The Trend Detect indicator combines the features of both trend indicators and oscillators. This indicator is a convenient tool for detecting short-term market cycles and identifying overbought and oversold levels. A long position can be opened when the indicator starts leaving the oversold area and breaks the zero level from below. A short position can be opened when the indicator starts leaving the overbought area and breaks the zero level from above. An opposite signal of the indicator can
      Automated Trendlines MT5
      Georgios Kalomoiropoulos
      추세선은 외환 거래에서 기술적 분석의 가장 필수적인 도구입니다. 불행히도, 대부분의 거래자는 올바르게 그리지 않습니다. 자동 추세선 표시기는 시장의 추세 움직임을 시각화하는 데 도움이 되는 진지한 거래자를 위한 전문 도구입니다. 추세선 강세 추세선과 약세 추세선에는 두 가지 유형이 있습니다. 상승 추세에서 Forex 추세선은 가격 움직임의 가장 낮은 스윙 포인트를 통해 그려집니다. 최소 두 개의 "최저 저점"을 연결하면 추세선이 생성됩니다. 하락 추세에서 추세선은 가격 움직임의 가장 높은 스윙 포인트를 통해 그려집니다. 최소 두 개의 "최고 최고점"을 연결하면 추세선이 생성됩니다. 추세선이 깨질 때? 강세 추세선은 약세 양초가 강세 추세선 아래에서 닫히고 양초의 고점이 추세선 위에 있을 때 깨집니다. 약세 추세선은 강세 양초가 약세 추세선 위로 마감되고 양초 저점이 추세선 아래에 있을 때 깨집니다. 추세선이 삭제되면? 강세 추
      The indicator detects and displays М. Gartley's Butterfly pattern. The pattern is plotted by the extreme values of the ZigZag indicator (included in the resources, no need to install). After detecting the pattern, the indicator notifies of that by the pop-up window, a mobile notification and an email. The pattern and wave parameters are displayed on the screenshots. The default parameters are used for demonstration purposes only in order to increase the amount of detected patterns. Parameters
      Harmonic Pattern Plus MT5
      Young Ho Seo
      4.5 (4)
      Introduction Harmonic Patterns are best used to predict potential turning point. Traditionally, Harmonic Pattern was identified manually connecting peaks and troughs points in the chart. Manual harmonic pattern detection is painfully tedious and not suitable for everyone. You are often exposed under subjective pattern identification with manual pattern detection. To avoid these limitations, Harmonic Pattern Plus was designed to automate your harmonic pattern detection process. The functionality
      Time And Sales Delta
      Evgeny Shevtsov
      5 (2)
      The indicator displays the delta and the cumulative delta based on the "Time & Sales" deals list data. In addition to the standard timeframes, the indicator displays data regarding the seconds timeframes (S5, S10, S15, S20, S30) to choose from. Using the rectangle, user can select an arbitrary area in the indicator subwindow to view the ratio of the volumes of deals of buyers and sellers within this area. Indicator features: The indicator works correctly only on those trading symbols for whi
      이 제품의 구매자들이 또한 구매함
      Atomic Analyst MT5
      Issam Kassas
      5 (14)
      우선적으로 언급할 점은이 거래 지표가 다시 그리지 않고 지연되지 않으며 이를 통해 수동 및 로봇 거래 모두에 이상적이라는 점입니다. 사용자 매뉴얼: 설정, 입력 및 전략. Atomic Analyst는 가격의 강도와 모멘텀을 활용하여 시장에서 더 나은 이점을 찾는 PA Price Action Indicator입니다. 고급 필터를 장착하여 잡음과 거짓 신호를 제거하고 거래 잠재력을 높이는 데 도움이 됩니다. 복잡한 지표의 다중 레이어를 사용하여 Atomic Analyst는 차트를 스캔하고 복잡한 수학적 계산을 간단한 신호와 색상으로 변환하여 초보 트레이더가 이해하고 일관된 거래 결정을 내릴 수 있도록합니다. "Atomic Analyst"는 새로운 및 경험이 풍부한 트레이더를위한 종합적인 거래 솔루션입니다. 프리미엄 지표와 최고 수준의 기능을 하나의 거래 전략에 결합하여 모든 종류의 트레이더에 대한 다재다능한 선택지가되었습니다. 인트라데이 거래 및 스캘핑 전략 : 빠르고 정확한
      우선 이 거래 시스템이 리페인팅, 리드로잉 및 레이그 인디케이터가 아니라는 점을 강조하는 것이 중요합니다. 이는 수동 및 로봇 거래 모두에 이상적인 것으로 만듭니다. 온라인 강좌, 설명서 및 프리셋 다운로드. "스마트 트렌드 트레이딩 시스템 MT5"은 새로운 및 경험이 풍부한 트레이더를 위해 맞춤형으로 제작된 종합적인 거래 솔루션입니다. 10개 이상의 프리미엄 인디케이터를 결합하고 7개 이상의 견고한 거래 전략을 특징으로 하여 다양한 시장 조건에 대한 다목적 선택이 가능합니다. 트렌드 추종 전략: 효과적인 트렌드 추이를 타기 위한 정확한 진입 및 손절 관리를 제공합니다. 반전 전략: 잠재적인 트렌드 반전을 식별하여 트레이더가 범위 시장을 활용할 수 있게 합니다. 스캘핑 전략: 빠르고 정확한 데이 트레이딩 및 단기 거래를 위해 설계되었습니다. 안정성: 모든 인디케이터가 리페인팅, 리드로잉 및 레이그가 아니므로 신뢰할 수 있는 신호를 보장합니다. 맞춤화: 개별 거래 선호도를 고려한 맞춤
      Quantum Trend Sniper
      Bogdan Ion Puscasu
      5 (43)
      소개       Quantum Trend Sniper Indicator는   추세 반전을 식별하고 거래하는 방식을 변화시키는 획기적인 MQL5 지표입니다! 13년 이상의 거래 경험을 가진 숙련된 트레이더 팀이 개발한       Quantum Trend Sniper 표시기       매우 높은 정확도로 추세 반전을 식별하는 혁신적인 방법으로 거래 여정을 새로운 차원으로 끌어올리도록 설계되었습니다. ***Quantum Trend Sniper Indicator를 구입하면 Quantum Breakout Indicator를 무료로 받을 수 있습니다!*** Quantum Trend Sniper Indicator는 추세 반전을 식별하고 세 가지 이익실현 수준을 제안할 때 경고, 신호 화살표를 제공합니다. 초보자 거래자와 전문 거래자 모두에게 적합합니다. Quantum EA 채널:       여기를 클릭하세요 MT4 버전:       여기를 클릭하세요
      TPSpro RFI Levels MT5
      Roman Podpora
      5 (8)
      Reversal First Impulse levels (RFI)      INSTRUCTIONS        RUS       -       ENG              R ecommended to use with an indicator   -   TREND PRO -  Version MT4                 A key element in trading is zones or levels from which decisions to buy or sell a trading instrument are made. Despite attempts by major players to conceal their presence in the market, they inevitably leave traces. Our task was to learn how to identify these traces and interpret them correctly. Main functions:: Di
      우선적으로, 이 거래 도구는 전문적인 거래에 이상적인 비-다시 그리기 및 지연되지 않는 지표입니다.  온라인 강좌, 사용자 매뉴얼 및 데모. 스마트 가격 액션 컨셉트 인디케이터는 신규 및 경험 많은 트레이더 모두에게 매우 강력한 도구입니다. Inner Circle Trader Analysis 및 Smart Money Concepts Trading Strategies와 같은 고급 거래 아이디어를 결합하여 20가지 이상의 유용한 지표를 하나로 결합합니다. 이 인디케이터는 스마트 머니 컨셉트에 중점을 두어 대형 기관의 거래 방식을 제공하고 이동을 예측하는 데 도움을 줍니다.  특히 유동성 분석에 뛰어나 기관이 어떻게 거래하는지 이해하는 데 도움을 줍니다. 시장 트렌드를 예측하고 가격 변동을 신중하게 분석하는 데 탁월합니다. 귀하의 거래를 기관 전략에 맞추어 시장의 동향에 대해 더 정확한 예측을 할 수 있습니다. 이 인디케이터는 시장 구조를 분석하고 중요한 주문 블록을 식별하
      FX Volume MT5
      Daniel Stein
      4.94 (17)
      모닝 브리핑을 통해 세부 정보와 스크린샷으로 매일 시장 업데이트를 받으세요 여기 mql5 및 텔레그램에서 FX 거래량은 브로커의 관점에서 시장 심리에 대한 실제 통찰력을 제공하는 최초이자 유일한 거래량 지표입니다. 브로커와 같은 기관 시장 참여자가 외환 시장에서 어떤 포지션을 취하고 있는지에 대한 훌륭한 통찰력을 COT 보고서보다 훨씬 빠르게 제공합니다. 차트에서 이 정보를 직접 확인하는 것은 트레이딩의 진정한 판도를 바꾸고 획기적인 솔루션입니다. 다음과 같은 고유한 시장 데이터 인사이트의 이점 비율 는 통화의 매수/매도 포지션 비율을 백분율로 표시 비율 변화 는 선택한 기간 내 매수 비율과 비율 변화를 표시 총 거래량 는 해당 통화의 총 거래량(롱 및 숏)을 로트 단위로 보여줍니다 Volumes Long 는 해당 통화의 모든 롱 포지션의 거래량을 보여줍니다 Volumes Short 는 해당 통화의 모든 숏 포지션의 거래량을 보여줍니다 Net Long 는 순 롱 포지션의 거래량
      Gold Stuff mt5
      Vasiliy Strukov
      4.89 (179)
      Gold Stuff mt5는 금을 위해 특별히 설계된 추세 지표이며 모든 금융 상품에서도 사용할 수 있습니다. 표시기가 다시 그려지지 않고 지연되지 않습니다. 권장 기간 H1. 설정 및 개인 보너스를 받으려면 구매 후 즉시 저에게 연락하십시오!     강력한 지원 및 트렌드 스캐너 표시기의 무료 사본을 받으실 수 있습니다. 메시지를 보내주세요. 나!   설정 화살표 그리기 - 켜기 끄기. 차트에 화살표 그리기. 경고 - 가청 경고를 끕니다. 이메일 알림 - 켜기 끄기. 이메일 알림. Puch-notification - 켜기 끄기. 푸시 알림. 다음으로 색 영역을 조정합니다. Gold Stuff mt5는 금을 위해 특별히 설계된 추세 지표이며 모든 금융 상품에서도 사용할 수 있습니다. 표시기가 다시 그려지지 않고 지연되지 않습니다. 권장 기간 H1. 설정 및 개인 보너스를 받으려면 구매 후 즉시 저에게 연락하십시오!   설정 화살표 그리기 - 켜기 끄기. 차트에
      Trend Screener Pro MT5
      STE S.S.COMPANY
      4.88 (64)
      트렌드 표시기, 트렌드 트레이딩 및 필터링을 위한 획기적인 고유 솔루션, 하나의 도구 안에 내장된 모든 중요한 트렌드 기능! Forex, 상품, 암호 화폐, 지수 및 주식과 같은 모든 기호/도구에 사용할 수 있는 100% 다시 칠하지 않는 다중 시간 프레임 및 다중 통화 표시기입니다. Trend Screener는 차트에 점이 있는 화살표 추세 신호를 제공하는 효율적인 지표 추세 추종 지표입니다. 추세 분석기 표시기에서 사용할 수 있는 기능: 1. 트렌드 스캐너. 2. 최대 이익 분석이 있는 추세선. 3. 추세 통화 강도 측정기. 4. 경고가 있는 추세 반전 점. 5. 경고가 있는 강력한 추세 점. 6. 추세 화살표 Trend Screener Indicator가 있는 일일 분석 예, 일일 신호 성능...등은 여기에서 찾을 수 있습니다. 여기를 클릭하십시오. LIMITED TIME OFFER : Trend Screener Indicator는 50$ 및 평생 동안만 사용할 수 있습니다
      XQ Indicator MetaTrader 5
      Marzena Maria Szmit
      5 (1)
      Step into the realm of Forex trading with confidence and precision using XQ, a cutting-edge Forex indicator designed to elevate your trading game to unprecedented heights. Whether you're a seasoned trader or just stepping into the world of currency exchange, XQ Forex Indicator empowers you with the insights and signals needed to make informed trading decisions. The signal conditions are a combination of three indicators, and XQ Forex Indicator only display  medium and long-term trends . The ind
      Entry Points Pro for MT5
      Yury Orlov
      4.55 (160)
      다시 색을 칠하지 않고 거래에 진입할 수 있는 정확한 신호를 제공하는 MT5용 지표입니다. 외환, 암호화폐, 금속, 주식, 지수 등 모든 금융 자산에 적용할 수 있습니다. 매우 정확한 추정값을 제공하고 매수와 매도의 가장 좋은 시점을 알려줍니다. 하나의 시그널로 수익을 내는 지표의 예와 함께 비디오 (6:22)시청하십시오! 대부분의 거래자는 Entry Points Pro 지표의 도움으로 첫 거래 주 동안 트레이딩 결과를 개선합니다. 저희의   Telegram Group 을 구독하세요! Entry Points Pro 지표의 좋은점. 재도색이 없는 진입 신호 신호가 나타나고 확인되면(시그널 캔들이 완성된 경우) 신호는 더 이상 사라지지 않습니다. 여타 보조지표의 경우 신호를 표시한 다음 제거되기 때문에 큰 재정적 손실로 이어집니다. 오류 없는 거래 게시 알고리즘을 통해 트레이드(진입 또는 청산)를 할 이상적인 순간을 찾을 수 있으며, 이를 통해 이를 사용하는 모든 거래자의
      ICT, SMC, SMART MONEY CONCEPTS, SMART MONEY, Smart Money Concept, Support and Resistance, Trend Analysis, Price Action, Market Structure, Order Blocks, BOS/CHoCH,   Breaker Blocks ,  Momentum Shift,   Supply&Demand Zone/Order Blocks , Strong Imbalance,   HH/LL/HL/LH,    Fair Value Gap, FVG,  Premium  &   Discount   Zones, Fibonacci Retracement, OTE, Buy Side Liquidity, Sell Side Liquidity, BSL/SSL Taken, Equal Highs & Lows, MTF Dashboard, Multiple Time Frame, BigBar, HTF OB, HTF Market Structure
      FX Power MT5 NG
      Daniel Stein
      5 (5)
      모닝 브리핑 여기 mql5 와 텔레그램에서 FX Power MT5 NG 는 오랫동안 인기 있는 통화 강도 측정기인 FX Power의 차세대 버전입니다. 이 차세대 강도 측정기는 무엇을 제공합니까? 기존 FX Power에서 좋아했던 모든 것 PLUS GOLD/XAU 강도 분석 더욱 정밀한 계산 결과 개별 구성 가능한 분석 기간 더 나은 성능을 위한 사용자 정의 가능한 계산 한도 특별 멀티더 많은 것을보고 싶은 사람들을위한 특별한 다중 인스턴스 설정 모든 차트에서 좋아하는 색상을위한 끝없는 그래픽 설정 수많은 알림 옵션, 중요한 것을 다시는 놓치지 않도록 Windows 11 및 macOS 스타일의 둥근 모서리가 있는 새로운 디자인 마법처럼 움직이는 인디케이터 패널 FX 파워 키 특징 모든 주요 통화의 완전한 강세 이력 모든 시간대에 걸친 통화 강세 이력 모든 브로커 및 차트에서 고유 계산 결과 100% 신뢰할 수있는 실시간100 % 신뢰할 수있는 실시간 계산-> 다시 칠하지 않음
      가격이 역전되고 후퇴함에 따라 시장 구조가 변경됩니다. 시장 구조 반전 경고 표시기는 추세 또는 가격 움직임이 고갈에 가까워지고 반전할 준비가 되었음을 식별합니다. 일반적으로 반전이나 큰 하락이 일어나려고 할 때 발생하는 시장 구조의 변화를 알려줍니다. 지표는 가능한 고갈 지점 근처에서 새로운 고점 또는 저점이 형성될 때마다 초기에 돌파와 가격 모멘텀을 식별합니다. 표시기는 반대쪽에 있는 마지막 촛불에 직사각형을 그립니다. 그런 다음 현재의 단기 추세에서 계속 움직이기 때문에 가격과 함께 직사각형을 따라갈 것입니다. 가격이 사각형 위나 아래로 다시 닫힐 정도로 약해지면 시장 구조에 잠재적인 변화가 일어나고 있음을 나타냅니다. 그런 다음 표시기는 방향의 잠재적인 이동과 추세 또는 주요 하락의 가능한 반전 시작에 대해 경고합니다. 작동 방식을 보려면 아래의 작동 표시기를 참조하십시오! 모든 쌍 및 주요 기간을 모니터링하는 대시보드: https://www.mql5.com/
      TrendMaestro5
      Stefano Frisetti
      note: this indicator is for METATRADER4, if you want the version for METATRADER5 this is the link:  https://www.mql5.com/it/market/product/108106 TRENDMAESTRO ver 2.4 TRENDMAESTRO recognizes a new TREND in the bud, he never makes mistakes. The certainty of identifying a new TREND is priceless. DESCRIPTION TRENDMAESTRO identifies a new TREND in the bud, this indicator examines the volatility, volumes and momentum to identify the moment in which there is an explosion of one or more of these data a
      소개       Quantum Breakout PRO   , 브레이크아웃 존 거래 방식을 변화시키는 획기적인 MQL5 지표! 13년 이상의 거래 경험을 가진 숙련된 트레이더 팀이 개발한       퀀텀 브레이크아웃 PRO       혁신적이고 역동적인 브레이크아웃 존 전략으로 거래 여정을 새로운 차원으로 끌어올리도록 설계되었습니다. Quantum Breakout Indicator는 5개의 이익 목표 영역이 있는 브레이크아웃 영역의 신호 화살표와 브레이크아웃 상자를 기반으로 한 손절 제안을 제공합니다. 초보자 거래자와 전문 거래자 모두에게 적합합니다. Quantum EA 채널:       여기를 클릭하세요 중요한! 구매 후 설치 매뉴얼을 받으려면 개인 메시지를 보내주십시오. 추천: 기간: M15 통화쌍: GBPJPY, EURJPY, USDJPY,NZDUSD, XAUUSD 계정 유형: 스프레드가 매우 낮은 ECN, Raw 또는 Razor 브로커 시간: GM
      AW Trend Predictor MT5
      AW Trading Software Limited
      4.78 (58)
      하나의 시스템에서 추세와 고장 수준의 조합입니다. 고급 지표 알고리즘은 시장 노이즈를 필터링하고 추세, 진입점 및 가능한 출구 수준을 결정합니다. 표시기 신호는 통계 모듈에 기록되어 가장 적합한 도구를 선택하여 신호 기록의 효율성을 보여줍니다. 이 표시기는 이익 실현 및 손절매 표시를 계산합니다. 매뉴얼 및 지침 ->   HERE   / MT4 버전 ->   HERE 지표로 거래하는 방법: Trend Predictor로 거래하는 것은 3단계로 간단합니다. 1단계 - 포지션 열기 70% 이상의 성공률로 매수 신호를 받았습니다. 2단계 - StopLoss 결정 반대 신호로 트렁크 선택 3단계 - 이익 실현 전략 정의 전략 1: TP1 도달 시 전체 포지션 청산 전략 2: TP1 도달 시 포지션의 50% 청산 및 TP2 도달 시 나머지 50% 청산 전략 3: 추세 반전 시 전체 포지션 청산 이익: 결과를 다시 그리지 않음, 신호는 엄격하게 양초가 닫힐 때 어드바이저에서 사용할 수 있습니
      TPSproTREND PrO MT5
      Roman Podpora
      4.88 (8)
      TPSpro TRENDPRO  - is a trend indicator that automatically analyzes the market and provides information about the trend and each of its changes, as well as giving signals for entering trades without redrawing! The indicator uses each candle, analyzing them separately. referring to different impulses - up or down impulse. Exact entry points into transactions for currencies, crypto, metals, stocks, indices!  -  Version MT4               DETAILED DESCRIPTION               R ecommended to use with
      Bill Williams Advanced
      Siarhei Vashchylka
      5 (6)
      Bill Williams Advanced is designed for automatic chart analysis using Bill Williams' "Profitunity" system. The indicator analyzes four timeframes at once. Manual (Be sure to read before purchasing) Advantages 1. Automatically analyzes the chart using the "Profitunity" system of Bill Williams. The found signals are placed in a table in the corner of the screen. 2. Equipped with a trend filter based on the Alligator indicator. Most of the system signals are recommended to be used only accordi
      Quantum Heiken Ashi PRO MT5
      Bogdan Ion Puscasu
      4.5 (8)
      시장 동향에 대한 명확한 통찰력을 제공하도록 설계된 Heiken Ashi 양초는 노이즈를 필터링하고 잘못된 신호를 제거하는 기능으로 유명합니다. 혼란스러운 가격 변동에 작별을 고하고 더 매끄럽고 신뢰할 수 있는 차트 표현을 만나보세요. Quantum Heiken Ashi PRO를 정말 독특하게 만드는 것은 전통적인 촛대 데이터를 읽기 쉬운 색상 막대로 변환하는 혁신적인 공식입니다. 빨간색과 녹색 막대는 각각 약세와 강세 추세를 우아하게 강조하여 잠재적 진입점과 퇴장점을 매우 정확하게 파악할 수 있습니다. Quantum EA 채널:       여기를 클릭하세요 MT4 버전:       여기를 클릭하세요 이 놀라운 지표는 다음과 같은 몇 가지 주요 이점을 제공합니다. 선명도 향상: Heiken Ashi 바는 가격 변동을 완화하여 시장 추세를 보다 명확하게 나타내므로 유리한 거래 기회를 쉽게 식별할 수 있습니다. 소음 감소: 종종 잘못된 신호로 이어지는 불규칙한 가격 변동
      Golden Gate Algo MT5
      James David Lane
      4 (6)
      크리스마스 40% 할인! 1월 1일에 가격이 $250로 인상됩니다! GoldenGate Entries를 소개합니다: 혁신적인 트레이딩 솔루션! GoldenGate Entries (GGE)를 사용하여 거래하는 혁신적인 방법을 발견하세요. GGE는 귀하의 거래 경험을 향상시키기 위해 디자인된 고급 지표로, 사용자에게 정확성과 자신감을 부여하는 포괄적인 기능을 제공합니다. 페어: 아무거나 (FX - 상품 - 주식 - 주식 - 암호화폐) 타임프레임: 15분에서 H1까지 주요 기능: 매수 및 매도 화살표 표시: 팝업 알림과 함께 매수 및 매도 화살표 표시를 받아 언제나 정보를 확인할 수 있습니다. GoldenGate_Algo: 시장 상황에 대한 통찰력을 얻으려면 GoldenGate_Algo를 사용하세요. 시장이 '과매도'인지 '과매수'인지 평가하는 강력한 도구입니다. 현재 트렌드 분석: 현재 보고 있는 타임프레임에서 현재 트렌드에 액세스하여 거래를 주류 시장 방
      TPA True Price Action indicator reveals the true price action of the market makers through 100% non-repainting signals strictly at the close of a candle! TPA shows entries and re-entries, every time the bulls are definitely stronger than the bears and vice versa. Not to confuse with red/green candles. The shift of power gets confirmed at the earliest stage and is ONE exit strategy of several. There are available now two free parts of the TPA User Guide for our customers. The first "The Basics"
      The 1 2 3 Pattern Scanner MT5
      Reza Aghajanpour
      5 (14)
      ** All Symbols x All Timeframes scan just by pressing scanner button ** ***Contact me after purchase to send you instructions and add you in "123 scanner group" for sharing or seeing experiences with other users. After 17 years of experience in the markets and programming, Winner indicator is ready. I would like to share with you! Introduction The 123 Pattern Scanner indicator with a special enhanced algorithm is a very repetitive common pattern finder with a high success rate . Interestingly,
      Auto Order Block with break of structure based on ICT and Smart Money Concepts (SMC) Futures Break of Structure ( BoS )             Order block ( OB )            Higher time frame Order block / Point of Interest ( POI )    shown on current chart           Fair value Gap ( FVG ) / Imbalance   -  MTF      ( Multi Time Frame )    HH/LL/HL/LH  -  MTF      ( Multi Time Frame )  Choch  MTF      ( Multi Time Frame )  Volume Imbalance     ,  MTF          vIMB Gap’s Power of 3 Equal High
      Blahtech Market Profile MT5
      Blahtech Limited
      5 (8)
      Was: $249  Now: $99   Market Profile defines a number of day types that can help the trader to determine market behaviour. A key feature is the Value Area, representing the range of price action where 70% of trading took place. Understanding the Value Area can give traders valuable insight into market direction and establish the higher odds trade. It is an excellent addition to any system you may be using. Inspired by Jim Dalton’s book “Mind Over Markets”, this indicator is designed to suit the
      Legacy of Gann for MT5
      Pavel Zamoshnikov
      5 (6)
      The indicator very accurately determines the levels of the possible end of the trend and profit fixing. The method of determining levels is based on the ideas of W.D.Gann, using an algorithm developed by his follower Kirill Borovsky. Extremely high reliability of reaching levels (according to K. Borovsky  - 80-90%) Indispensable for any trading strategy – every trader needs to determine the exit point from the market! Precisely determines targets on any timeframes and any instruments (forex, met
      Easy Buy Sell Signal Alert
      Franck Martin
      4.86 (7)
      Easy By Sell is a market indicator for opening and closing positions. It becomes easy to track market entries with alerts. It indicates trend reversal points when a price reaches extreme values ​​and the most favorable time to enter the market. it is as effective as a Fibonacci to find a level but it uses different tools such as an algorithm based on ATR indicators and Stochastic Oscillator. You can modify these two parameters as you wish to adapt the settings to the desired period. My othe
      우선적으로 이 거래 시스템은 다시 그리지 않고, 다시 그리지 않으며, 지연되지 않는 것을 강조할 가치가 있습니다. 이는 전문적인 거래에 이상적입니다. 온라인 강좌, 사용자 매뉴얼 및 데모. "스마트 서포트 앤 레지스턴스 트레이딩 시스템"은 새로운 및 경험 많은 트레이더를 위해 개발된 고급 지표입니다. 이 시스템은 외환 시장에서 정밀도와 신뢰감을 제공합니다. 이 포괄적인 시스템은 일일 거래 전략, 스윙 거래 전략, 지원 및 저항 전략, 캔들스틱 패턴 전략, VWAP 전략, 다중 시간대 추세 전략 등을 포함한 7개 이상의 전략, 10개의 지표 및 다양한 거래 방식을 결합합니다. 이 시스템은 화살표 신호, 진입 및 출구 지점, 거래 경보, 높은 시간대 추세 분석, 실시간 거래 모니터링 및 트렌드 및 볼륨 캔들 색상 제공합니다. 자동 지원 및 저항 감지로 다양한 시장 상황에서 신중한 결정을 돕는 다면적 인 지표입니다. 스마트 서포트 앤 레지스턴스 트레이딩 시스템은 프리미엄 및 강력한
      Gartley Hunter Multi
      Siarhei Vashchylka
      5 (7)
      Gartley Hunter Multi - An indicator for searching for harmonic patterns simultaneously on dozens of trading instruments and on all possible timeframes. Manual (Be sure to read before purchasing) | Version for MT4 Advantages 1. Patterns: Gartley, Butterfly, Shark, Crab. Bat, Alternate Bat, Deep Crab, Cypher 2. Simultaneous search for patterns on dozens of trading instruments and on all possible timeframes 3. Search for patterns of all possible sizes. From the smallest to the largest 4. A
      IX Power MT5
      Daniel Stein
      5 (3)
      IX Power는   마침내 FX Power의 탁월한 정밀도를 외환이 아닌 기호에도 적용했습니다. 좋아하는 지수, 주식, 원자재, ETF, 심지어 암호화폐까지 단기, 중기, 장기 추세의 강도를 정확하게 파악할 수 있습니다. 단말기가 제공하는   모든 것을 분석할   수 있습니다. 사용해 보고 트레이딩   타이밍이 크게 향상되는   것을 경험해 보세요. IX Power 주요 특징 단말기에서 사용 가능한 모든 거래 심볼에 대해 100% 정확한 비재도장 계산 결과 제공 사전 구성 및 추가적으로 개별 구성 가능한 강도 분석 기간의 드롭다운 선택 가능 이메일, 메시지, 모바일 알림을 통한 다양한 알림 옵션 제공 EA 요청을 위한 액세스 가능한 버퍼 더 나은 성능을 위한 사용자 지정 가능한 계산 한도 더 많은 것을 보고 싶은 사용자를 위한 특별 다중 인스턴스 설정 모든 차트에서 좋아하는 색상을 위한 무한한 그래픽 설정 가능 Windows 11 및 macOS 스타일의 둥
      Trend Reversal Scanner MT5
      Reza Aghajanpour
      5 (3)
      **   All Symbols   x   All Timeframes   scan just by pressing scanner button ** *** Contact me after the purchase to send you instructions and add you in "Trend Reversal group" for sharing or seeing experiences with other users. Introduction: Trendlines are the most famous technical analysis in trading . Trendlines continually form on the charts of markets across all the different timeframes providing huge opportunities for traders to jump in and profit on the action. In the other hand,  The tre
      제작자의 제품 더 보기
      BeST Oscillators Collection MT5
      Eleni Koulocheri
      4.14 (7)
      BeST_Oscillators Collection is a Composite MT5 Indicato r including the Chaikin ,  Chande and TRIX Oscillators from which by default Chaikin and TRIX Oscillators but not Chande Momentum Oscillator are contained in MT5 platform. It also provides for each Oscillator the option of displaying or not a Mov. Average as a  Signal Line and the resulting Signals as Arrows in a Normal (all arrows) or in a Reverse Mode (without showing up any resulting successive and of same type arrows). Analytically f
      FREE
      BeST_Darvas Boxes EA is an MT4  Expert Advisor that is based on the most classic trading method developed  in the 50's by Nicolas Darvas  commonly known as The Darvas Boxes Trading System. The Original Darvas Boxes System can be found in details in his book "How I Made $2,000,000 In The Stock Market"  (Copyright 1960, by Nicolas Darvas). Although the original system was designed to trade only Stocks and to open only Long trades its trading principles can also be applied to many other Markets
      BeST Darvas Boxes
      Eleni Koulocheri
      5 (5)
      BeST_Darvas Boxes is an MT4  Indicator based on the trading method developed in the 50’s by the Hungarian Nicolas Darvas . BeST_Darvas Boxes indicator draws the Top and the Bottom of every Darvas Box  that can be confirmed on the current Chart. draws Buy and Sell Arrows  for every confirmed Upwards or Downwards Breakout of the above levels. draws always only after the bar closing and so is non-repainting or backpainting . Note : Every customer who wants to have the older version v_1.75 with t
      BeST Gann Hi Lo Strategy
      Eleni Koulocheri
      5 (12)
      BeST_Gann Hi-Lo Strategy is an MT4 indicator that is based on the Gann Hi-Lo Activator the famous trend-following indicator that allow us to to enter a trade quite early while also stay in a trade as longer as we can for taking profit.While it is built of a moving average it helps traders determine the direction of the trends and to produce with-trend trading signals. This indicator is in fact a simple moving average of the highs and lows of the previous period. It follows the trends in the mar
      FREE
      BeST_Hull Single MA Strategy is an Metatrader Indicator based on the famous indicator Hull Mov.Average . This indicator can display the Single HMA Strategy of just 1 Hull MAvg. It uses added internal filters locating the most likely Entries while it can be used as a standalone system or as an add-on to other ones. Generally the Hull Moving Average (HMA - developed by Alan Hull) is a directional trend indicator . It captures the current state of the market and uses recent price action to determi
      BeST Oscillators Collection
      Eleni Koulocheri
      4.2 (5)
      BeST Oscillators Collection is a Composite MT4 Indicator including the  Chaikin,Chande  and TRIX Oscillators which by default are contained in  MT5  but not in  MT4 platform. It  also provides  the option of displaying or not a Mov. Avg. as a Signal   Line and the resulting Signals as Arrows in a Normal (all arrows) or in a Reverse Mode (without showing up any resulting successive and of same type arrows). Analytically for each one of the specific Oscillators: The Chaikin Oscillator ( CHO )   is
      FREE
      BeST Darvas Boxes MT5
      Eleni Koulocheri
      3 (1)
      BeST_Darvas Boxes is a Metatrader Indicator based on the trading method developed in the 50’s by the Hungarian Nicolas Darvas . BeST_Darvas Boxes indicator draws the Top and the Bottom of every Darvas Box that can be confirmed on the current Chart draws Buy and Sell Arrows for every confirmed Upwards or Downwards Breakout of the above levels draws always only after the bar closing and so is non-repainting or backpainting it can be used as a standalone trading system/method Inputs Basic Sett
      BeST_Hull MAs Directional Strategy is a Metatrader Indicator based on the corresponding Hull Moving Average.It timely locates the most likely points for Entering the Market as well as the most suitable Exit points and can be used either as a standalone Trading System or as an add-on to any Trading System for finding/confirming the most appropriate Entry or Exit points. This indicator does use only the directional slope and its turning points of Hull MAs to locate the Entry/Exit points while it a
      BeST_ Elliot Wave Oscillator Strategies is an MT5 indicator which by default is the difference of two SMAs displayed as a histogram fluctuating around zero while a Signal Line generates Entry Signals either in a Reverse or in a Normal Mode and it is a very powerful tool that very often exploits huge market movements. Signal Line comes in 2 types: Advanced Get Type – like the corresponding one used in the homonym analysis package Mov. Average Type – as a Moving Average of the Elliot Oscillat
      BeST_Hull MAvgs Strategies_EA is an MT4 Expert Advisor based on the Market indicator named  BeST_Hull MAs Directional Strategy  and can make trades according to it or using only 1 HMA while it also applies all common Trade and Risk Management features. Generally the Hull Moving Average (HMA - developed by Alan Hull) is a directional trend indicator. It captures the current state of the market and uses recent price action to determine if conditions are bullish or bearish relative to historical d
      BeST Breakout Strategy
      Eleni Koulocheri
      5 (1)
      BeST_Breakout Strategy is a Metatrader Indicator based on a proprietary algorithm implementing a very powerful tool that can exploit every breakout leading to huge market movements. It timely locates the most likely points for Entering the Market as well as the most suitable Exit points and can be used successfully as a standalone Trading System which often results in huge profits accompanied by very impressive statistics like Success Ratio and Profit Factor.  The BeST_Breakout Strategy is
      BeST Chande RAVI
      Eleni Koulocheri
      5 (1)
      BeST_Chande RAVI (Range Action Verification Index) is an MT4 Indicator that is based on the corresponding indicator developed by Tushar Chande which is mainly based on market momentum while focuses on identifying ranging and trending markets. By default RAVI is defined by the formula:  RAVI = Absolute value (100 x (SMA(7) – SMA(65)). Also by default there is an arbitrary reference level of 3% that means a market is ranging if the RAVI is less than 3%, or trending strongly if it is is greater t
      FREE
      BeST_ Classic Pivot Points is an MT4 Indicator that is based on the widely known and definitely classic Pivot Point of a market prices activity. A pivot point is calculated as an average of significant prices (high,low,close) from the performance of a market in the prior trading period. If the market in the following period trades above the pivot point it is usually evaluated as a bullish sentiment, whereas trading below the pivot point is seen as bearish. A pivot point and the associated suppo
      FREE
      Variable Index Dynamic Average (VIDYA) developed by Tushar Chande  by default is contained in MT5 but not in MT4 platform and it is a dynamic EMA (Exponential Moving Average) that adjusts its Length (LB Period) automatically in response to Market Volatility originally measured through the Chande Momentum Oscillator(CMO). CMO value is used as the ratio to the smoothing factor of EMA ( The New Technical Trader by Tushar Chande and Stanley Kroll, John Wiley and Sons, New York, 1994). The higher th
      FREE
      BeST_Vervoort Zero Lagging MAs Strategy EA - MT5   is an Expert Advisor that is based on the corresponding MT5 BeST_Indicator which can simulate S.Vervoort's work about Reliable and of Zero Lag  MAs Crossovers as described in his  article  in TASC_05/2008 titled  “The Quest For Reliable Crossovers”. According to the article this method is clearly a Breakthrough Answer for Trading Moving Averages and Finding Fast and Remarkable Reliable Crossovers. Based on this logic this EA can make BUY and SE
      BeST TEMA
      Eleni Koulocheri
      Triple Exponential Moving Average ( TEMA ) is a  moving   average (MA) that gives the  most weight to recent price data. TEMA is more reactive to  all price fluctuations than  a Simple Moving Average (SMA) or an Exponential Moving Average (EMA) or even a Double Moving Average (DEMA) and surely can help traders to spot reversals sooner because it responds very fast to any changes in market activity.  TEMA was developed by Patrick Mulloy in an attempt to reduce the amount of lag time found in trad
      FREE
      BeST 123 Startegy
      Eleni Koulocheri
      5 (1)
      BeST_123 Strategy is clearly based on the 123_Pattern which is a frequent Reversal Chart Pattern of a very high Success Ratio . It occurs at the end of trends and swings and it’s a serious indication of high probability for a change in trend. Theoretically an 123_pattern is valid when the price closes beyond the level of #2 local top/bottom, a moment when the indicator draws an Entry Arrow,  raises an Alert and a corresponding Position can be opened. The BeST 123_Strategy Indicator is non-repai
      BeST_Chande TrendScore Indicator  points the start of a trend with high degree of  accuracy and it is amazing for scalping on the 1min timeframe. It is also a   simple way to rate trend strength. It indicates both the direction and strength  of a trend and can be easily combined with various trend-following, swing and scalping strategies. As of a trend’s direction and strength a value of +10 signals a strong uptrend while a value of -10 signals a strong downtrend. Generally a positive score show
      BeST_ADX Scalping Strategy is an MT4 Strategy of an Entry and Exit Signals Indicator based on the ADX values that is an excellent tool for scalpers to scalp the currency market multiple times a day for profit . It is built mainly for scalping purposes although it can also be used as a breakout indicator . Its Signals produce a complete and standalone trading system of impressive results . The indicator comes with a new enhanced Real Time Updated Info and Statistics Panel that can improve its ov
      BeST_Fisher Oscillator Strategies is an MT4 Indicator that is based on the popular Fisher Indicator and it is mainly used to identify trend reversals with a high accuracy .  It is a great forex trading indicator for scalping , day trading and swing trading purposes. The indicator comes with 2 corresponding Strategies of Reversed Entries each one of which can be used either as a standalone Trading System or as an add-on to any Trading System for finding or confirming the most appropriate Entry o
      BeST Trend Exploiter MT5
      Eleni Koulocheri
      5 (1)
      BeST_Trend Exploiter  is a Metatrader Indicator  based on a smart proprietary algorithm which can detect the market Median Trend while it filters out the noise providing Buy and Sell Signals and also wherever it is applicable it provides us with TP Levels of High Probability. Additionally as it has Built Inside all the necessary features it can be used as a Complete Strategy of very Impressive Results. Essential Advantages of the Indicator Clear and Easily Understandable trading rules. Real
      BeST DEMA
      Eleni Koulocheri
      4 (3)
      Double Exponential Moving Average ( DEMA ) is a moving  average (MA) that gives the most weight to recent price data.Like exponential moving average (EMA), it is more reactive to all price fluctuations than a simple moving average (SMA) and so DEMA can help traders to spot reversals sooner, because it is faster responding to any changes in market activity. DEMA was developed by Patrick Mulloy in an attempt to reduce the amount of lag time found in traditional MAs. ( TASC_Feb. 1994 ). DEMA can al
      FREE
      BeST 123 Startegy MT5
      Eleni Koulocheri
      3.67 (3)
      BeST_123 Strategy is clearly based on the 123 Pattern which is a frequent Reversal Chart Pattern of a very high Success Ratio .It occurs at the end of trends and swings and it’s a serious indication of high probability for a change in trend.Theoretically an 123_pattern is valid when the price closes beyond the level of #2 local top/bottom, a moment when the indicator draws an Entry Arrow, raises an Alert, and a corresponding Position can be opened. The BeST 123_Strategy Indicator is non-repai
      BeST_Hull MAs Directional Strategy is a Metatrader Indicator based on the corresponding Hull Moving Average.It timely locates the most likely points for Entering the Market as well as the most suitable Exit points and can be used either as a standalone Trading System or as an add-on to any Trading System for finding/confirming the most appropriate Entry or Exit points. This indicator does use only the directional slope and its turning points of Hull MAs to locate the Entry/Exit points while it
      BeST_Fibonacci Retracement Lines is an MT4 Indicator that by default is based on common  Fibonacci levels but it can also draw any 3 desired levels of Retracement or Support of a trending move. It can be used to identify pullback points but also additionally as a kind of a Trailing Stop . BeST_Fibonacci Retracement Lines indicator: • by default draws 38.2%, 50% and 61.8% Retracement Levels of the current price move defined using the Highest High (HH) and Lowest Low (LL) of a desired Look Back Pe
      BeST_Visual MAs Signal Generator  MT4 Indicator is a very  useful Visual Tool that can display in the Chart all ENTRY signals (BUY and SELL) and also any corresponding EXIT signal, based on a total of 12, common but also different trading strategies, in which the Entry and Exit Signals are derived exclusively by using Moving Averages (MAs). The two main groups of MAs Strategies included in this tool are: A) Crossover Signals This group includes 4 different strategies (A1-A4), where Entry and Exi
      BeST_Keltner  Channels Variations & Strategies   is an   MT4  Indicator based on the original  Keltner Channels Technical Analysis Indicator and it is a very useful Visual Tool that can display in the Chart all the known Variations of Keltener Channels and also the corresponding 10 totally Strategies   i.e. all ENTRY signals (BUY and SELL) and also any corresponding EXIT signal, in which the Enrty and Exit Signals are derived exclusively by using Keltner Channels Variations. Every variation of K
      BeST Trend Scanner
      Eleni Koulocheri
      BeST_Trend  Scanner is an MT4 Indicator that uses a proprietary algorithm   in order to identify the most likely levels and probable moment for an upside  or a downside trending price move. BeST_Trend  Scanner is a very useful tool that defines in advance and with a high statistical percentage of accuracy the subsequent Resistance & Support Levels of the anticipated upside or downside trending move of price and so When used at its Reverse Entries Mode : It generates Buy or Sell arrows at the
      All those involved in trading do certainly know that Moving Average Crossovers for being tradable should be reliable and also they need to have minimal lag. BeST_Vervoort Zero Lagging MAs Strategy is a Metatrader Indicator that can help you to achieve it and is based on S.Vervoort's work about Reliable and of Zero Lag MAs Crossovers as described in his TASC_05/2008 article " The Quest For Reliable Crossovers ". It's a Multipotentiality Indicator as it can display of either simply the Zero Laggi
      BeST Trend Exploiter
      Eleni Koulocheri
      5 (4)
      BeST_Trend Exploiter is a Metatrader Indicator  based on a smart proprietary algorithm which can detect the market Median Trend while it filters out the noise providing Buy and Sell Signals and also wherever it is applicable it provides us with TP Levels of High Probability. Additionally as it has Built Inside all the necessary features it can be used as a Complete Strategy of very Impressive Results. Essential Advantages of the Indicator Clear and Easily Understandable trading rules. Real Time
      필터:
      리뷰 없음
      리뷰 답변