• 미리보기
  • 리뷰 (38)
  • 코멘트 (80)
  • 새 소식

Trading box Technical analysis

5

Summer 40% discount ($149 -> $88)

Everything for chart Technical Analysis indicator mt4 in one tool

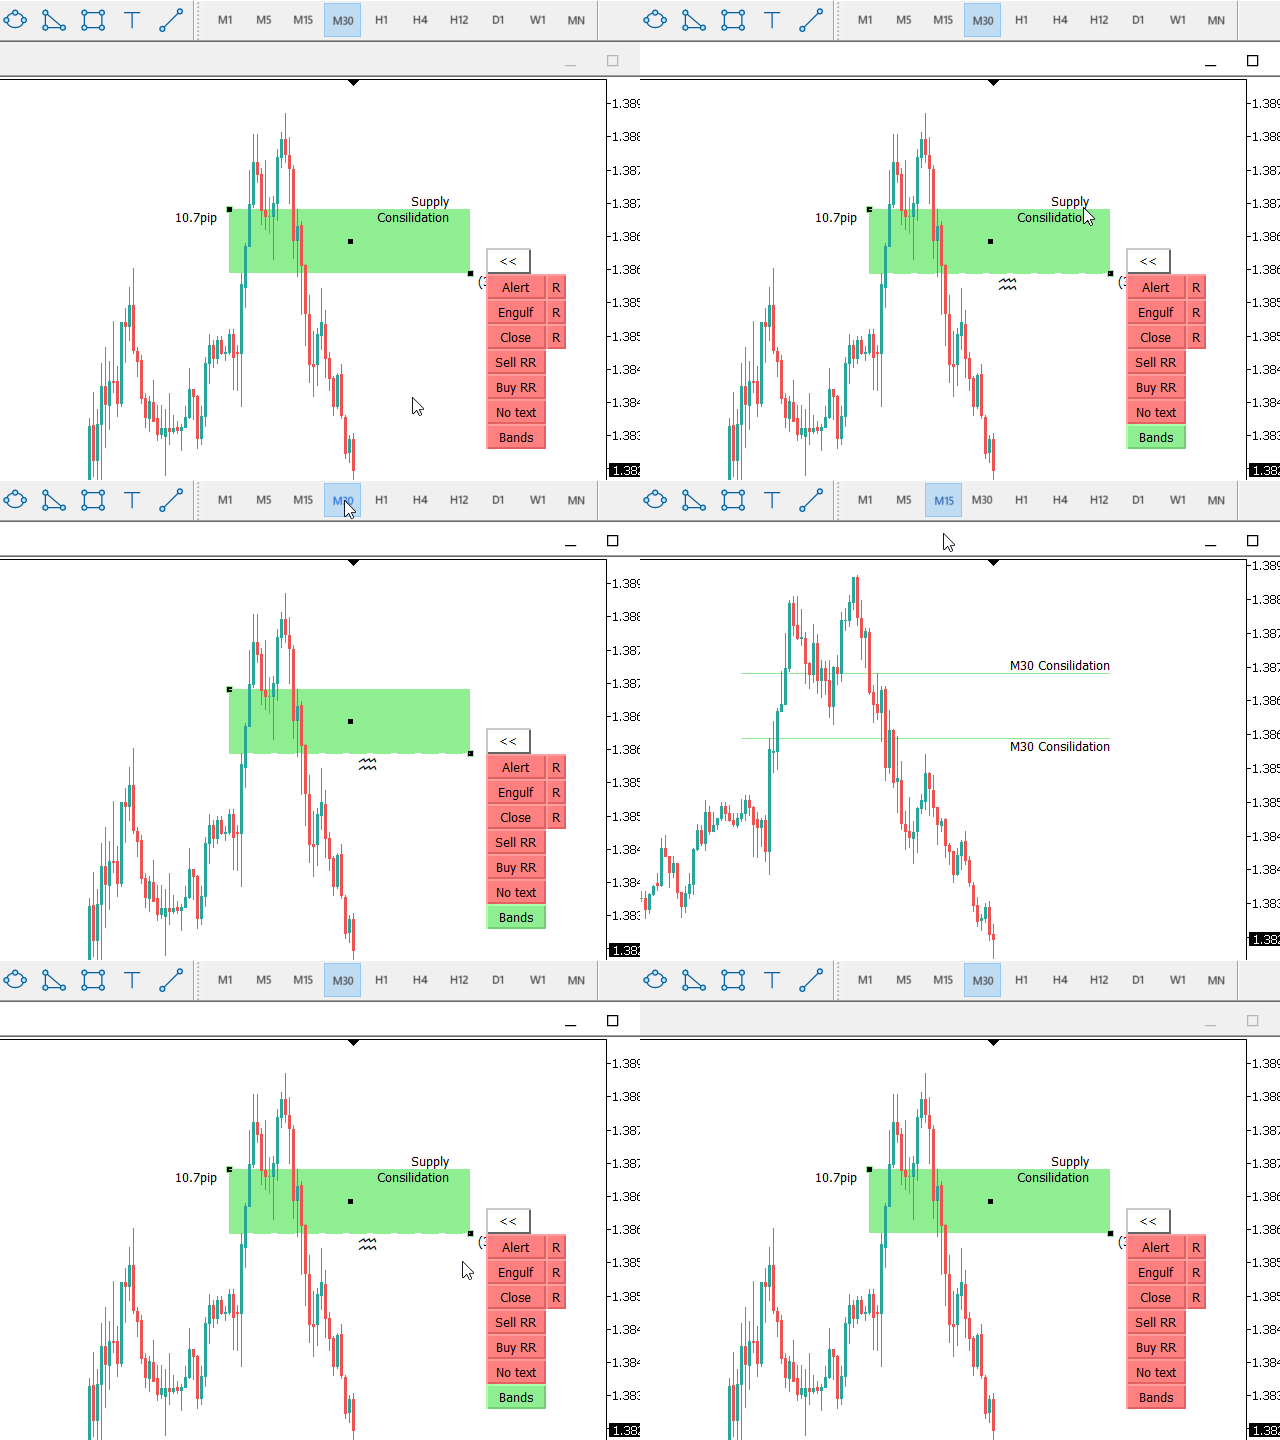
Draw your supply demand zone with rectangle and support resistance with trendline and get alerts to mobile phone or email alert - Risk reward indicator

Video tutorials, manuals, DEMO download hereFind contacts on my profile.


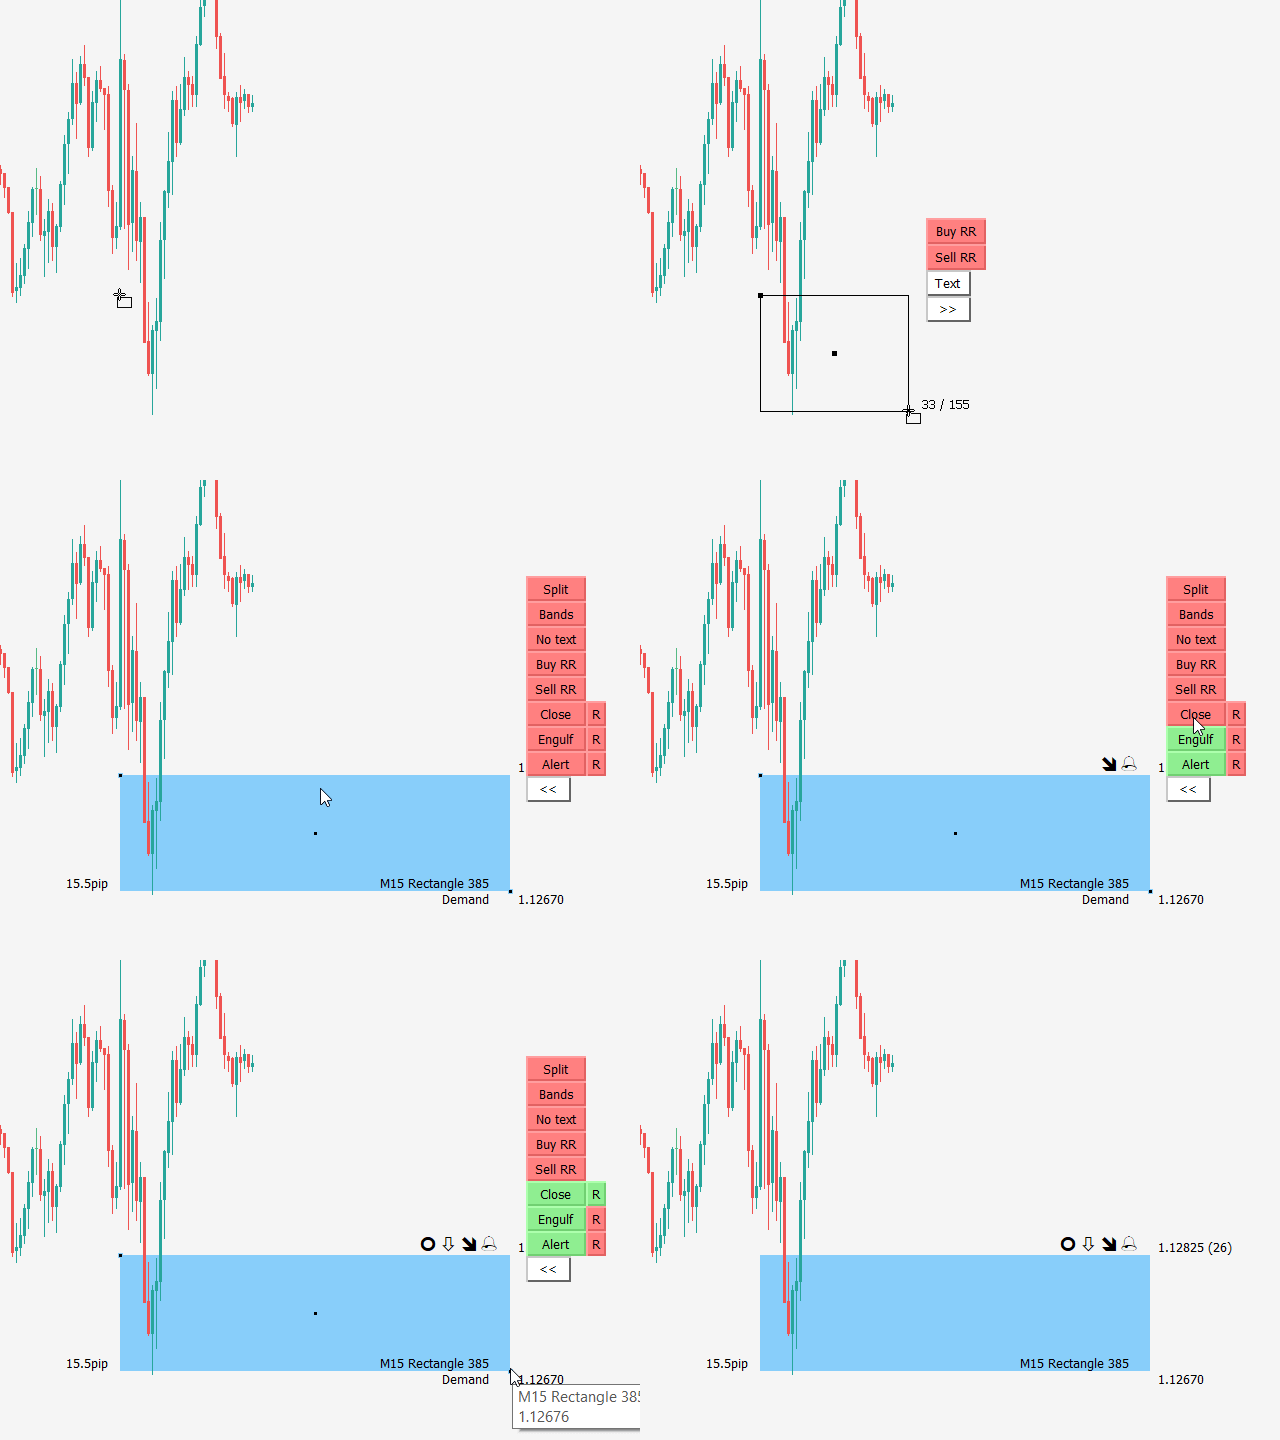
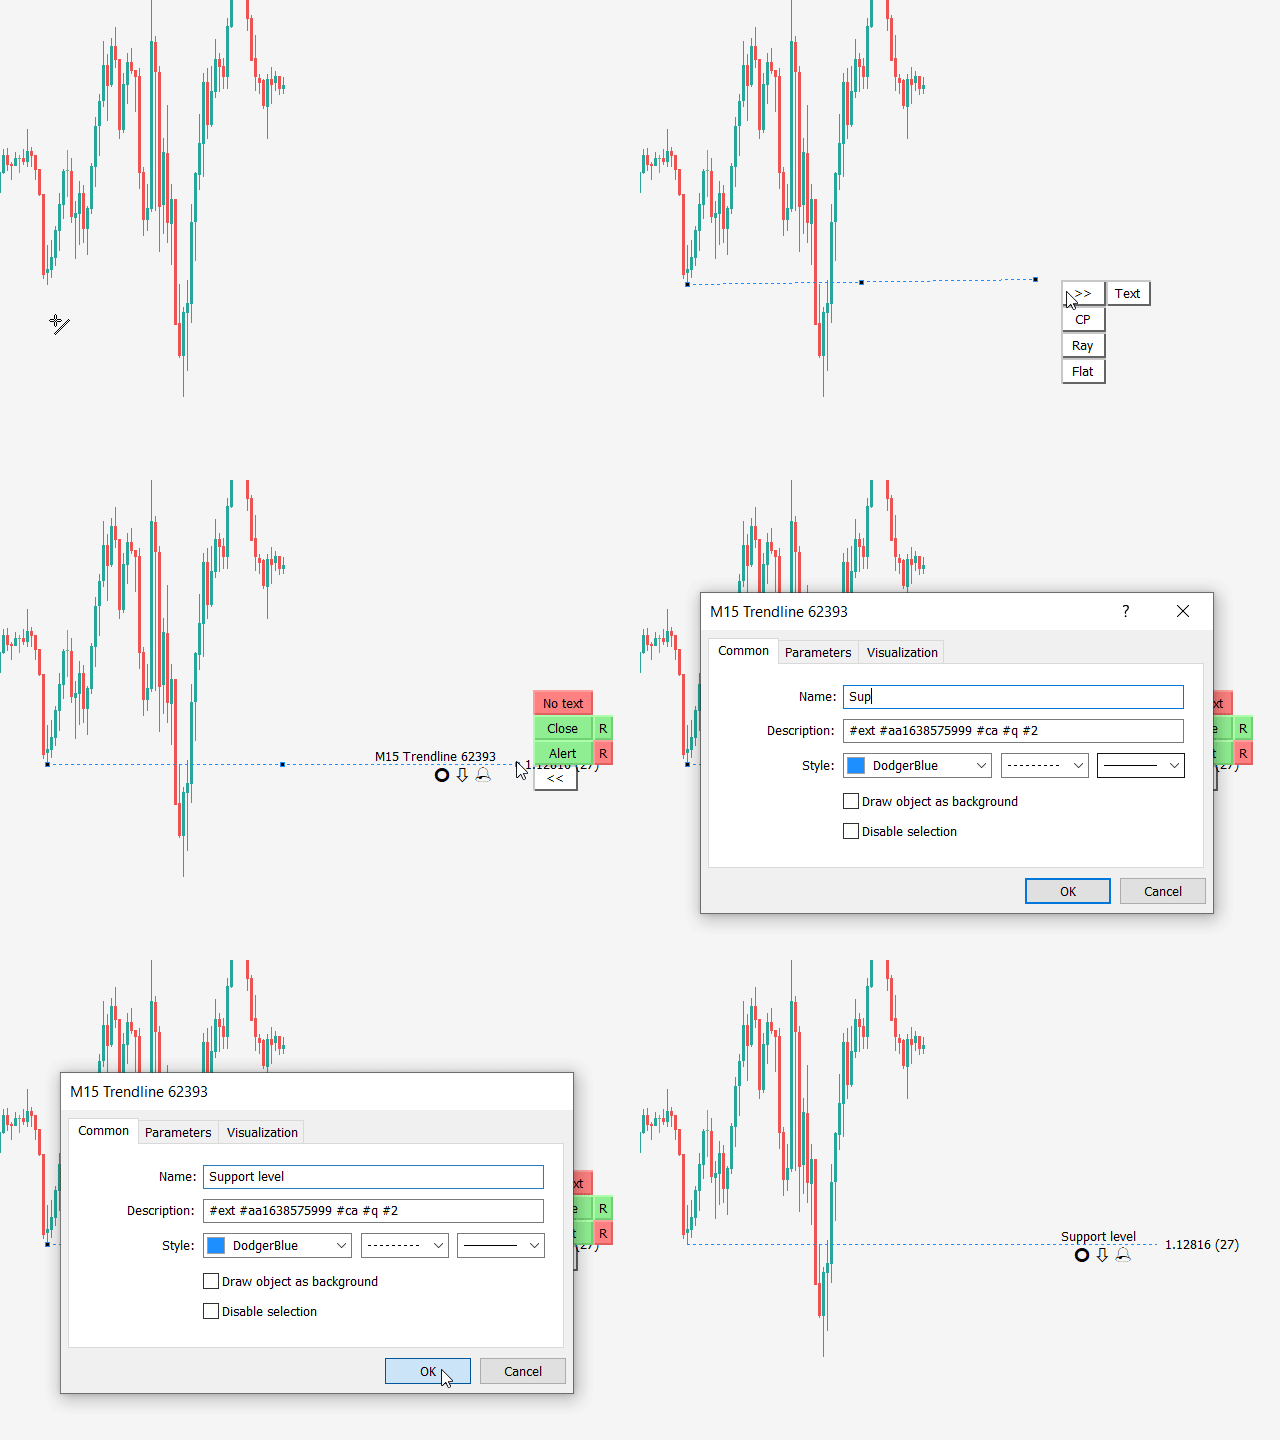
1. Extended rectangles and trendlines

Object will be extended to the right edge of the chart when price will draw new candles on chart. This is rectangle extender or trendline extender.

2. Price touch alert

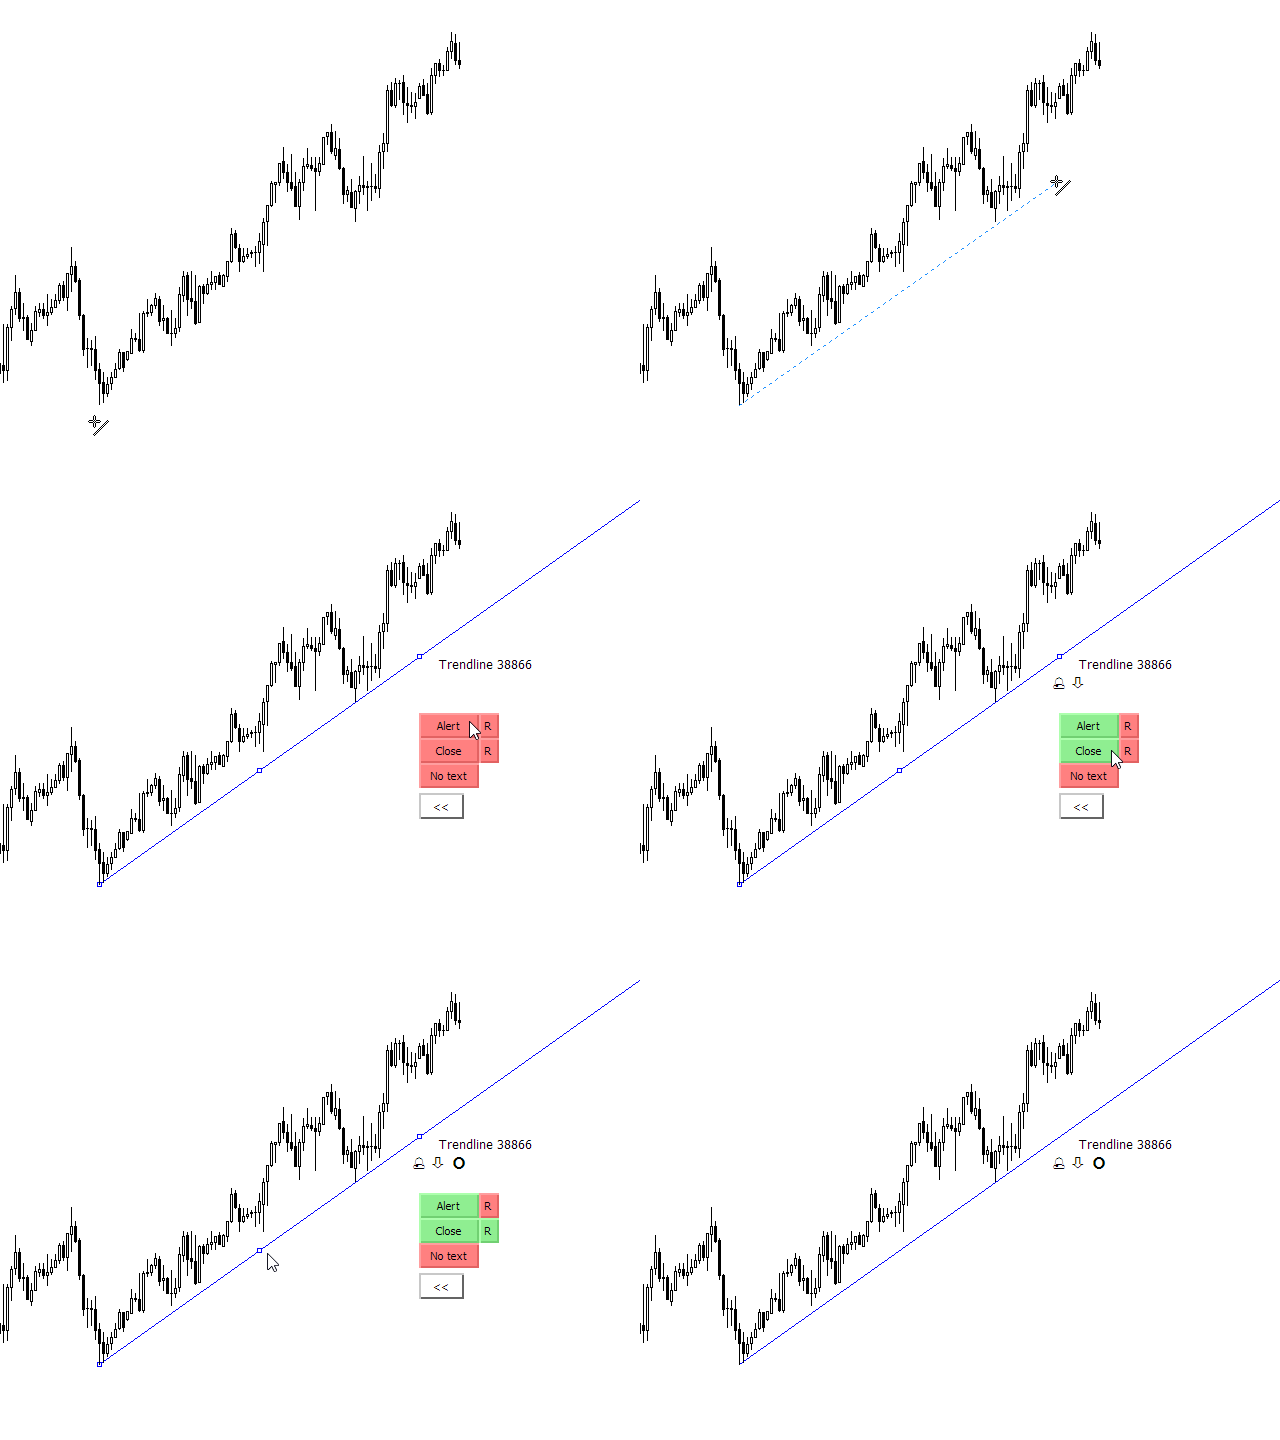
  1. Alert will be triggered when price will touch extended rectangle or extended trendline
  2. Trendline alert is also available for rayed angled trendline
  3. Alerts can be sent to mobile push notification, email and MetaTrader popup alert

3. Engulf alert

Alert will be triggered when price will break rectangle supply demand zone

4. Candle Close alert
Alert will be triggered when candle will close outside of the rectangle or trendline
    5. Trendline Retest alert

    Button "Retest" is used for breakout and retest strategy. Breakout Retest triggers an alert if the candle closes beyond trendline and then price touches trendline for retest

    6. Sound repeat after Alert, Engulf, Close, Retest

    R button will enable you repeat alert sound every few seconds. Audible alert, text alert

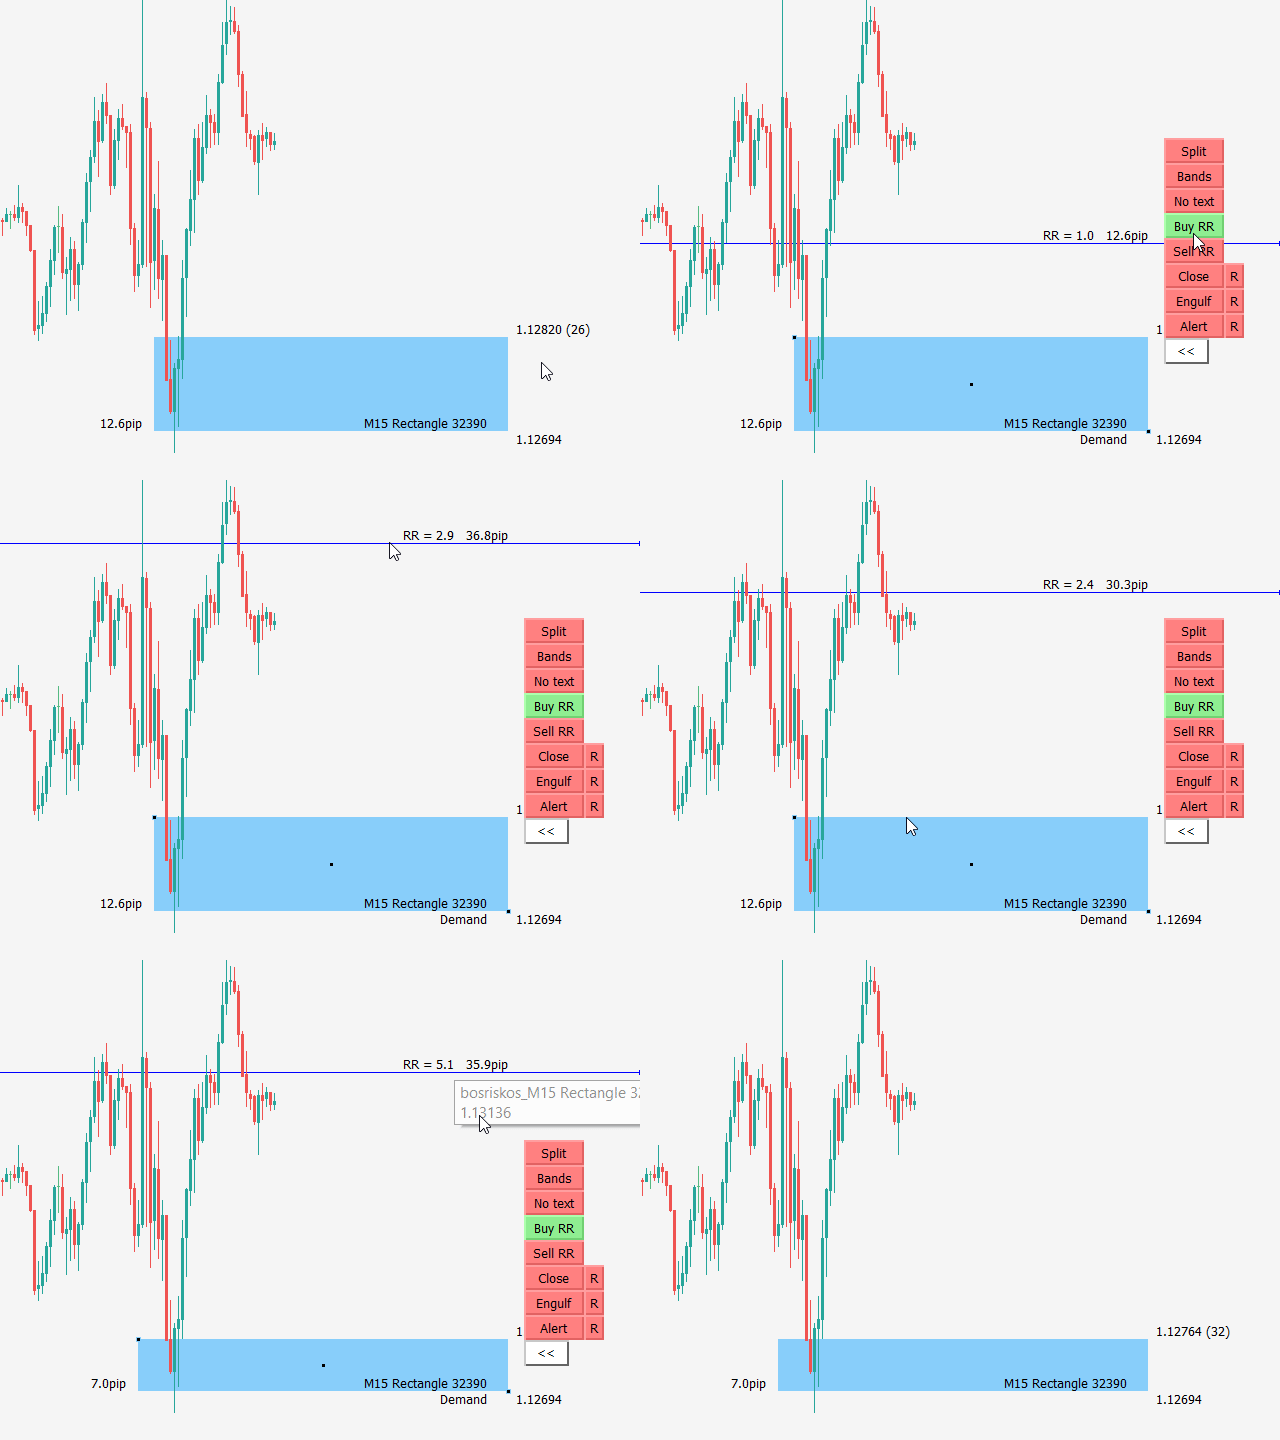
    7. Risk reward ratio calculation tool

    Risk reward ratio calculation for rectangles

    8. Color change buttons

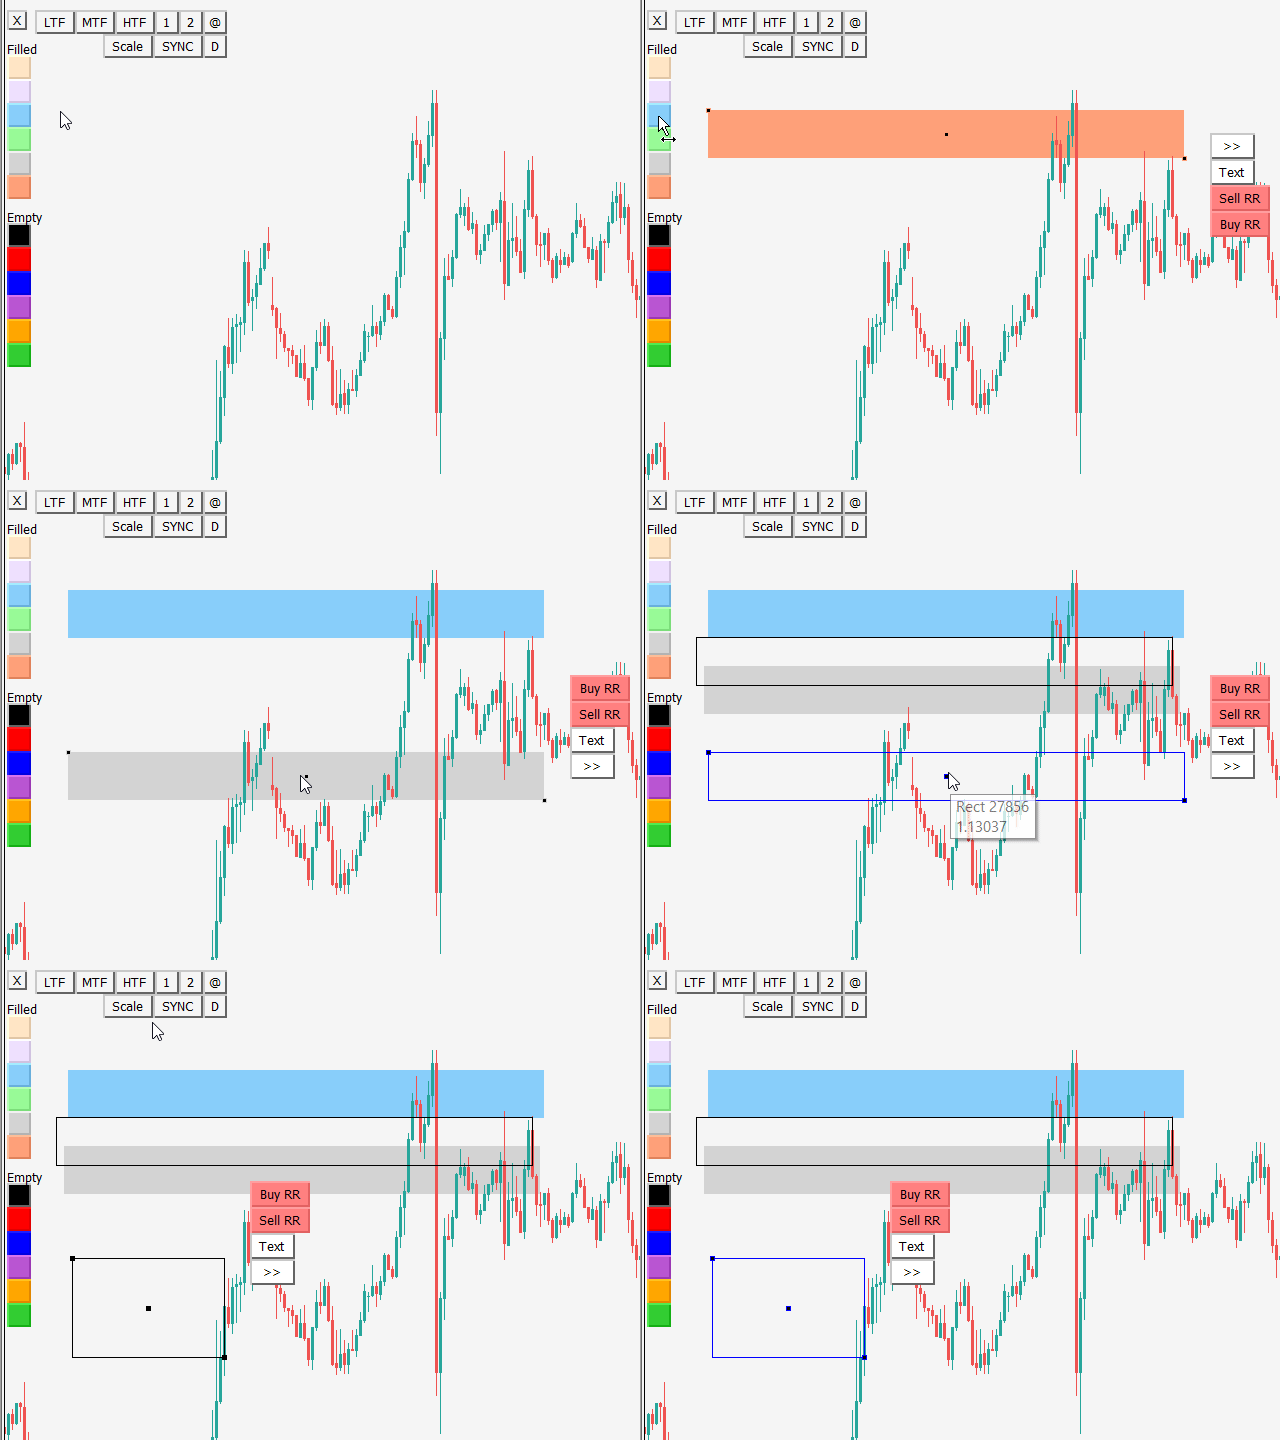
    Quickly change color for selected object with color button click. If no object is selected then color buttons will create a new rectangle

    9. Text button - object name text position

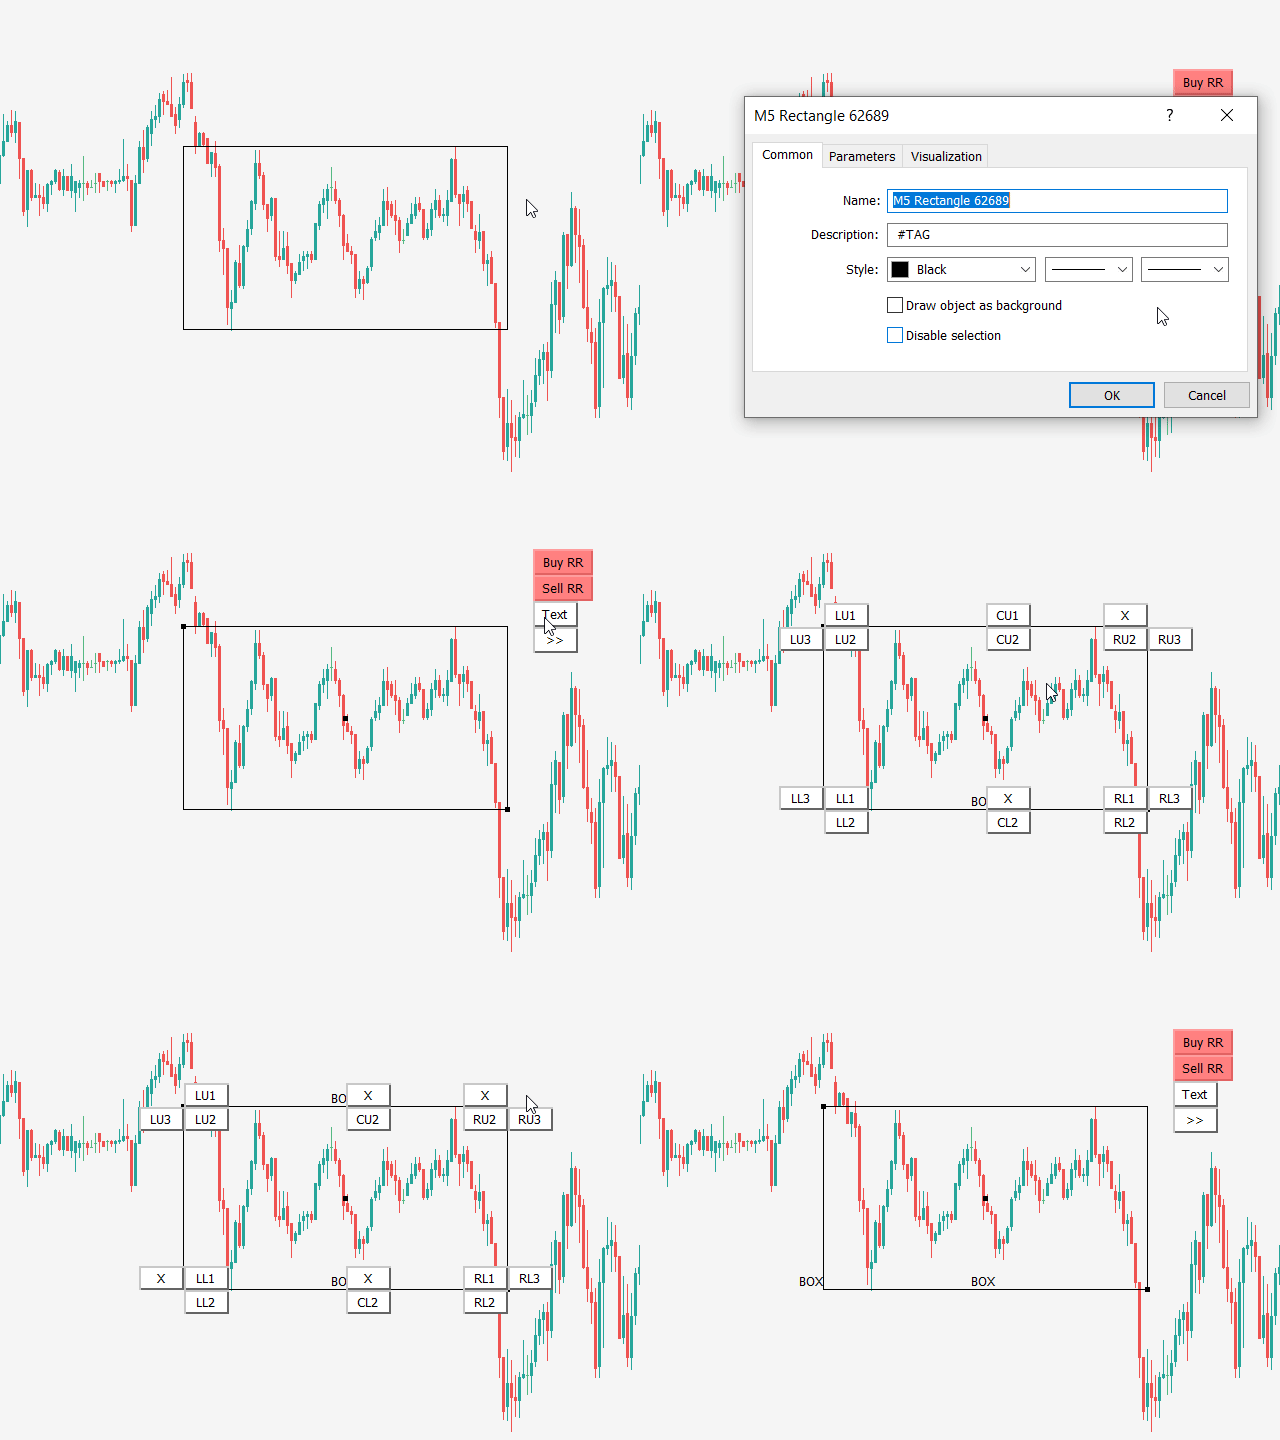
    Display rectangle or trendline text in all possible spots around or inside object. This works for non-extended rectangles and trendlines

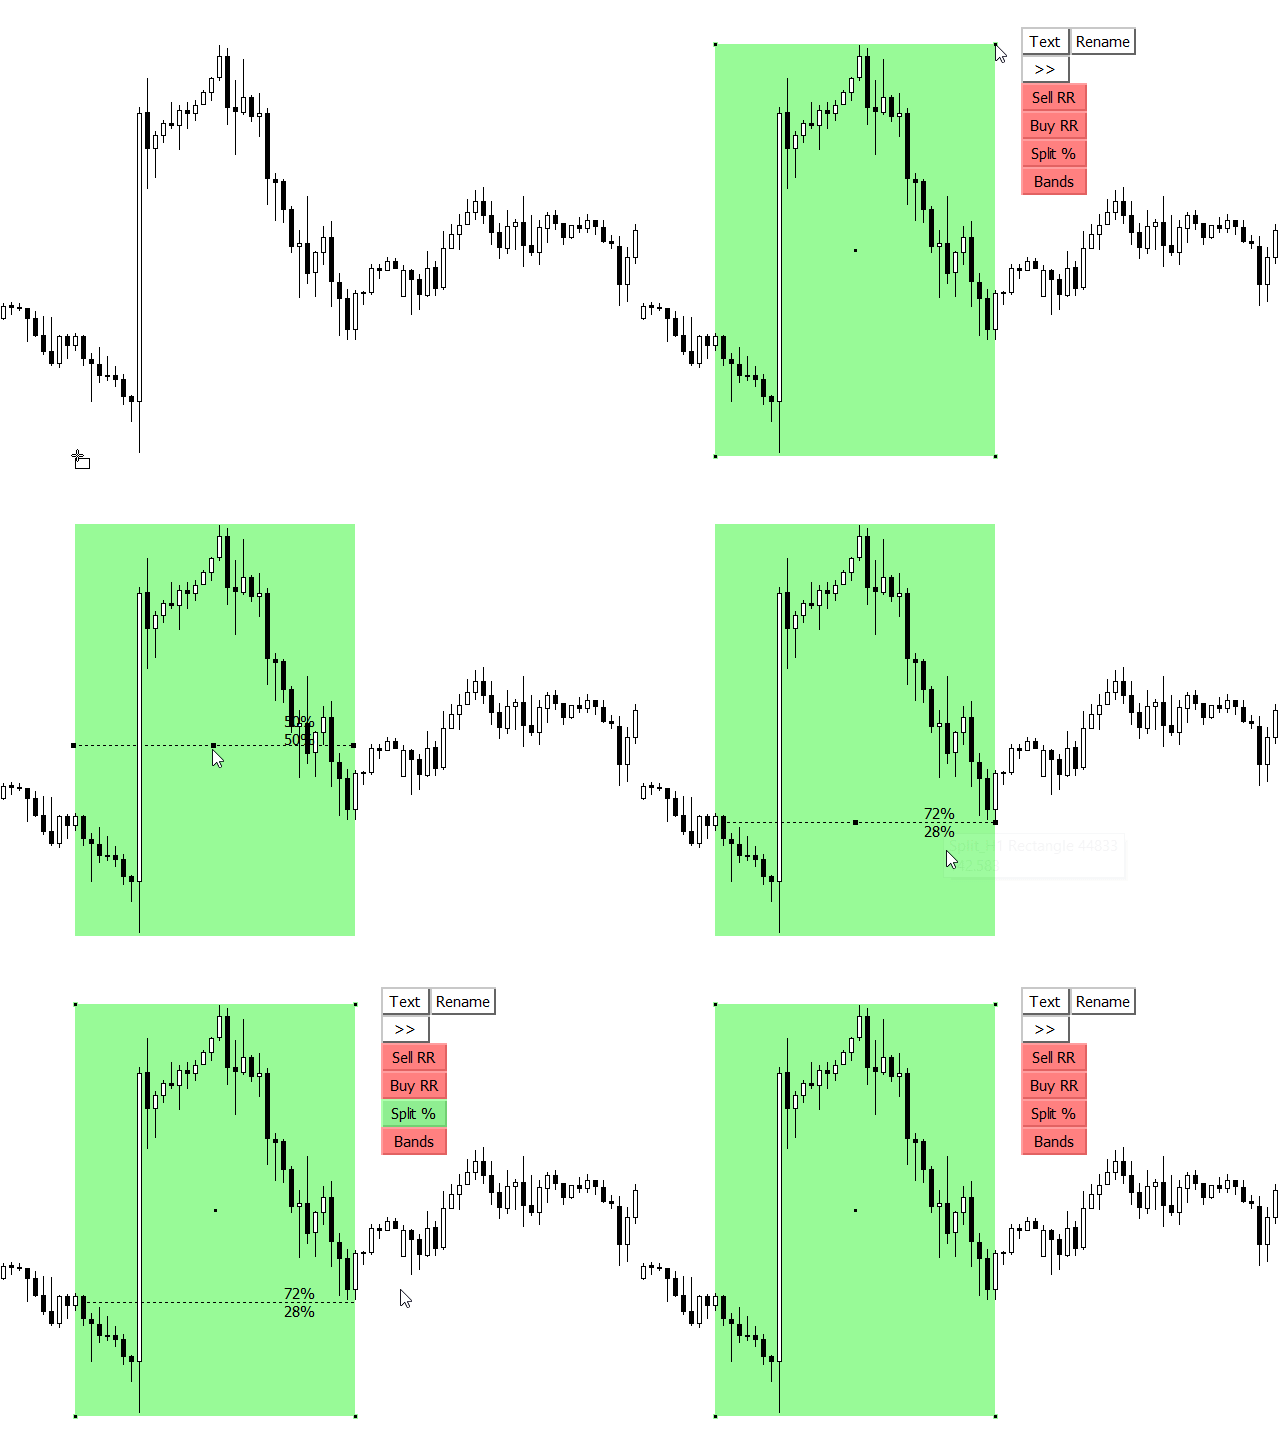
    10. Rectangle Split with % trendline

    Rectangle will be split with extended trendline by 50% of rectangle height. When you move split trendline, then % (percentage) will recalculate

    11. Rectangle Fibonacci retracement tool

    Non-extended rectangle have option to split by % and give option to see discount or premium price of the rectangle

    12. Trendline compression tool and Flat trendline button

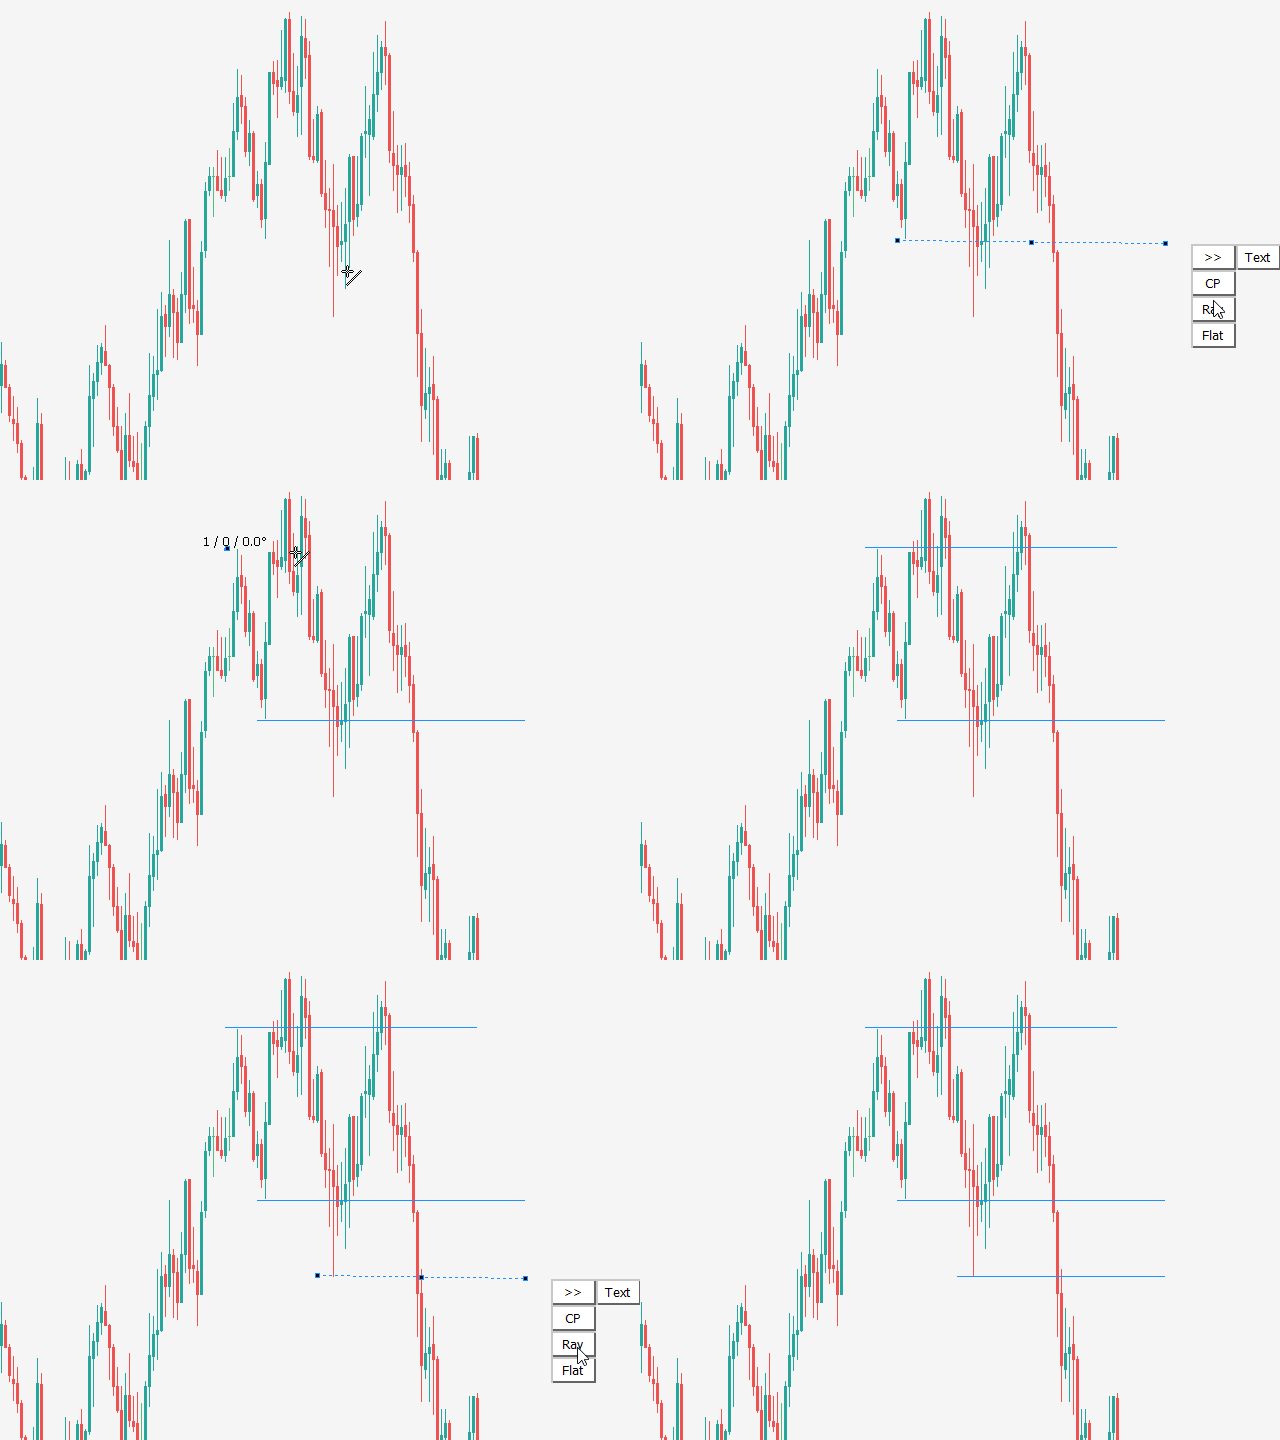
    Mark compression zone on the chart, like price action zone. If you click on Flat button then trendline will become horizontal flat

    13. Chart synchronization - chart sync object

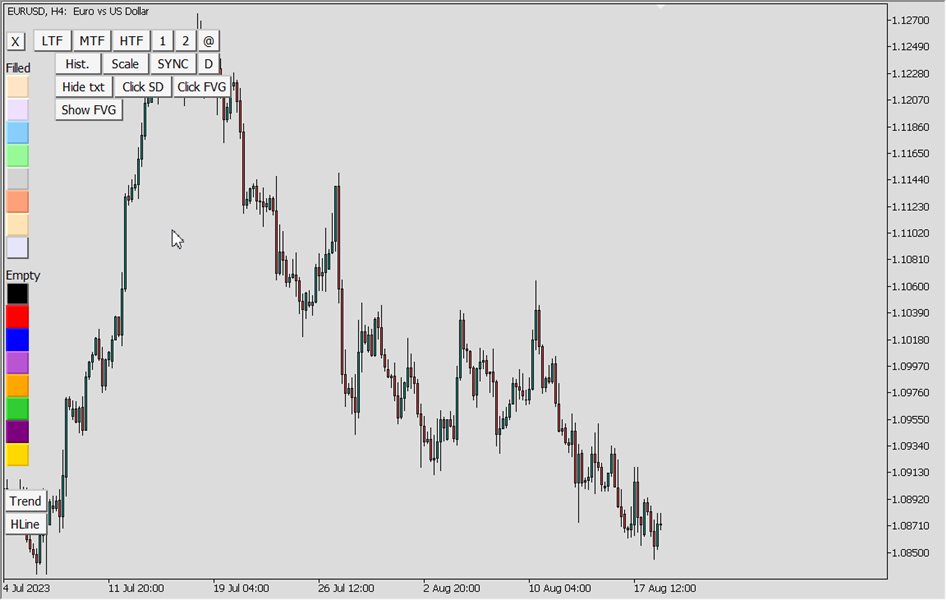
    "SYNC" button function for rectangle, trendline, horizontal line, vertical line and Fibonacci retracement of the same symbol

    14. Multiple timeframes analysis with nested zones  

    Bands button will create top and bottom rectangle lines visible on all TF but filled rectangle will be visible only on current TF. This will help you to see HTF levels on lower timeframes

    15. Auto scale TF visibility for newly created rectangle & trendline 

    This function will set timeframe visibility for current and lower timeframes. This will give bigger importance to objects on higher timeframes

    16. Object timeframe visibility buttons

    Set object timeframe visibility with LTF, MTF and HTF buttons

    17. Navigate chart to Rectangle origin position focus

    Function that will show origin of selected rectangle in the middle of the chart when button @ is clicked

    18. Horizontal break line price

    Function will search first horizontal line break in chart history on the left

    19. Hist. button

    History button that will show the time of last alert in the label. Information is transferred to Technical analysis dashboard where you can see last alerts of all charts in one list

    20. Rename the rectangle and trendline from the suggested list

    Button Rename gives options to rename the rectangles and trendlines from the suggested list

    21. Time Frame colors for new created objects

    User can define special color for each standard time frame

    22. Candle click to create SD zone

    Button Click SD with ON//OFF logic for extended rectangle creation when user click on candle. Zone is based on candle High and Low price

    23. Fair Value Gaps (ICT FVG indicator)

    Button Click FVG with ON//OFF logic for extended rectangle creation when user click on Fair Value Gap zone candle

    24. Button to show ALL Fair Value Gaps

    Show all fair value gaps on chart with Show FVG button

    Input settings:

    • Show FVG - Search bars in history (0 = default)
    • Show FVG rectangle color - Untouched/Untested
    • Show FVG rectangle color - Touched/Tested

    25. Hotkeys for drawing Support Resistance levels and Supply Demand zones

    Last clicked candle Hotkeys for Support and Resistance levels (extended trendline):

    • H - High
    • L - Low
    • O - Open
    • C - Close

    Last clicked candle Hotkeys for Supply and Demand zones (extended rectangle):

    • S - Supply zone
    • D - Demand zone
    • F - Fair Value Gap
    X - Show/hide TBTA buttons
    W - Show FVG
    Q - Chart Scale
    1 - Line thickness
    2 - Line thickness
    3 - LTF
    4 - MTF
    5 - HTF
    A - @ (Move chart to selected object Time1)
    E - Extend/unextend selected trendline or rectangle


    리뷰 20
    ionut_34
    169
    ionut_34 2023.12.01 20:55 
     

    since i have this tool i don't use tradingview anymore, it has everything you need.

    riad mansee
    25
    riad mansee 2023.10.16 22:58 
     

    I purchased this product and when I changed the platform it no longer worked why ?

    01.dcalantes
    72
    01.dcalantes 2023.09.20 22:12 
     

    This indicator being an MT4 add on that provides it almost a TradingView level of power isn't just hype. A rectangle with a built in Fib level (Split %), RR tool, adding in text, text placement, alerts (for both rectangle and lines)... I was in search of a tool for MT4 to do JUST EVERY SINGLE THING I DO ON TRADINGVIEW. And this delivered all I needed. This tool almost instantly made me fall in love with my MT4 mark ups once again. There's a lot of moving parts, sure, and it might take a while to get used to it, but good thing is the author made a tutorial video to walk me through each function. Amazing. I can see myself using this indicator for as long as I trade. Thank you for creating this masterpiece.

    추천 제품
    Demark mtf
    Sergey Fionin
    The indicator shows De Mark patterns and gives trading signals in the form of arrows and alerts. Shows De Mark lines on the history of quotes. Has a multiframe., Can show DeMark patterns of higher timeframes on lower timeframes. Has a switchable function for displaying fractals. Trading signals are accompanied by sound alerts, as well as sending them to mail and mobile devices.
    WhaleFinder MT4
    Kazuya Yamaoka
    Considering the main theories of Forex (Dow Theory, support lines, chart patterns, and Fibonacci retracements), It tells you the price range where whales (large investors) are likely to appear. You can trade at the price points that professionals also aim for. You no longer have to warry about where to aim next. We are live-streaming the actual operation of the system. Please check for yourself if it is usable. Please check it out for yourself. https://www.youtube.com/@ganesha_forex We do no
    The Find Levels utility scans the range of prices and bars indicated by you on the chart, finds the levels most often related to High and Low prices and provides a full report. The color of the level line depends on the number of touches and changes in the program settings. The level is drawn in the event that if the shadow of the High or Low candle was at least two touches during the period specified in the parameters. The characteristics of the candle, namely, what should be its parameters for
    Title: BBMA Structure Guide - BBMA Structure Guide Description: BBMA Structure Guide is a specialized MQL4 indicator designed to help traders understand the journey of BBMA structure more easily and efficiently. BBMA, or "Bollinger Bands Moving Average," is known for its motto "One Step Ahead," highlighting the importance of understanding market structure in depth. With BBMA Structure Guide, you can quickly identify the underlying market structure patterns that drive price movements. This w
    Description  Fibo Retracement  is an indicator that automatically plots  Fibonacci  levels in the main chart based on Close prices , which distinguishes it from the Fibo Levels indicator that plots levels based on High/Low prices. Thus, using both indicators provides the trader with the opportunity of determining support and resistance zones by Fibonacci! The levels are calculated and plotted over a certain interval using the number of bars specified by the user. The user can display Fibonacci l
    Fibo Linear Channel
    Igor Semyonov
    4 (1)
    Colored indicator of the linear channel based on the Fibonacci sequence. It is used for making trading decisions and analyzing market sentiment. The channel boundaries represent strong support/resistance levels, as they are the Fibonacci proportion levels. Users can select the number of displayed lines of channel boundaries on the chart by means of the input parameters. Attaching multiple instances of the indicator to the chart with different calculation periods leads to displaying a system of c
    About: A Fibonacci indicator is best used with other indicators like Pivots, Support/Resistance etc. Price tends to use Fibo levels as Support or Resistance lines. So, this indicator is very useful to know when price might reverse or if a level is crossed, price might continue the trend. Also, to find the best Take Profit and StopLoss lines. Don't use Fibo Indicator alone for trading as it might not always be accurate. Use it to make your strategies better as a supporting indicator. Settings:
    FREE
    Pisces TheProfitZone
    Nuttawut Khiawkiri
    Pisces TheProfitZone "Pisces TheProfitZone MT4 Indicator Powered byFxGangster" This indicator will calculate new support and resistant zone everyday, and that give us a trading zone such as thats telling us TP and SL, So it still telling us for where should the price will go reach? Fore Example. Uptrend : If Price can stay upper a Line and price close higher above a Line, then the price will continue go up to reach next Line. Downtrend : If Price can't pass to stay upper a Line and the pr
    The indicator draws trend lines based on Thomas Demark algorithm. It draws lines from different timeframes on one chart. The timeframes can be higher than or equal to the timeframe of the chart, on which the indicator is used. The indicator considers breakthrough qualifiers (if the conditions are met, an additional symbol appears in the place of the breakthrough) and draws approximate targets (target line above/below the current prices) according to Demark algorithm. Recommended timeframes for t
    F ully automated Expert Advisor using the  advanced   algorithm for trading the EURUSD Designed for profit in a short period of time and big profit in a long run. Prefers EURUSD 1H. Principle of operation The SELL and BUY orders are opened (depending on the parameters set), guided by signals and the market situation.     Recommended parameter: Use an ECN broker account. minimum deposit of 100$ USD. use it in H1 time frame recommended symbol is EURUSD input parameter: TrendType               
    Chart Projection
    Lorentzos Roussos
    4.61 (57)
    차트 투영 표시기 채널에 가입하고 , 리뷰를 작성하고, YouTube를 구독하고 , 동영상에 좋아요를 누르세요. 감사합니다 차트 프로젝션은 내장된 지그재그 기술 지표를 사용하여 미래 가격 조치를 예측하는 작은 지표로 시작되었습니다(코멘트에서 이전 알고리즘을 찾을 수 있음) 아이디어는 간단합니다. 과거 가격 조치가 미래로 이어지지는 않지만 지나치게 구체적이지 않거나 지나치게 일반적이지 않은 경우 발생할 수 있는 일에 대한 지침을 추출할 수 있습니다. 차트 투영의 "테제"는 다음과 같습니다. 거래자는 차트를 보고 결정을 내리므로 알고리즘도 차트를 볼 수 있습니다. 지표 값을 읽지 않고 가격을 읽지 않고 차트를 봅니다. 무언가를 찾는 것은 반복되는 친숙한 패턴을 찾는 것입니다. 그리고 , 그 익숙한 패턴을 찾으려면 저장해야 합니다. 지그재그로는 충분하지 않았고 이를 수행하고 차트의 시각적 측면에 대한 데이터도 유지하는 새로운 알고리즘이 필요했기 때문에 광학 알고리즘이 필요
    FREE
    The Nihilist 5.0 Indicator includes Forexalien and Nihilist Easy Trend trading strategies and systems. It is composed of an MTF Dashboard where you can analyze the different input possibilities of each strategy at a glance. It has an alert system with different types of configurable filters. You can also configure which TF you want to be notified on your Metatrader 4 platform and Mobile application The indicator has the option to view how could be a TP and SL by using ATR or fixed points, even
    Hello Guys! I want to share with you a very useful tools. Anyone of us who has used MT4 for some time knows how impractical this platform can be for discretionary trading. That's why I created this graphical interface!  Interface is very simple, all the info that you need are in the video and in the screenshot. NB: Before to run the EA Interface, remember to copy the file in the comment in your MT4 folder "Controls". PATH: .../MQL4/INCLUDE/CONTROLS NB: unfortunately the interface can't be t
    CMI - Profit from trending and ranging markets. The CMI indicator is a two-part system used to trigger both trend and counter-trend trades, that has been introduced by Daniel Fernandez in an article published in Currency Trading Magazine (August 2011 issue). It is a simple, yet effective indicator, which gauges whether the market has behaved in a choppy (non-directional) manner or trending (directional) manner. CMI calculates the difference between the most recent bar's close and the close n bar
    Bermaui Channel
    Muhammad Elbermawi
    5 (27)
    This is a price channel that shows five important price levels on the chart. Those levels are: 1. The Highest High (HH) of the previous x bars. 2. The Highest Low (HL) of the previous x bars. 3. The Center Line. 4. The Lowest High (LH) of the previous x bars. 5. The Lowest Low (LL) of the previous x bars. How does Bermaui Channels Captures Overbought  area Think of the distance between HH and HL levels as an overbought area. When the price candles or bars crosses the HL to the upside this
    Breakout Sniper
    Elmira Memish
    5 (4)
    Breakout Sniper draw trendlines by using improved fractals and plots the breakout and reversal points. NO REPAINT AUTOMATED TRENDLINES MULTI TIMEFRAME *** SINCE THE STRATEGY TESTER OF MT4 PALTFORM DOES NOR SUPPORT, YOU NEED TO TEST "CURRENT TIMEFRAME" INPUTS ONLY.***       A trendline is   a line drawn over pivot highs or under pivot lows to show the prevailing direction of price . Trend lines are a visual representation of support and resistance in any time frame. They show direction and sp
    The PUA MultiType Pivot indicator is built on the daily chart of the previous day. The PUA MultiType Pivot indicator is one of the most popular tools in technical analysis, used by traders to identify potential reversal points in financial markets. This indicator constructs three types of Pivot points: Classic, Fibonacci, and Camarilla, each offering its unique approach to market analysis. The advantages of this indicator include: Simplicity and Clarity PUA MultiType Pivot provides clearly defi
    Flat finder MT4
    Yuriy Lyachshenko
    이 인디케이터는 플랫을 감지하고 발견된 영역을 컬러 직사각형으로 칠합니다. 이 인디케이터의 주요 아이디어는 가격이 차트의 특정 영역을 채울 때 플랫을 감지하는 것입니다. 입력 매개변수: Color rectangle - 음영 처리할 사각형의 색상입니다. Bars in rectangle - 직사각형에 허용되는 최소 막대 수입니다. Density in % - 플랫의 밀도로, 사각형 영역의 백분율로 설정합니다. __________________________________________________________________ __________________________________________________________________
    Success comes from knowledge – this is true for most things in life and especially Forex trading. To become successful, a trader needs to learn technical analysis. Technical indicators are a big part of technical analysis. The problem is that, at first sight, names of technical indicators can sound unpleasantly complicated, for example, MACD, RSI or Stochastic. However, we recommend you not to judge a book by its cover. We will provide you with a fair and simple explanation of the most popular t
    Master Phi
    Chantal Sala
    Master Phi is an indicator based on Fibonacci numbers. It analyzes the percentage values returning the proportion of the Golden Section. You can customize values and set custom levels so you will create your personal Trading. The attention on the minimums and the maximums of timeframes allows accurate analysis in order to intercept very precisely the trading levels after the various impulse movements. Input Values Time_Frame to analyze LEVELS SETTINGS 9 levels (in percentage) 9 colors LINE SET
    FIBO Price Calculator  Brief Description 1. Automated Fibonacci Retracement Drawing This indicator automatically draws Fibonacci Retracement lines on the MT4 chart, assisting traders in quickly identifying potential support and resistance levels. 2. Customizable Fibonacci Sequence Users can customize the Fibonacci sequence values, and the indicator automatically converts them into corresponding price levels based on the current market price. 3. Adjustable Indicator Window Position The indicator
    RSI Global
    Igor Semyonov
    Description A universal indicator RSI together with moving averages based on it. Depending on the need, moving averages can be disabled. You can color the indicator lines and levels: lines of RSI, moving average lines and thresholds of overbought and oversold levels.   The indicator can be calculated as the standard one on the basis of a price or as a derivative on the basis of the following eighteen other indicators included in the standard package of the MT4 terminal: AD - an indicator of accu
    Introducing the Donchian Channels indicator for MQL4, a powerful technical analysis tool designed to boost your trading success. This indicator consists of four lines that represent the upper and lower boundaries of price movement over a specified period. With the Donchian Channels indicator, you can easily identify potential breakouts and reversals in the market. The upper line shows the highest high of the specified period, while the lower line represents the lowest low. The space between thes
    PowerXXX
    Marco Fornero Monia
    PowerXXX measures the power of the current candlestick and displays it in numerical format and colors. The indicator can cover multiple timeframes and can be placed on the main chart or on the charts of the underlying indicators. The number of timeframes is selectable, as well as the color levels according to the power expressed. In the latest version, the power can be expressed as a function of the opening of the candle itself or as a function of the opening of the total candles before. There
    CCI Phases Indicator
    Ihab Mohamed Kamal Fouda
    Introduction  The Commodity Channel Index, commonly known as the CCI, is a versatile indicator used by traders and investors to identify cyclical trends in commodities, stocks, and other securities. It was developed by Donald Lambert in 1980, primarily for commodity trading, but has since found widespread application in various financial markets. The CCI is particularly favored for its ability to gauge overbought and oversold levels in price movements. Historical Background  Donald Lambert, the
    MartingaleArrow
    Abdulkarim Karazon
    Martingale Arrow는 martingale 바이너리 옵션 거래를 위해 설계된 화살표 유형 mt4 표시기입니다. 이 화살표는 바 열기/인트라 바에 인쇄되고 경고를 제공합니다. 사용 방법: 화살표가 나타나는 순간 거래를 개시하세요. 거래가 성공했다면 다음 신호를 기다렸다가 동일한 로트를 거래하세요. 다음 신호에서 거래가 두 배의 로트를 잃고 신호가 승리할 때까지 계속 그렇게 하는 경우 재설정하고 첫 번째 거래 로트로 거래하세요. 권장 기간: 모두 최소 보증금 : 200 단위. 이 표시기 라이브는 다음을 수행하지 않습니다: 다시 칠하기/뒤로 칠하기 ------------------------------------- ------------- 매개변수: 표시 기간: 변경 시 다른 신호를 제공합니다. 지표 가격/유형 과매수/과매도 수준 경고 입력 화살표 스타일 ==========================================
    The indicator plots flexible support and resistance levels (dots). A special phase of movement is used for construction. Levels are formed dynamically, that is, each new candle can continue the level or complete it. The level can provide resistance or support to the price even where it is no longer there. Also, support and resistance levels can change roles. The importance of levels is affected by: the amount of time the level is formed and the number of touches. The significance of these l
    Place price Alerts on extended  Rectangles and Trendlines -  Risk reward indicator mt4 Extend Rectangles & Trendlines to the right edge Mark your supply demand zones with extended rectangle and draw support resistance lines with extended trendline. Find detailed manuals   here . Find contacts on my   profile . MT4 Rectangle extender indicator will simplify and make it easier for you to analyze markets and stay notified about important events. When you extend rectangle or trendline the action bu
    Sell Signall
    Dmitriy Kashevich
    This indicator is named so for a reason, because it will show the reverse side of the market. It has several math indicators built in that are tuned to show the best signals for currency pairs! Ideally proved to be in work on the M5-M15 no more and no less! Only at the same time it shows up to 86.5% of correct signals! The settings include the colors of the arrows, the alert, and the same parameters so that you can reconfigure the indicator and trade on cryptocurrency and raw materials!
    NAM Divergences
    NAM TECH GROUP, CORP.
    5 (1)
    MT4 Multi-timeframe Divergence and Overbougt/Oversold detection indicator. Features - Fully customizable on chart control panel, provides complete interaction. - Hide and show control panel wherever you want. - Real time information about non-capitalized divergences. - Real time information about overbougt / oversold situations. - Real time information about regular divergences. - Real time information about hidden divergences. - Oscillators available for divergences detection: AO, RSI, CCI, M
    이 제품의 구매자들이 또한 구매함
    Trade Assistant MT4
    Evgeniy Kravchenko
    4.46 (184)
    거래당 위험 계산, 라인을 사용한 손쉬운 신규 주문, 부분 청산 기능을 통한 주문 관리, 7가지 유형의 트레일링 스탑 및 기타 유용한 기능을 제공합니다. 주의, 응용 프로그램은 전략 테스터에서 작동하지 않습니다. Manual, Description, Download demo 라인 기능       - 차트에 개시선, 손절매, 차익실현을 표시합니다. 이 기능을 사용하면 새로운 주문을 쉽게 하고 개봉 전에 추가 특성을 볼 수 있습니다. 위기 관리       -       위험 계산 기능은 설정된 위험과 손절매 주문의 크기를 고려하여 새 주문의 볼륨을 계산합니다. 이를 통해 손절매 크기를 설정하고 동시에 설정된 위험을 존중할 수 있습니다. 로트 계산 버튼 - 위험 계산을 활성화/비활성화합니다. 필요한 위험 값은 위험 필드에 0에서 100 사이의 백분율 또는 예금 통화로 설정됩니다. 설정 탭에서 위험 계산 옵션을 선택합니다. $ 통화, % 잔액, % 지분, % 자유 마진, % 사용
    가격이 순식간에 변할 수 있는 시장에서 주문은 가능한 한 간단해야 한다고 생각하십니까? Metatrader에서는 주문을 열 때마다 시작 가격, 손절매 및 이익실현 및 거래 규모를 입력하는 창을 열어야 합니다. 금융 시장 거래에서 자본 관리는 초기 예금을 유지하고 곱하기 위해 필수적입니다. 따라서 주문을 하고 싶을 때 얼마나 큰 거래를 열어야 하는지 궁금할 것입니다. 이 단일 거래에서 위험을 감수해야 하는 예치금의 비율은 얼마입니까? 이 거래에서 얼마나 많은 이익을 얻을 수 있으며 위험 대비 이익 비율은 얼마입니까? 거래 규모를 설정하기 전에 거래 규모가 어떻게 되어야 하는지에 대한 질문에 대한 답을 얻기 위해 필요한 계산을 수행합니다. 이 모든 작업을 자동으로 수행하는 도구가 있다고 상상해 보십시오. 차트를 열고 시장 분석을 하고 진입점, 방어점(손절매) 및 목표(이익 실현)를 수평선으로 표시하고 마지막에 위험 수준을 정의합니다. 이 거래에서 감당할 수 있는 가용 자본의 %로, 이
    The product will copy all telegram signal to MT4   ( which you are member  ) , also it can work as remote copier.  Easy to set up, copy order instant, can work with almost signal formats, image signal, s upport to translate other language to English Work with all type of channel or group, even channel have "Restrict Saving Content", work with  multi channel, multi MT5 Work as remote copier: with signal have ticket number, it will copy exactly via ticket number. Support to backtest signal. How to
    I present to your attention a powerful utility for predicting the future movement of an asset based on W.D. Ganna’s law of vibration. This utility analyzes the selected market model and provides codes for future possible market movement patterns. If you enter the selected code into the appropriate box, you will receive a forecast of the potential market movement. The utility has the ability to display several potential forecast models. The forecast is not yet tied to time and price and gives th
    TradePanel MT4
    Alfiya Fazylova
    4.91 (88)
    Trade Panel은 다기능 거래 보조원입니다. 이 애플리케이션에는 수동 거래를 위한 50개 이상의 기능이 포함되어 있으며 대부분의 거래 작업을 자동화할 수 있습니다. 구매하기 전에 데모 계정에서 데모 버전을 테스트할 수 있습니다. 데모는 여기 에서 확인하세요. 전체 지침은 여기 에서 확인하세요. 거래 . 한 번의 클릭으로 기본적인 거래 작업을 수행할 수 있습니다: 보류 주문 및 포지션 열기 보류 주문 및 포지션을 마감합니다. 포지션 전환(매수를 청산하여 매도를 개시하거나 매도를 청산하여 매수를 개시). 포지션 고정(반대 포지션을 열어 SELL과 BUY 포지션의 볼륨을 동일하게 만듭니다). 모든 포지션을 부분 청산합니다. 모든 포지션의 이익실현 및/또는 손절매를 공통 수준으로 설정합니다. 모든 포지션의 손절매를 손익 분기점 수준으로 설정합니다. 주문 및 포지션을 열 때 다음을 수행할 수 있습니다. 설정된 위험에 따라 거래량 자동 계산을 사용합니다. 한 번의 클릭으로 여러 주문을 열
    Strategy Builder offers an incredible amount of functionality. It combines a trade panel with configurable automation (covert indicators into an EA), real-time statistics (profit & draw down) plus automatic optimization of SL, TP/exit, trading hours, indicator inputs. Multiple indicators can be combined into an single alert/trade signal and can include custom indicators, even if just have ex4 file or purchased from Market. The system is easily configured via a CONFIG button and associated pop-up
    RedFox Copier Pro
    Rui Manh Tien
    4.75 (12)
    FREE SIGNAL CHANEL:  https://t.me/redfox_daily_forex_signals Time saving and fast execution Whether you’re traveling or sleeping, always know that Telegram To Mt4 performs the trades for you. In other words, Our   Telegram MT4 Signal Trader  will analyze the trading signals you receive on your selected Telegram channels and execute them to your Telegram to MT4 account. Reduce The Risk Telegram To Mt4   defines the whole experience of copying signals from   Telegram signal copier to mt4  p
    Trade Assistant Pro 36 in 1
    Makarii Gubaydullin
    4.95 (20)
    다기능 도구: 로트 계산기, 가격 조치, R/R 비율, 무역 관리자, 공급 및 수요 영역을 포함한 65개 이상의 기능 데모 버전   |   사용자 매뉴얼   |   MT5 버전 이 유틸리티는 전략 테스터에서 작동하지 않습니다. 여기에서 데모 버전을 다운로드하여 제품을 테스트할 수 있습니다. Contact me   질문/개선 아이디어가 있는 경우/버그가 발견된 경우 저에게 연락 하십시오. 거래 프로세스를 간소화, 가속화 및 자동화하십시오. 이 대시보드로 표준 터미널 기능을 확장하십시오. 유틸리티는 외환, 주식, 지수, 암호화폐 등 모든 거래 수단에서 작동합니다. 1. 새로운 거래 열기 : 로트/리스크/RR 계산: 1. Lot 계산기 (리스크 규모에 따른 거래량 계산) 2. 리스크 계산기 (로트 규모에 따른 리스크 금액) 3. 위험/보상 비율(RR) 4. 주문에 대한 활성화 트리거 + StopLimit 구매 / StopLimit 판매 5. 가상 SL / TP 레벨 (숨겨진 SL
    당신이 멤버인 어떤 채널에서든(비공개 및 제한된 채널 포함) 신호를 직접 MT4로 복사하세요.  이 도구는 사용자를 고려하여 설계되었으며 거래를 관리하고 모니터하는 데 필요한 많은 기능을 제공합니다. 이 제품은 사용하기 쉽고 시각적으로 매력적인 그래픽 인터페이스로 제공됩니다. 설정을 사용자 정의하고 제품을 몇 분 안에 사용하십시오! 사용자 가이드 + 데모  | MT5 버전 | Discord 버전 데모를 시도하려면 사용자 가이드로 이동하십시오. Telegram To MT5 수신기는 전략 테스터에서 작동하지 않습니다! Telegram To MT4 특징 한 번에 여러 채널에서 신호를 복사합니다. 비공개 및 제한된 채널에서 신호를 복사합니다. Bot 토큰이나 채팅 ID가 필요하지 않습니다(필요한 경우 계속 사용할 수 있음). 위험 % 또는 고정된 로트를 사용하여 거래합니다. 특정 심볼을 제외합니다. 모든 신호를 복사할지 복사할 신호를 사용자 정의할지 선택합니다. 모든 신호를 인식하
    Click and Go Trade Manager
    Victor Christiaanse
    5 (11)
    Click and Go Trade Manager, the ultimate solution for seamless trading execution. With a simple click on the chart, you can effortlessly define your stop loss, entry price, and target levels. No more hassle of inputting values manually - it's made incredibly intuitive and easy. Embedded risk management is a key feature of our Trade Manager. We understand the importance of protecting your investments, which is why the Click and Go Trade Manager incorporates risk management. When placing orders,
    Ultimate Trailing Stop EA
    BLAKE STEVEN RODGER
    4.33 (15)
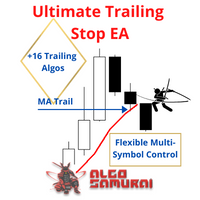
    This EA Utility allows you to manage (with advanced filtering) unlimited open orders (manual or EA) with 16 trailing stop methods: fixed, percent, ATR Exit, Chandelier Exit, Moving Average, Candle High Low Exit, Bollinger Bands, Parabolic, Envelope, Fractal, Ichimoku Kijun-Sen, Alligator, Exit After X Minutes or Bars, RSI and Stochastic. The trailing stop can be either real or virtual, and you can exit fully or with a partial close percent on touch or bar close.  Moreover, you can add (overr
    MT4 to Discord
    Trinh Dat
    4.29 (7)
    The Expert Advisor will send notifications via Discord when orders are opened/modified/closed on your MetaTrader 4 account. - Send message and screenshot to Discord group/channel.  - Easy to customize message.  - Support custom message for all languages - Support full Emoji.  - Send report Daily, Weekly, Monthly ( must show all history of orders ) Parameters - Discord url Webhook - create webhook on your Discord channel. - Magic number filter - default all, or input magic number to notify with
    Comprehensive on chart trade panel with the unique ability to be controllable from mobile as well. Plus has a library of downloadable configuration, e.g. exit rules, extra panel buttons, pending order setup and more. Please see our product video. Works with all symbols not just currency pairs. Features On chart panel plus controllable from free app for Windows, iPhone and Android Built-in script engine with library of downloadable configuration, e.g. add 'Close All Trades in Profit' button, exit
    PZ Custom Trader EA
    PZ TRADING SLU
    3 (2)
    Would you like to automate your trading using a custom indicator of your choice? This EA trades using almost any custom indicator. It offers fully customizable settings, flexible position management, customizable trading sessions and weekdays, an inverse mode and a martingale mode. All the robot needs from you are two inputs: The filename of the indicator to trade The signal buffer or the buy/sell buffers to call That's it! The signal buffer or the buy/sell buffers should be provided by the dev
    TPSpro Trade PRO
    Roman Podpora
    5 (4)
    An instrument capable of instantly calculating position size or risk based on a specified stop-loss level is critically important for both professional traders and beginners. Trading utility TRADE PRO provides fast and accurate calculations, helping you make decisions in conditions of limited time and increased market volatility. Main functions: Original. Simple. Effective. Original and convenient opening of the main trading panel: Simply hover your mouse over the right part of the chart and cli
    The product will copy all  Discord  signal   to MT4   ( which you are member  ) , also it can work as remote copier.  Easy to set up. Work with almost signal formats, support to translate other language to English Work with multi channel, multi MT4. Work with Image signal. Copy order instant, auto detect symbol. Work as remote copier: with signal have ticket number, it will copy exactly via ticket number. How to setup and guide: Let read all details about setup and download Discord To MetaTrade
    Summer 50% discount ($199 -> $99) Advanced trading tool: One click smart orders that execute under your conditions Developed by trader for trading community:  position size calculator (lot size), open position after price action, strategy builder, set and forget trading, mobile notifications... Risk Management -  Risk percentage position size calculator, gain percentage, target risk reward ratio, spread and commissions are included in calculations 7 Advanced order types   - Set and forget tra
    Mentfx Mmanage
    Anton Jere Calmes
    5 (16)
    The added video will show you the full functionality, effectiveness, and simplicity of this trade manager. Drag and Drop Trade Manager. Draw your entry and have the tool calculate the rest. Advanced targeting and close portions of a trade directly available in tool (manage trades while you sleep). Market order or limit order on either side with factored spread. Just draw the entry, the tool does the rest. Hotkey setup to make it simple. Draw where you want to enter, and the stop loss, the tool c
    TakePropips TradePad Pro
    Eric John Pajarillaga Aldana
    5 (4)
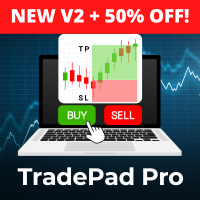
    TakePropips TradePad Pro 에는 강력한 거래 관리자, 통화 강도 측정기, 계정 보고 도구, 위험 관리 도구 등이 포함되어 있습니다! 그것은 당신이 만나게 될 가장 진보된 외환 거래 관리자이자 거래 도우미 중 하나입니다! 보다 효율적인 무역 거래 관리 방법을 원하는 트레이더를 위한 완벽한 솔루션입니다. 다음 블로그 게시물에서 사용 설명서를 다운로드할 수 있습니다.   https://www.mql5.com/en/blogs/post/751180 Strategy Tester에서 이 거래 시스템을 테스트할 수 있습니다(비주얼 모드 활성화). 실시간 차트에서 테스트하고 싶다면 저에게 메시지를 보내 7일 평가판을 받을 수도 있습니다. 자세한 내용은 설명 아래에 비디오 자습서도 제공됩니다. 질문이 있거나 도움이 필요한 경우 언제든지 저에게 연락해 주시면 기꺼이 도와드리겠습니다. TradePad Pro는 모든 Forex 쌍, 금속, 상품, 지수 및 암호화폐에서 작동합니다.
    EA for Cycle Sniper Indicator This utility is designed to open/close auto trades according to the Cyle Sniper indicator's signals. Different entry rules  with various stop loss, take profit options can be applied. You will find the details in this blogpost.  https://www.mql5.com/en/blogs/post/749655 Some important issues are explained in the video. Please do not hesitate to contact us if you need further information. IMPORTANT NOTE: You can not test the full functions of the EA on the strategy t
    The Expert Advisor will help you forward all pop-up alert with screenshot from  MetaTrader 4 to Telegram channel/ group, also forward all notifications to Telegram. Parameters  -  Telegram Bot Token - create bot on Telegram and get token.  -  Telegram Chat ID  - input your Telegram user ID,  group / channel ID  -  Forward Alert - default true, to forward alert.  -  Send message as caption of Screenshot - default false, set true to send message below Screenshot  How to setup and guide  - Telegram
    MT4 Alert Signal Trader  is an EA that helps you trade MT4 Alert popup. Some indicators can provide signals by showing an alert popup containing signal texts. This EA will read and trade these signal texts. The alert texts should contain at least 2 elements:  (1) a symbol text   (ex: "EURUSD") and  (2) a command type   (ex: "Buy", "Sell", "Close") that trigger EA's trading activities. Some other contents that may have or not are open price, stop loss, take profit values... The EA needs an aweso
    Mutiple Orders with ChangernTFnMgt
    Opengates Success International
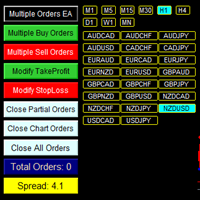
    MULTIPLE ORDERS With Symbol and Time Frame Changer Multiple Orders Utility is created to give easy profits-making trades with a little movements and without going long distance to get it all. This Utility opens multiple orders as many trades as the number specified by the User or as many as permitted by your Broker in the same direction on the same currency pair simultaneously. The idea behind it, is that instead of running after 100 - 200 pips which may not likely be attainable in the re
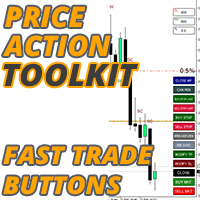
    가격 조치 도구 키트 EA는 주로 스캘퍼를 위해 설계되었지만 모든 시간대에 사용하여 정지 수준에 따라 올바르게 계산된 로트 크기로 시장에 빠르게 진입할 수 있습니다. 주문) 그런 다음 시장이 움직일 때 스탑을 조정하고 이익을 얻습니다. 사용할 모든 기능, 설정 및 모범 사례 전략의 전체 목록을 보려면 여기를 클릭하십시오. https://www.mql5.com/en/blogs/post/748072 위험 기반 진입 빠른 주문 버튼을 사용하면 계정의 위험 비율을 기반으로 포지션을 잡을 수 있습니다. 선택한 위험과 손절매까지의 거리를 기반으로 로트 크기를 자동으로 계산합니다. 따라서 브로커가 0.01 로트 크기 사용을 허용하는지 확인해야 합니다. 0.10 또는 1.00 로트 증분을 사용해야 하는 경우 작동하지 않습니다. 빠른 거래 실행 버튼 차트에 빠른 거래 실행 버튼을 배치하여 즉시 거래를 자동으로 열거나 닫거나 조정할 수 있습니다. 일반 진입 버튼뿐만 아니라 모든 포지션을
    Riskless Pyramid
    Snapdragon Systems Ltd
    5 (1)
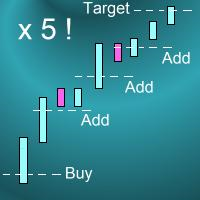
    Introduction This powerful MT4 trade mangement EA offers a way potentially to aggressively multiply trade profits in a riskfree manner. Once a trade has been entered with a defined stoploss and take profit target then the EA will add three pyramid add-on trades in order to increase the overall level of profit. The user sets the total combined profit target to be gained if everything works out. This can be specified either as a multiple of the original trade profit or as a total dollar amount. Fo
    Unlimited Trade Copier Pro is a tool to copy trade remotely to multiple MT4, MT5 and cTrader accounts at different computers/locations over internet. This is an ideal solution for you if you are a signal provider and want to copy your trades to other receivers globally on your own rules. One provider can copy trades to multiple receivers and one receiver can get trade from multiple providers as well. The provider can even set the subscription expiry for each receiver, so that receiver will not b
    What Exactly Is A Smart Trading Tool? Smart Trading Tool was developed for fast and comfortable trading of the financial markets especially for ORDER BLOCKS TRADERS . It provides traders functionalities, such as: A Drawing Tool One-Click Trading Panel Automated Lot Sizes Calculation based on your risk appetite & Money Management ( Watch this video , how this tool can help manage your risk per trade better!) Built in PRICE LEVELS (Fibonacci, Round Numbers, Daily hi-low, etc) Shows Trading Informa
    Averaging Helper
    Sergey Batudayev
    5 (2)
    Averaging Helper - This sort of trading helper instrument will help you average out your previously unprofitable positions using two techniques: standard averaging hedging with the subsequent opening of positions according to the trend The utility has the ability to sort out several open positions in different directions at once, both for buy and for sell. For example, you opened 1 position for a sell and the second for a buy, and they are both unprofit, or one is in the unprofit and one is in
    This is a multi-pair and multi scanner dashboard to find the key signal of BBMA Oma Ally Strategy BBMA consists of the use of 2 indicators: Moving Averages Bollinger Bands BBMA consists of many types of entries: Reentry Extreme Rejection EMA50 GAP (EMA50 to Upper/Lower BB) MHV Full Setup (CSE>TPW>MHV>Direction>Reentry) There are many multi timeframe signals based on this strategy. RRE (Reentry - Reentry - Extreme) REE (Reentry - Extreme - Extreme) REM (Reentry - Extreme - MHV) RRM (Reentry - R
    This is exactly what the name says. Visual strategy builder . One of a kind. Turn your trading strategies and ideas into Expert Advisors without writing single line of code. Generate mql source code files with a few clicks and get your fully functional Expert Advisors, which are ready for live execution, strategy tester and cloud optimization. There are very few options for those who have no programming skills and can not create their trading solutions in the MQL language. Now, with Bots Build
    제작자의 제품 더 보기
    -25% discount ($199 -> $149) Advanced trading tool: One click smart orders that execute under your conditions Developed by trader for trading community:  position size calculator (lot size), open position after price action, strategy builder, set and forget trading, mobile notifications... Risk Management -  Risk percentage position size calculator, gain percentage, target risk reward ratio, spread and commissions are included in calculations 7 Advanced order types  - Set and forget trading w
    -25% discount ($149 -> $111) Everything for chart Technical Analysis indicator mt5 in one tool Draw your supply demand zone with rectangle and support resistance with trendline and get alerts to mobile phone or email alert -  Risk reward indicator mt5 Video tutorials, manuals, DEMO download   here .   Find contacts on my   profile . 1.   Extended rectangles and trendlines Object will be extended to the right edge of the chart when price will draw new candles on chart. This is rectangle extend
    Place price Alerts   on  extended  Rectangles   and   Trendlines -  Risk reward indicator mt5 Extend Rectangles & Trendlines to the right edge Mark your supply demand zones with extended rectangle and draw support resistance lines with extended trendline. Find detailed manuals   here .  Find contacts on my   profile . MT4 Rectangle extender indicator will simplify and make it easier for you to analyze markets and stay notified about important events. When you extend rectangle or trendline the a
    Summer 50% discount ($199 -> $99) Advanced trading tool: One click smart orders that execute under your conditions Developed by trader for trading community:  position size calculator (lot size), open position after price action, strategy builder, set and forget trading, mobile notifications... Risk Management -  Risk percentage position size calculator, gain percentage, target risk reward ratio, spread and commissions are included in calculations 7 Advanced order types   - Set and forget tra
    Place price Alerts on extended  Rectangles and Trendlines -  Risk reward indicator mt4 Extend Rectangles & Trendlines to the right edge Mark your supply demand zones with extended rectangle and draw support resistance lines with extended trendline. Find detailed manuals   here . Find contacts on my   profile . MT4 Rectangle extender indicator will simplify and make it easier for you to analyze markets and stay notified about important events. When you extend rectangle or trendline the action bu
    Display rectangles and trendlines list  from Trading box  Technical analysis tool. Objects are ordered in the list by   pip distance   that is difference between object price and Bid price. With this tool you will know which chart to look for next trading opportunity. No more switching between charts and searching for trades where price is close to rectangle zone or trendline support resistance level. Sorted Rectangles and Trendlines by pip distance -  If you are trading on multiple charts, the
    FREE
    Rectangle position changer   tool is used for precise/accurate rectangle positioning by time or price only.   You can move each side of rectangle separately with lines created around selected rectangle. This tool will replace classical grid because it is like dynamical chart grid for rectangle grid. This tool allows you to adjust your rectangles, from all 4 sides, with ease and makes your technical analysis that much faster. This tool is handy when corner points for changing rectangle position a
    FREE
    Display Order box list from  Trading box  Order Management tool. Find contacts and manual links on my   profile . This dashboard gives you an edge in forex trading because in few seconds you can decide which pair and timeframe is worth to watch more closely. This is how you will not be distracted by all other forex pairs that you trade, and you will not miss great opportunities to trade the best price. Trading Dashboard  (order box overview panel and Trading box Order management extension) Tr
    FREE
    Display rectangles and trendlines list from  Trading box  Technical analysis tool. Objects are ordered in the list by pip distance that is difference between object price and Bid price. With this tool you will know which chart to look for next trading opportunity. No more switching between charts and searching for trades where price is close to rectangle zone or trendline support resistance level. Sorted Rectangles and Trendlines by pip distance -  If you are trading on multiple charts, then th
    FREE
    Rectangle position changer  tool ( rectangle indicator) is used for precise/accurate rectangle positioning by time or price only. You can move each side of rectangle separately with lines created around selected rectangle. This tool will replace classical grid because it is like dynamical chart grid for rectangle grid. This tool allows you to adjust your rectangles, from all 4 sides, with ease and makes your technical analysis that much faster. This tool is handy when corner points for changi
    FREE
    Display Order box list from  Trading box  Order Management tool. Find contacts and  manual   links on my   profile . This dashboard gives you an edge in forex trading because in few seconds you can decide which pair and timeframe is worth to watch more closely. This is how you will not be distracted by all other forex pairs that you trade, and you will not miss great opportunities to trade the best price. Trading Dashboard  (order box overview panel and Trading box Order management extension)
    FREE
    This tool will remove buttons and text labels from the chart, after you remove Trading box Order management or Trading box Technical analysis . You just need to drag this tool to your chart and after cleanup of objects is finished, the tool will remove itself from the chart. Please check images below that present Before and After using the Removal tool. There is also a short YouTube video at the bottom to show how easy it is to clean your chart after using Trading box tools. - input var
    FREE
    This tool will remove buttons and text labels from the chart, after you remove Trading box Order management or Trading box Technical analysis. You just need to drag this tool to your chart and after cleanup of objects is finished, the tool will remove itself from the chart. Please check images below that present Before and After using the Removal tool. There is also a short YouTube video at the bottom to show how easy it is to clean your chart after using Trading box tools. - input variable "
    FREE
    필터:
    ionut_34
    169
    ionut_34 2023.12.01 20:55 
     

    since i have this tool i don't use tradingview anymore, it has everything you need.

    riad mansee
    25
    riad mansee 2023.10.16 22:58 
     

    I purchased this product and when I changed the platform it no longer worked why ?

    01.dcalantes
    72
    01.dcalantes 2023.09.20 22:12 
     

    This indicator being an MT4 add on that provides it almost a TradingView level of power isn't just hype. A rectangle with a built in Fib level (Split %), RR tool, adding in text, text placement, alerts (for both rectangle and lines)... I was in search of a tool for MT4 to do JUST EVERY SINGLE THING I DO ON TRADINGVIEW. And this delivered all I needed. This tool almost instantly made me fall in love with my MT4 mark ups once again. There's a lot of moving parts, sure, and it might take a while to get used to it, but good thing is the author made a tutorial video to walk me through each function. Amazing. I can see myself using this indicator for as long as I trade. Thank you for creating this masterpiece.

    mmsrect
    61
    mmsrect 2023.08.19 11:31 
     

    This is one indicator that adds everything that is missing from mt4. You may need a day get used to it, but once you do it is amazing. I don't need tradingview anymore. The best part of this tool is its dashboard. Unlike other tools, it does not show you precalculated entries, or setups or other useless stuff. Instead it shows you your own analysis. That is so powerful. Amazing job developers. You nailed it!

    livinglife44
    45
    livinglife44 2023.08.01 18:07 
     

    Game Changer, Using Mt4 all these years now not having to you Tradingview is awesome. A++ Tools here

    RvdHo
    220
    RvdHo 2023.06.11 08:00 
     

    This tool lifts Metatrader to an entirely different level. Seriously good software for the self-directed trader of levels, patterns, trend lines and more. Love the active development and support vids, too.

    dip_
    35
    dip_ 2023.05.11 16:45 
     

    Trading Box technical Analysis is an amazing product! It allows really fast chart annotation and greatly facilitates chart navigation. It practically turns Mt4/5 into TradingView! Here are my favourite functions: The “Scale” function allows you to navigate charts at a set scale. The “@“ function allows you to locate specific areas on the chart (from high timeframes to low timeframes) The “Sync” function allows you to sync your chart annotations on multiple charts. Since the last update, you can very quickly annotate the Open, Close, Low, High and Candle Bodies (Supply or Demand) with simple keyboard shortcuts! I am very happy that I purchased Trading Box Technical Analysis, my charts look great and my analysis is greatly accelerated. One last thing, Igor, the creator of Trading Box Technical Analysis is amazing and very helpful, he answers emails and offers regular updates. In my opinion, Trading Box Technical Analysis is a MUST HAVE if you use Mt4 or Mt5.

    18104
    344
    18104 2023.04.18 12:49 
     

    Great indicator, but I would like it to also be able to synchronize the Fibonacci retracement.

    ako to
    90
    ako to 2023.01.08 14:32 
     

    I TRIED IT. One of the best tools I used. it made things much easier. must give it a try. it's all you need in your trading.

    RNP
    44
    RNP 2022.10.10 03:52 
     

    Truly the closest MT4/5 indicator you can have to match the features of TradingView. With alerts, ability to sync between charts, label and much more, Igor (the developer) continues to expand the features with time. He is also very responsive to questions and has an extensive website that explains in detail all the features. Great indicator from a great developer.

    netguru007
    31
    netguru007 2022.08.25 06:49 
     

    Trading Box Technical Analysis tool is one of the most comprehensive tool available on MetaTrader. I have been using it for a month now and been totally loving all its features. Its an ultimate tool if you are price action trader/Supply and demand trader or a SMC based trader. The alerts & recurring alerts and the Sync option for MTF analysis are some of my favorite functionalities of this tool. Great one time investment for setting up alerts for your charts & MTF analysis and a much cheaper alternative for Tradingview for which you would end up paying close to $300 annually (black friday offer else double the price at $600) for 400 alerts

    Timothy Charlton
    75
    Timothy Charlton 2022.08.17 18:01 
     

    This is a very good tool. Everything you need for trading S/D, really good customer service aswell

    Martin Tuke
    270
    Martin Tuke 2022.07.10 21:19 
     

    Great tool, would not be without it now.

    goncalo009
    140
    goncalo009 2022.04.26 23:39 
     

    Hi guys. Really love this indicator. Everything you need on one click. The only thing i think you need add it's auto split rectangle. If i pick rect from color pick will become already split. If this happen i will give you 10 stars

    Retroool
    38
    Retroool 2022.04.26 02:00 
     

    Great indicator, great functionality, ease of access, chart simplicity, supportive creator, etc... What more could one ask? But really, if you are looking to make your charting faster and more efficient, look no further. Just try the demo! (I mean, REALLY test it out), you'll be hooked:)

    fxcommentary
    1892
    fxcommentary 2022.04.12 02:26 
     

    For people using lines/rectangles to alert them - a very good tool. Its main advantage is - it is user friendly to operate. It is highly probable you will be able to incorporate this tool in your routines and it then indeed makes description of your routine faster. Good job, thank you.

    UPDATE: 21.05.2022

    this tool has few exceptional features which are not manifested clearly.

    One of them is the ability to cut support/resistanve line at the point of its breaking by a candle. Example - if you find at 1:05 that the support is broken, and you will cut the support line at 1:07, than your supoort line will no longer extend to the last bar. after 1:07. Your chart on the right is clean and on the left you still have got history of breaking the line. Of course you can do it manually but this tool makes it as easy as possible. This feature alone is worth at least 1/3 or rather 1/2 of the price of the this great tool if you wanted it created to you by any developer. And this is just a tiny little feature, one of many. The cutting is made with [>>>] button.

    azim61
    44
    azim61 2022.03.28 01:55 
     

    This indicator saves my time doing analysis on the chart and be more efficient. Thanks Igor for creating this indicator!

    Devonish
    2971
    Devonish 2022.02.08 11:46 
     

    Very happy with this product. I have my own method of identifying S&R, using this tool is very helpful.

    August 2023. Great update with the FVG feature.

    CasiousD
    804
    CasiousD 2021.12.02 19:04 
     

    Absolutely amazing tool. I was only interested for one function that I couldn't find implemented in a good way in any other indicator. Once I started using it, I realized all the other great functionality that is available, and now this has replaced the job of 4, yes FOUR other indicators I no longer need because of this. Makes my charts cleaner and less cluttered, and I am much, much more efficient and effective with my analysis and decision making. It may seem a bit daunting, but it's so simple to learn and use, and you can quickly find use for things that you didn't even realize you needed. Also love that it has a check for compatibilty, or rather incompatibility with other indicators...I'm not sure how it works because I don't have many other indicators on my chart anymore since I started using this, so I haven't run into any conflicts. But I'm sure there is a video or documentation that explains it somewhere among the many instructional videos provided by the author, which is an absolute plus! Finally, author is very responsive and helpful! Thank you Igor!

    nk79
    354
    nk79 2021.11.15 19:03 
     

    If you wanne bring your analysis to the MT4 plattform with alerts and charting thats the tool for it.

    12
    리뷰 답변
    버전 10.30 2024.06.26
    - font color fix for Alert History label
    버전 10.29 2024.06.24
    hotkey update: "E" - Extend/unextend selected trendline or rectangle
    버전 10.28 2024.06.20
    - NEW hotkey E to Extend selected trendline or rectangle
    버전 10.27 2024.03.22
    - object name change bug fix
    버전 10.26 2024.03.16
    - reported bug fix
    버전 10.25 2024.03.12
    - bug fix: text objects deleted on object property change
    버전 10.24 2024.03.03
    - bug fix
    버전 10.23 2024.02.29
    - performance upgrade
    버전 10.22 2024.02.24
    - NEW dropdown option "Name & Price (Trendline)" for input "Extended trendline name position"
    버전 10.21 2024.02.17
    - update
    버전 10.20 2024.01.07
    - hotkeys S D settings via input "Click SD and S D hotkeys rectangle drawing"
    버전 10.19 2024.01.02
    - new "Pr" button to show rectangle and trendline Price tag

    - button "No text" renamed to button "Name"

    Link: https://www.mt4tradingbox.com/technical-analysis/#nameprice
    버전 10.18 2023.12.30
    - NEW input "Click SD rectangle drawing options"
    1. High & Low (Whole candle))
    2. Open & Close (Candle body)
    3. Body & Tail
    4. Candle Tail,Wick,Shadow

    - NEW "X" button to delete selected rectangle or trendline
    버전 10.17 2023.12.29
    - Hotkey remapping for LTF, MTF, HTF:

    X - Show/hide TBTA buttons
    W - Show FVG
    Q - Chart Scale
    1 - Line thickness
    2 - Line thickness
    3 - LTF
    4 - MTF
    5 - HTF
    A - @ (Move chart to selected object Time1)
    버전 10.16 2023.12.28
    New Hotkeys:
    X - Show/hide TBTA buttons
    W - Show FVG
    Q - Chart Scale
    1 - Line thickness
    2 - Line thickness
    L - LTF
    M - MTF
    H - HTF
    A - @ (Move chart to selected object Time1)
    버전 10.15 2023.12.14
    - NEW input "Show name text after un-extend <<"
    버전 10.14 2023.12.10
    - display bug fix for "Flat TL" button
    버전 10.13 2023.12.05
    - performance upgrade
    버전 10.12 2023.12.03
    - split line % display fixed based on trendline TF
    버전 10.11 2023.12.02
    - NEW hotkey "X" to show/hide TBTA buttons

    - NEW input variables:
    "Un-extend Rectangle after Close, Engulf"
    "Un-extend Trendline after Alert, Close, Retest"

    - NEW input variable "Unfill rectangle after Engulf, Close"
    버전 10.1 2023.11.30
    - NEW hotkeys input variables:
    H - High hotkey trendline name
    L - Low hotkey trendline name
    O - Open hotkey trendline name
    C - Close hotkey trendline name

    - NEW input variable "Extended trendline style after Alert, Close, Retest"

    - NEW input variable "Ray trendline style after Alert, Close, Retest"
    버전 10.0 2023.11.06
    - LTF/MTF/HTF button bug solved
    버전 9.99 2023.11.01
    - when unsync Master also unsync all Slaves
    - NEW input variable "SYNC: Unsync master - Delete slave objects"
    - NEW input variable "SYNC: Synced master - Visible for CURRENT and selected HTF/MTF/LTF"
    버전 9.98 2023.10.08
    - NEW input "Extended object location"
    - Right edge of the chart
    - Current chart time/bar

    - NEW button "Flat TL" to enable drawing flat trendlines by default
    Manuals: https://www.mt4tradingbox.com/technical-analysis/#flatTL
    버전 9.97 2023.08.12
    - new button "Show FVG" - Button to show ALL Fair Value Gaps (FVG indicator mt5 mt4)

    Video: https://www.youtube.com/watch?v=oiHHztd1dzI

    - new inputs:
    Show FVG - Search bars in history (0 = default)
    Show FVG rectangle color - Untouched/Untested
    Show FVG rectangle color - Touched/Tested
    버전 9.96 2023.08.05
    - bug fix for SYNC extended rectangle
    버전 9.95 2023.08.04
    - added Hotkey F for FVG - Fair Value Gap
    버전 9.94 2023.08.03
    - update for Rectangle position changer indicator
    버전 9.93 2023.07.28
    - bug fix TF colors for: new created objects, Click SD, Click FVG
    버전 9.92 2023.07.24
    - new button "Click FVG". When click on candle with FVG - Fair Value Gaps, then draws the price imbalance rectangle (FVG; ICT Fair Value Gaps Imbalances)
    VIDEO: https://www.youtube.com/watch?v=pBRXTKNIMAk
    버전 9.91 2023.07.16
    - NEW input variable "SYNC: Copy object Time Frame settings from Master to Slave"
    VIDEO: https://www.youtube.com/watch?v=j1JFTERPWXo
    버전 9.90 2023.06.30
    - big fixes
    버전 9.89 2023.06.10
    - bug fixes for Rectangle Split function
    VIDEO: https://www.youtube.com/watch?v=r9p1HhjVMhg
    버전 9.88 2023.05.28
    - NEW trendline button "Retest" used for breakout and retest strategy. Breakout Retest function triggers an alert if the candle closes beyond trendline and then price touches trendline for retest in trading.
    VIDEO: https://www.youtube.com/watch?v=A_JOXfpo2Eg
    버전 9.87 2023.05.27
    - NEW trendline button "Retest" used for breakout and retest strategy. Breakout Retest function triggers an alert if the candle closes beyond trendline and then price touches trendline for retest in trading.
    VIDEO: https://www.youtube.com/watch?v=A_JOXfpo2Eg
    버전 9.85 2023.05.24
    - Fibonacci retracement indicator Multi chart SYNC
    VIDEO: https://www.youtube.com/watch?v=QgvL1lcOigY

    - NEW input "Show hotkeys S,D,H,L,O,C"
    버전 9.84 2023.05.24
    - Fibonacci retracement indicator Multi chart SYNC
    VIDEO: https://www.youtube.com/watch?v=QgvL1lcOigY
    버전 9.83 2023.05.19
    - input variable "TimeFrame colors for created Rectangle, Trend, HLine, VLine" will change color only for objects created with Trading box Technical analysis indicator
    버전 9.82 2023.05.12
    - NEW input variables:
    Extended trendline width - Hotkeys High, Low
    Extended trendline width - Hotkeys Open, Close
    버전 9.81 2023.05.06
    - Separate TimeFrame colors for created Rectangles and Lines(Trend, Horizontal, Vertical)
    버전 9.8 2023.05.05
    Hotkeys for drawing Support Resistance levels and Supply Demand zones
    Last clicked candle Hotkeys:
    S - Supply
    D - Demand
    H - High
    L - Low
    O - Open
    C - Close

    VIDEO: https://www.youtube.com/watch?v=DAldGe6hO24
    버전 9.7 2023.05.01
    - NEW input "Use TimeFrame colors for new created objects" and color selection for each standard timeframe
    VIDEO: https://www.youtube.com/watch?v=OFLsZOWXDhM

    - NEW button "Click SD" with ON//OFF logic for extended rectangle creation when user click on candle. Zone is based on candle High and Low price
    VIDEO: https://www.youtube.com/watch?v=nPRR-_yHfCg

    - Horizontal line "<< Break line" button display optimization for faster history search
    VIDEO: https://www.youtube.com/watch?v=ZxxxSy5bwMc
    버전 9.6 2023.04.09
    - button display optimization for non extended rectangles and trendlines
    버전 9.5 2023.04.01
    - bug fix for hiding buttons on selected rectangle when using "Rectangle position changer" indicator on same chart

    - input "Extended object text position" replaced by 2 NEW inputs: "Extended rectangle name position" and "Extended trendline name position"
    버전 9.4 2023.02.08
    - NEW option "Shift to rectangle & trendline engulf" for input variable "Rectangle << button function"
    - NEW input "Button text color"
    버전 9.3 2023.02.05
    - NEW input variable "Rectangle << button function" with option "Shift to rectangle engulf"
    VIDEO: https://www.youtube.com/watch?v=tyAEXGoAyYE
    버전 9.2 2023.01.15
    - Vertical Line added to Chart SYNC function
    버전 9.1 2022.12.26
    - new input variable "Engulf alert un-fill rectangle"
    버전 9.0 2022.12.10
    - SYNC rectangle function now works with Rectangle position changer indicator
    버전 8.9 2022.11.19
    - rectangle and trendline alert buttons visible within chart when scrolling left
    버전 8.8 2022.11.07
    - bug fixed after renaming object
    버전 8.7 2022.11.05
    - CPU usage reduced and chart freeze bug fixed
    버전 8.6 2022.11.03
    - performance upgrade that will lower CPU usage on MetaTrader terminal
    버전 8.4 2022.10.07
    - NEW option "Right outside" for input variable "Extended object text position"
    버전 8.3 2022.10.02
    - NEW input variable "Show 5 additional rename buttons"
    버전 8.2 2022.09.26
    - NEW input "Empty rectangle width"

    VIDEO: https://www.youtube.com/watch?v=P8eME8csQZY
    버전 8.1 2022.09.17
    - new input variable "Extended object text position" with options (Right, Left)
    버전 8.0 2022.09.15
    - new Split % button for rectangles to show premium or discount price like Fibonacci retracement
    - Bands button added for non-extended rectangles

    VIDEO: https://www.youtube.com/watch?v=VNPYUSUUdaA
    버전 7.9 2022.09.12
    - object extension bug fix when MetaTrader opens
    버전 7.8 2022.09.09
    - NEW inputs added:
    Unfilled extended rectangle style
    Unfilled extended rectangle width

    - 4 NEW color buttons for filled and empty rectangles
    버전 7.7 2022.09.02
    - bug fix for Rename button and Timeframe visibility
    버전 7.6 2022.08.21
    - new input variable "Chart, alerts and drawings refresh speed"
    버전 7.5 2022.08.12
    - new button "Hide text" that hides all texts and alerts on chart
    - "Rename" button now works with SYNC
    - Text position is copied when SYNC button is used for non-extended rectangle or trendline
    버전 7.4 2022.08.04
    - "Bands" rectangle function upgraded with (Upper) and (Lower) tag for rectangle Upper and Lower edge
    버전 7.3 2022.08.03
    - Rename button added for extended rectangle and trendline
    버전 7.1 2022.08.01
    - bug fix for "Trend" and "Hline" button with input variable "TF visibility for newly created rectangle & trendline"
    버전 7.0 2022.07.30
    NEW button Rename gives option to rename the zones from the suggested list

    VIDEO: https://www.youtube.com/watch?v=-_5njoa0etk
    버전 6.7 2022.05.28
    - update to sync with TBOM tool new functions

    See the new function added to Trading box Order management that allow automation price action within a trading scale:
    VIDEO: https://www.youtube.com/watch?v=Mdw211-Y9b0
    버전 6.6 2022.05.09
    - performance upgrade
    버전 6.4 2022.04.28
    - NEW button "Trend" and "HLine" that will create trendline and horizontal line in the middle of the chart

    - NEW input variables:
    Show Trend and HLine button (object create)
    Create trendline color - Trend button
    Create trendline style - Trend button
    Create trendline width - Trend button
    Create horizontal line color - HLine button
    Create horizontal line style - HLine button
    Create horizontal line width - HLine button

    Upgrade VIDEO: https://www.youtube.com/watch?v=ScEICIIEEKI
    버전 6.2 2022.04.09
    - bug fix and recompile for new Metatrader terminal version
    버전 6.1 2022.01.30
    - NEW input variable "Show Filled color buttons"

    - NEW History button that will show the time of last alert in the label. This information is transferred to Technical analysis dashboard where you can see last alerts of all charts in one list

    ***UPGRADE VIDEO: https://www.youtube.com/watch?v=LsTozwEajpk
    버전 6.0 2022.01.02
    - NEW input variable "Candle close alert settings" with 2 options:
    1. Current chart TF alert
    2. Alert in TF when Close is clicked
    버전 5.9 2021.12.23
    - compliance upgrade for the NEW tool "Rectangle position changer"

    Download: https://www.mql5.com/en/market/product/75865

    VIDEO: https://www.youtube.com/watch?v=IYW1dgOWwRg
    버전 5.8 2021.12.06
    - bug fix for input variable "TF visibility for newly created rectangle & trendline" when rectangle is created with click on color button
    버전 5.7 2021.11.28
    - Color button rectangle creation improved, after extended color will stay the same
    버전 5.6 2021.11.27
    - bug fix for creating rectangles with color buttons when market is closed
    버전 5.5 2021.11.27
    - CPU usage reduced that will allow more charts with TBTA in MetaTrader terminal
    버전 5.4 2021.11.16
    - bug fix for non extended rectangle Risk Reward tool
    - bug fix when rectangle name is changed and Split function is ON
    - CPU performance improvement when using TBTA on multiple charts
    버전 5.3 2021.11.01
    - risk reward tool for non-extended rectangles
    - adding more texts positions (object names) to rectangle and trendline. With button "X" you remove current text
    - if no object is selected then color buttons will create a new rectangle, otherwise the selected object color will be changed

    - NEW "Split" button added that will split extended rectangle with alert trendline (default 50% rectangle size)
    - NEW input "Default rectangle split % (0-100)"
    - NEW input "Split line color"
    - NEW input "Split line style"
    버전 5.2 2021.10.22
    - selecting object bug fixed
    버전 5.1 2021.10.07
    - upgrade for link with new BACK button on Dashboard tool
    버전 5.0 2021.10.07
    - NEW "D" button is added that will show chart with "Technical analysis Dashboard" tool

    FREE Dashboard: https://www.mql5.com/en/market/product/72876

    VIDEO: https://www.youtube.com/watch?v=qzC9jpNshw4
    버전 4.8 2021.08.29
    - SYNC button will copy Bands function (if enabled) from Master to Slave rectangle

    - SYNC function in combination with LTF, MTF, HTF buttons will copy timeframe visibility from Master to Slave object when LTF, MTF, HTF button will be assigned to Master object

    - bug fix for SYNC function with combination of input "Visibility for current and lower timeframes"
    버전 4.7 2021.08.22
    - NEW "Bands" button will create top and bottom rectangle lines visible on all TF but filled rectangle will be visible only on current TF. This will help you to see HTF levels on lower timeframes.
    Rectangle top and bottom lines will be dashed for higher timeframes and solid for lower timerames.
    When you disable "Bands" button it will restore rectangle TF visibility.

    - NEW "Scale" button that will switch chart to "Fixed scale mode" that gives you option to move freely around the chart vertical and horizontal. It also gives you opportunity to get feeling for price movements

    VIDEO: https://www.youtube.com/watch?v=OwfjWmBzPG8
    버전 4.6 2021.08.01
    - improved performance between Trading box tools (Order management, Technical analysis, Rectangle extender, Order box Dashboard)
    버전 4.5 2021.08.01
    - bug fix for "X" button display when TBTA is loaded on new chart
    - extended rectangle and trendline buttons display correction for high resolution displays
    버전 4.3 2021.07.31
    - bug fix for chart clean up after indicator is removed
    버전 4.2 2021.07.29
    - removed input variable "Set larger button text"

    - NEW input variable "Button font size"
    - NEW input variable "Button size scale


    - NEW input "TF visibility for newly created rectangle & trendline"
    1. No automatic timeframe visibility
    2. Visibility for current and lower timeframes

    - SYNC button bug solved: Timeframe visibility was not copied from Master to Slave at object creation
    버전 4.1 2021.07.20
    - NEW input variable "Show pip distance in brackets"

    - button click lagging solved
    버전 4.0 2021.07.17
    - bug fix when Trading box Order management and Technical analysis are used on the same chart
    버전 3.9 2021.07.10
    - NEW input variable "Extended trendline width"
    - NEW input variable "Compression line width"
    - NEW input variable "Ray trendline width"
    버전 3.8 2021.07.07
    - larger color and line width buttons when input variable "Set larger button text" is set to TRUE
    버전 3.7 2021.07.06
    - NEW input variable "Set larger button text" that will create a little bigger buttons and font size +2
    - NEW input variable "Flat trendline width"
    - NEW input variable "Line width button 1"
    - NEW input variable "Line width button 2"
    버전 3.5 2021.06.20
    - NEW input variable "Bring Alerted chart to the top"

    - NEW input variable "Extend new created rectangle"
    - NEW input variable "Extend new created trendline"
    버전 3.4 2021.05.25
    - bug fix for button display
    버전 3.3 2021.05.16
    - NEW "Text" button that gives options to display rectangle or trendline text in all possible spots around or inside object. This works for non-extended rectangles and trendlines where we would like to have object name displayed in suitable place around or inside object. This is custom show object name function.

    - NEW "SYNC" button (sync chart object or chart sync object) function for selected rectangle, trendline and horizontal line object chart synchronization on the same symbol (charts synchronizer, object sync)
    The selected master object is copied to other charts of the same symbol.
    Object position location and color style is updated from master to slave object and vice versa.
    When you delete master object then slave objects will be deleted and NOT vice versa.
    If you rename master object then you broke connection with slave objects. If you rename slave object then is no longer synced with master object.
    "SYNC" button can also remove synchronization from selected master or slave object.

    - NEW input "Show extra color buttons" that will display 6 "Filled" color and 6 "Empty" color buttons

    - Bug fix: if you click on tickness buton "1" or "2", it will change object from filled to unfilled

    - Safety check warning for too many objects on chart (performance issues) + warning for incompatible indicators

    UPGRADE VIDEO: https://www.youtube.com/watch?v=asGmONlI4EY
    버전 3.2 2021.03.27
    - better sync with Trading box Order management v3.0 objects
    버전 3.1 2021.03.01
    New input variables added and used when you extend rectangle or trendline:
    - Alert enabled by default
    - Engulf enabled by default
    - Close enabled by default
    - No text enabled by default
    버전 2.9 2021.02.17
    - bug fix reported by users
    버전 2.8 2021.02.04
    - bug fix for full zoom chart label positions
    버전 2.7 2021.02.01
    - input variables description added

    - new input variables:
    - Selected object buttons position
    - Rectangle pip size position
    버전 2.6 2021.01.16
    - switching between timeframes bug solved
    버전 2.5 2020.12.27
    Important MAJOR performance upgrade and bug fix:
    - CPU load problems solved (better chart and object refresh logic)
    - Ignoring Trading box Order management objects
    - All user bug reports solved
    - Works better with other indicators
    버전 2.4 2020.12.09
    MAJOR UPGRADE:
    - added email alert option
    - added 3 new variables to manage alerts and notifications (send_mobile_push_notification, send_email_alert, show_popup_alert)
    - optimized chart refresh rate that will reduce CPU load from 30% up to 500%
    - minor bugs solved and added some additional safe checkups for drawing rectangles and trendlines
    버전 2.3 2020.11.06
    - minor bug fix for >> button when used on rectangle
    버전 2.2 2020.11.02
    - another bug solved when clicking << button
    버전 2.1 2020.11.02
    - bug fix for << button and when rename trendline
    버전 2.0 2020.10.30
    - added new input variable extend_if_auto_scroll_off that will give you option to have fixed extended object size if you have auto scroll option diabled
    버전 1.9 2020.10.29
    - minor bug fixed when Auto scroll is OFF. Objects are extended to the right side of the chart
    버전 1.8 2020.10.14
    - bug fix for Close button, when used on chart with no previusly loaded data on new switched timeframe
    버전 1.7 2020.10.04
    - minor bug fix for alert arrows timeframe visibility
    버전 1.6 2020.10.03
    - minor bug fix for @ button when search for trendline origin history
    버전 1.5 2020.09.27
    MAJOR upgrade
    - new Flat button for trendline (creates horizontal flat trendline)
    - new Close button for rectangle, trendline and ray (alert when current candle closes beyond object price)
    - new R button to enable you repeat alert sound every few seconds (you can set repeat interval in seconds with sound_repeat_seconds_interval)
    - new input parameters for sound repeat alerts for supply, demand, resistance and support (The file must be located in terminal_directory\Sounds. Only WAV files are played)
    - when you click on extended rectangle it shows you Demand or Supply type of rectangle
    - if you extend rectangle around price then you have option to decide if this rectangle is supply or demand
    버전 1.4 2020.09.07
    - minor preformance upgrades
    버전 1.3 2020.08.12
    - new input parameter button_position is added for placing buttons in different corner positions
    버전 1.2 2020.08.08
    - button fix for Demand extended rectangle
    버전 1.1 2020.08.04
    - Rectangle and trendline function buttons are now aligned on right side of charts, so they not overlay with other trendlines and rectangles
    - Button positions corrections