Seconds timeframe chart
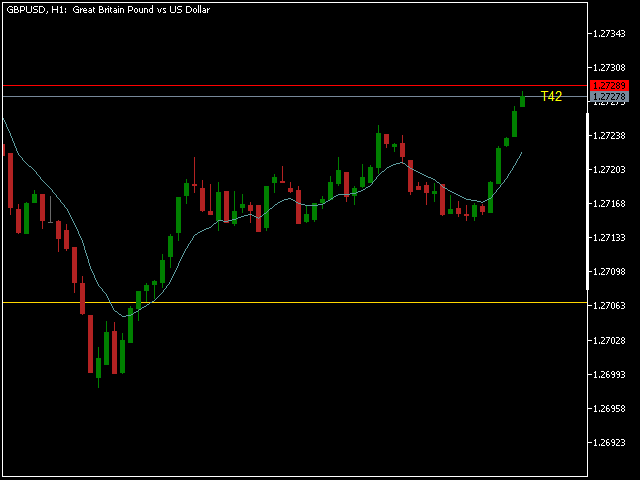
Create and trade timeframes in seconds. The bar time duration is freely adjustable from 1 second and up. The chart is accurately constructed using real ticks from the broker's server.
Main characteristics
- The indicator is an overlay on the main chart, making it possible to utilize one-click trading and on-chart order manipulation.
- History calculated using real tick data.
- Built-in technical studies: 4 moving averages (Simple, Exponential, Smooth, Linear-weighted, Volume-weighted using tick or real volume, plus Linear Regression), Bollinger Bands, Donchian channel, Super Trend and Keltner channel.
- Seconds countdown indication showing the number of seconds left before the current candle is closed.
- Optional display of monthly, weekly, and daily pivot levels.
- Optional display of daily R1, R2, R3 & S1, S2, S3 resistance & support levels for the current trading day.
- Optional display of previous day's high, low, and close levels.
- Audio, Push notifications and text alerts for new bar open events and/or reversals (different audio files can be assigned for bearish and bullish reversals).
- Optional alerts for MA 1 & 2 crossovers.
- Color indication of last day's bar for easy history assessment.
- Each bar has its own info regarding the bar's Open, Low, High, Close values, as well as the Tick Volume, Real Volume (with a breakdown of buy/sell volume) and Bar open time for use by EAs (saved as "double" in indicator's buffer and available via dedicated Data Window).
- A dedicated data window is displayed when left-clicking a Renko bar while holding down the CTRL-key.
Indicator Settings
- Bars duration in seconds.
- Show history for a defined number of days (plus the current day).
- Synchronize the first bar's open on a new day (true/false).
- Trading session time (conveniently gray out all aftermarket or off session candles)
- Show pivot levels:
- None,
- Previous day HLC
- Classic
- Classic + prev HLC
- Fibonacci
- Fibonacci + prev HLC
- Pivot point calculation method (H+L+C)/3 or (O_H+L+C)/4
- Resistance line color
- Pivot line color
- Support line color
- Previous day's high (color)
- Previous day's low (color)
- Previous day's close (color)
- Alert condition:
- None
- New bar
- Reversal bar
- MA1 & MA2 crossover
- New bar & Reversal bar
- New bar & MA cross
- Reversal bar & MA cross
- New bar & reversal bar & MA cross
- Alert notification type:
- None
- Show in the alert box
- Play sound
- Send push notification
- Show alert & Sound
- Play sound & push notify
- Show alert & push notify
- Alert & Sound & Push notify
- Settings for the MAs 1-4.
- Show Channel:
- None
- Donchian Channel
- Bollinger Bands
- Super Trend
- Keltner Channel
- Channel settings
- Indicator used in EA via iCustom() (true/false) - Set this to true only when calling the indicator from an EA, another indicator, or Script.
- Top/Bottom padding (0.0 - 1.0) - used to set the margins above and below the visible high & low of the visible Renko chart.
- Use sound file for bullish alerts (.wav sound file located in MetaTrader 5 \Sounds folder).
- Use sound file for bearish alerts (.wav sound file located in MetaTrader 5 \Sounds folder).
- Display as a bar chart (true/false).
- Shift objects with the chart (true/false)









I am using this product via Exness MQ5. Works very well. I have compared with seconds charts of Tradingview (Oanda feed). Besides the differences in quotation between the brokers, both Tradingview and this product by Artur work very smoothly and reliably. It is user-friendly, has a time counter, and it is possible to execute one-click trades directly from this seconds chart. The seller is very responsive and helpful. Thank you, Artur.