Zigzag x22
- 지표
- Abdelkader Moulay Meliani
- 버전: 1.0
- 활성화: 5
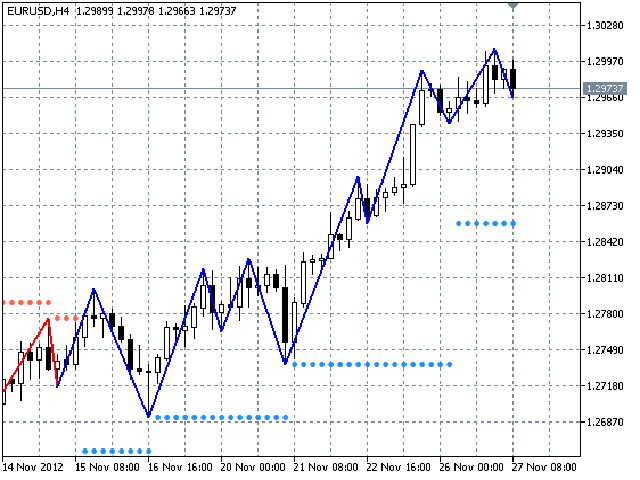
The Zig
Zag indicator plots points on the
chart whenever prices reverse by a percentage greater than a pre-chosen variable. Straight lines are then drawn, connecting these points.
The indicator is
used to help identify price trends. It eliminates random price fluctuations and attempts to show trend changes. L'indicateur Zig
Zag peut être utilisé pour filtrer les mouvements de
prix ... 1 Minute Indicators Used:
RSI (30 / 70) Fibonacci (1 - 0.784)