MTF Chandelier Channel FREE
- 지표
- Dario Pedruzzi
- 버전: 1.0
---> Check all the other products <---
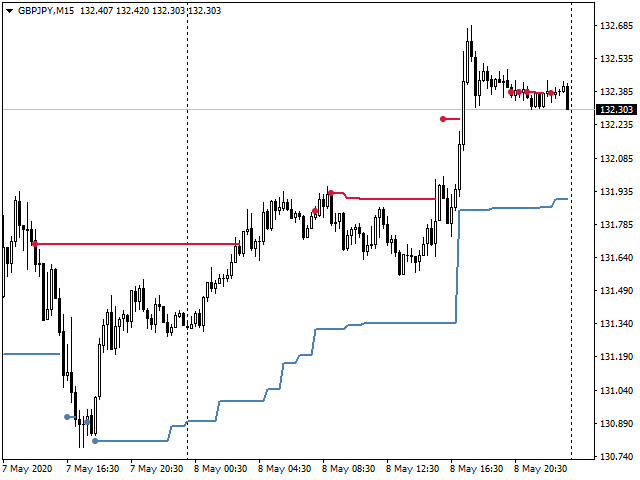
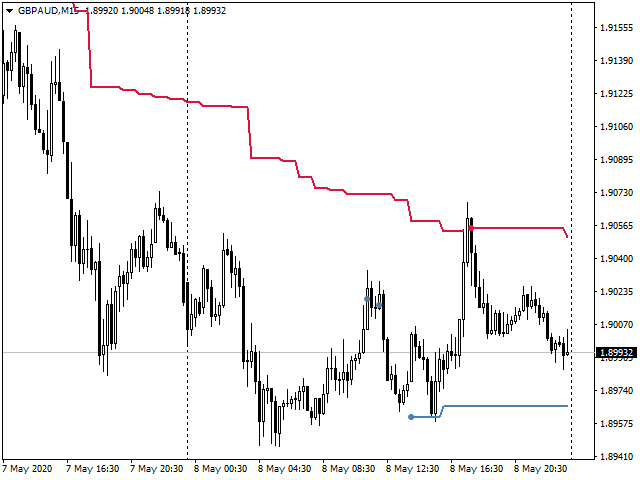
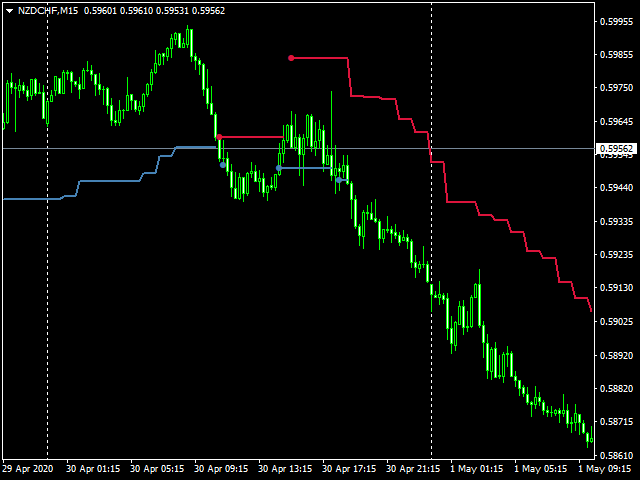
The Multi Time Frame Chandelier Channel is a good synthesis of the chandelier trailing stop and let you analyze the trend.
Enter when the price breaks one of the two lines, then trail using the opposite line.
Ideal for scalping, entering after the dot appears.
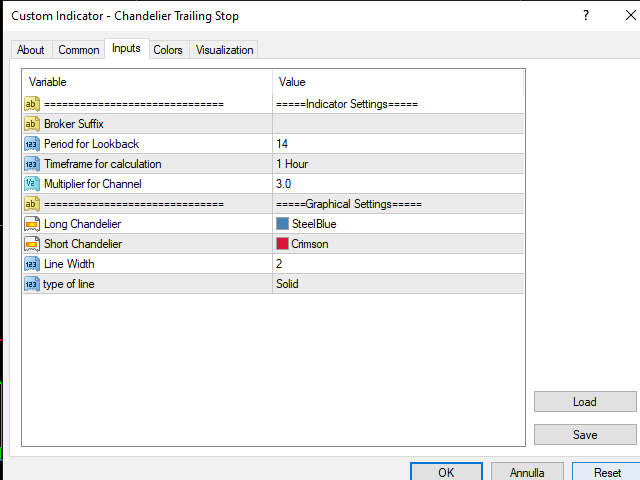
Plenty of customization:
- Choose the lookback period, the longer, the slower
- Choose the Time Frame to use (must be greater or equal your chart TF
- Play around with the options to get the optimal setup
- suggested setup: 14 periods and H1 TimeFrame
FULL version available here --> https://www.mql5.com/en/market/product/49539/
---> Check all the other products <---
Produly developed by www.automazionetrading.com