Trend Transition
- 지표
- Ivan Simonika
- 버전: 2.4
- 활성화: 5
Trend Transition is a hybrid indicator, as it is based on signals from several well-known products: RSI and MA. MA is a trend indicator of the
average true range, which determines the range of minimum and maximum price fluctuations, as well as closing prices. RSI is an
indicator of the family of oscillators. The indicator helps to calculate the oversold and overbought levels of a trading instrument.
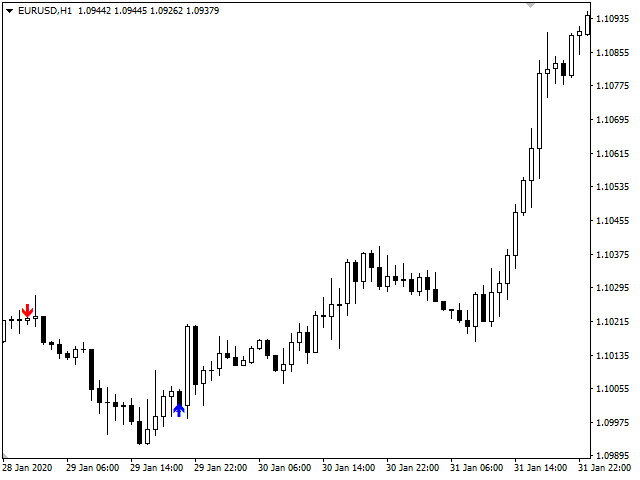
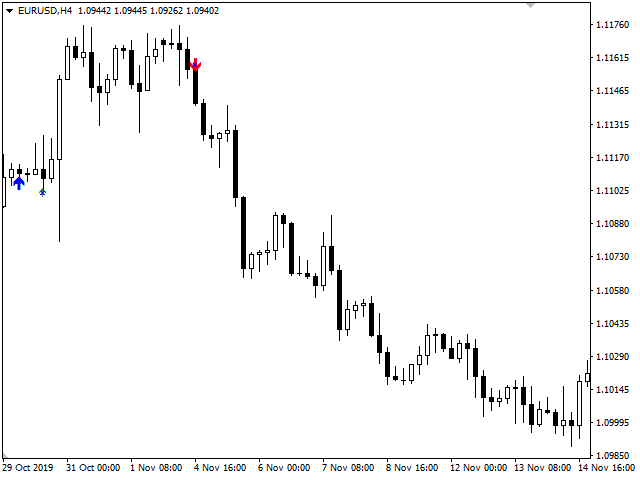
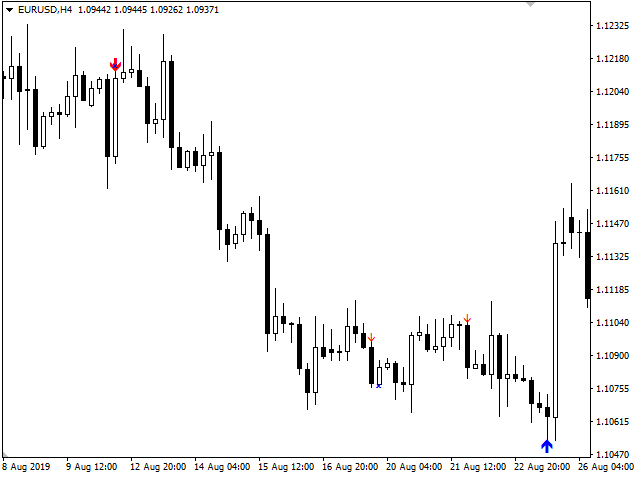
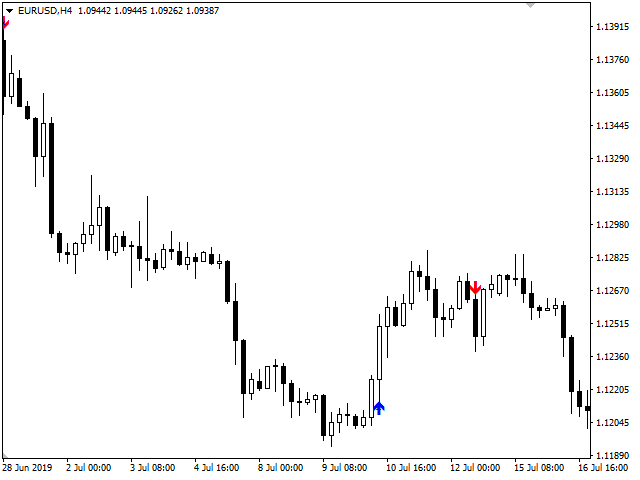
When a trend changes, the Trend Transition indicator uses a color alarm: blue - when changing from downward to upward, and red - on the
contrary, to downward. You can use the indicator when entering the market, after its correction. If the indicator changes color to
blue, you need to wait for the first downward correction and then open transactions for the purchase of an asset. And for sale (color
change to red), wait for the first upward correction and sell the asset on it.
It should be remembered that there are no indicators that are not mistaken. Any strategy requires confirmation of its signals. When
building your own system, it is recommended to use several indicators. Also, you never need to risk more than 2% of your capital in one
transaction. Such an approach will protect the trader from ruin and allow him to earn stable income.

