Pull It Back MT5
- 지표
- Salvatore Caligiuri
- 버전: 1.10
- 업데이트됨: 16 7월 2022
- 활성화: 5
| PROMOTIONAL PERIOD - ONLY 2 COPIES LEFT OF FIRST 10 BUYERS AT PRICE 300,00$!!! |
|---|
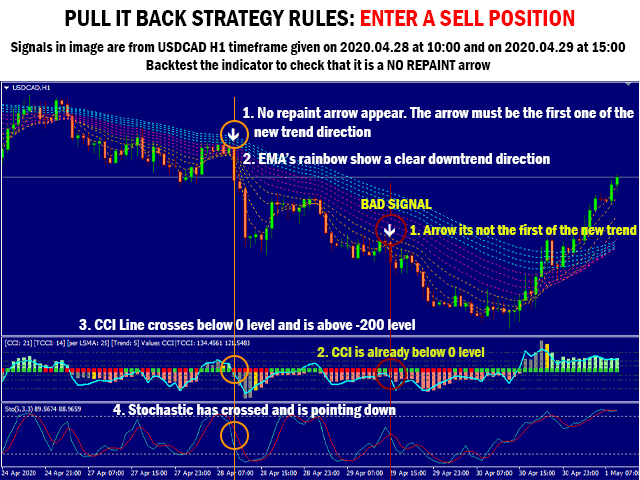
CHECK SCREENSHOTS AND COMMENTS FOR OUR STRATEGY RULES AND LIVE TRADES SIGNALS
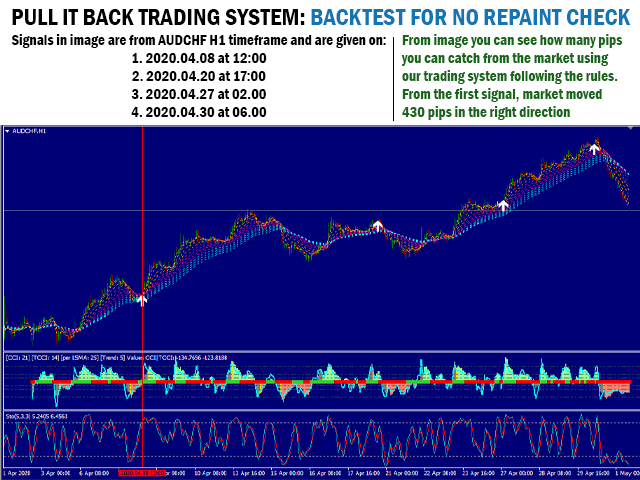
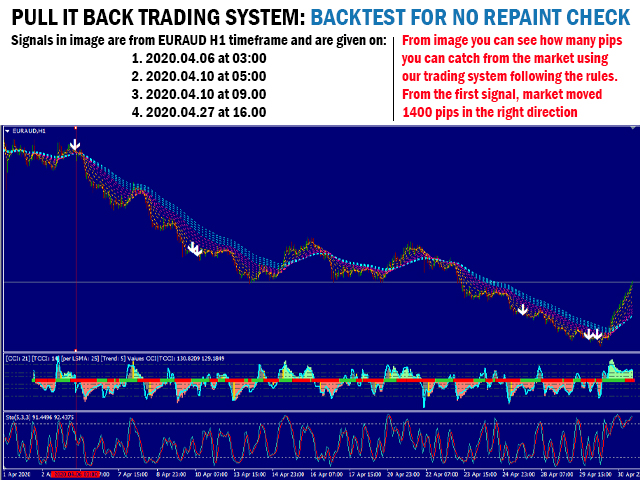
PULL IT BACK is a revolutionary trading system and a complete strategy with advanced algorithm developed to detect the trend direction after a PULLBACK, a RETREACEMENT or a KEY LEVEL BOUNCE. The goal of this indicator is to get as many pips as possible from market trend. Following strictly the rules of the strategy, you can become a better trader and have more safety entries in the market.
Best features of our trading system are:
- Arrow Never repaint
- Arrow Never lagging
- Alert appears only if conditions confirmed at the end of the candle
- You can use as signal on your email and on mobile push notification
Here you can download the complete template* of PULL IT BACK Trading System. You have to copy the template in your MT5 template folder and the indicators in your MT5 indicators folder. IMPORTANT: the main indicator downloaded from the market must remain in MQL5/Indicators/Market folder.
CHECK SCREENSHOTS AND COMMENTS FOR OUR STRATEGY RULES AND LIVE TRADES SIGNALS
PULL IT BACK Indicator is based on our pullback algorithm that give an HIGH PROBABILITY trend continuation after a pullback, retracement or level bounce. Our algorithm has been developed in several months of studies giving back an HIGH PROFESSIONAL INDICATOR.
* Some indicators used in the template are property of their author and can be find free on internet