Trend RB
- 지표
- Ivan Simonika
- 버전: 1.0
- 활성화: 5
One of the most beloved areas in price chart analysis is the use of graphical analysis.
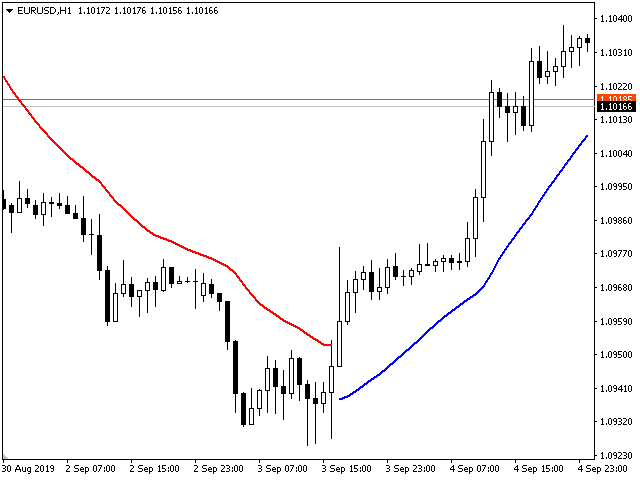
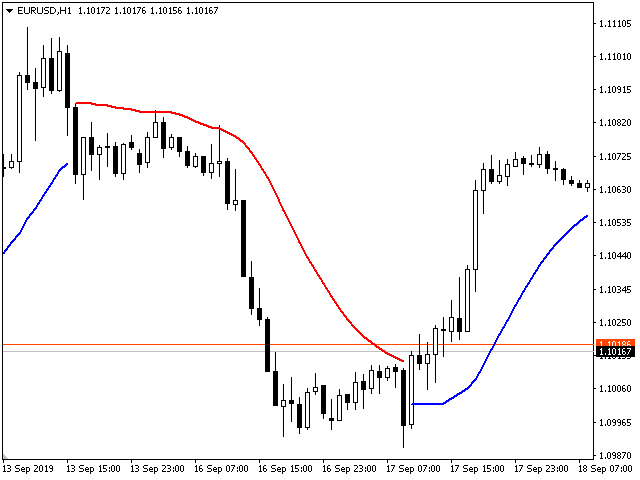
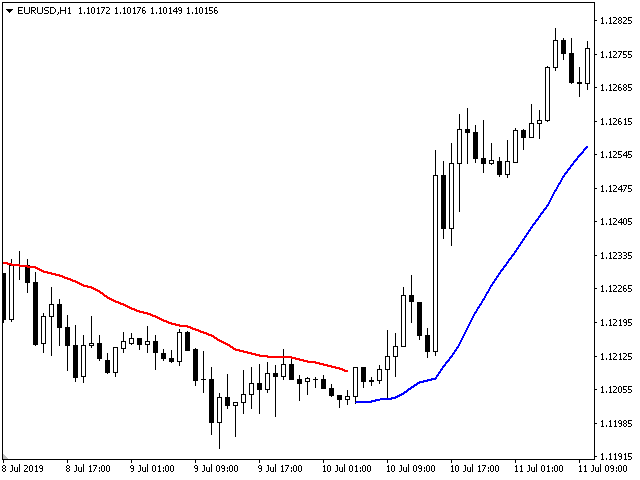
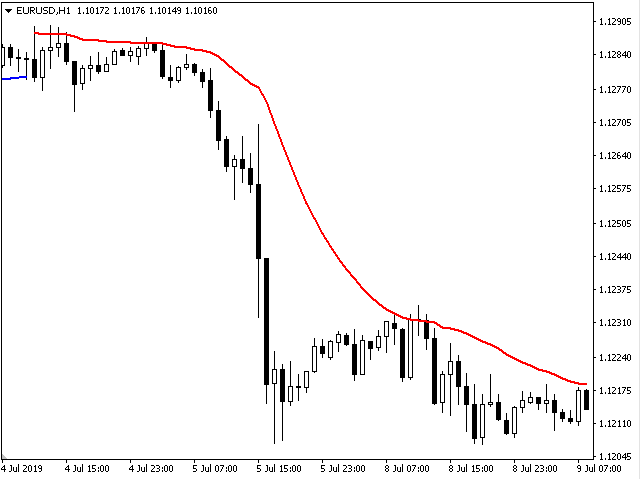
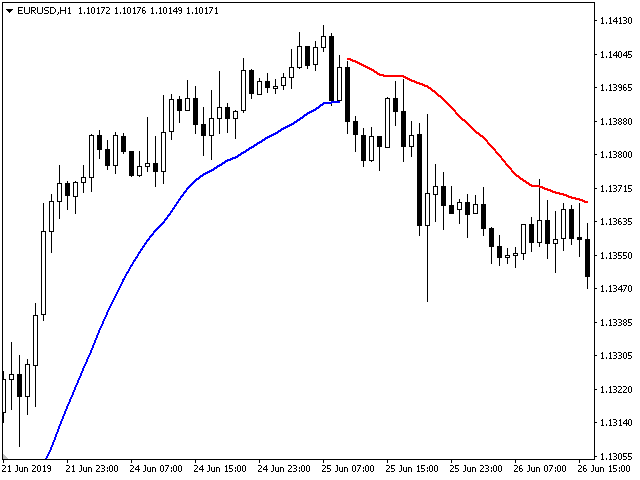
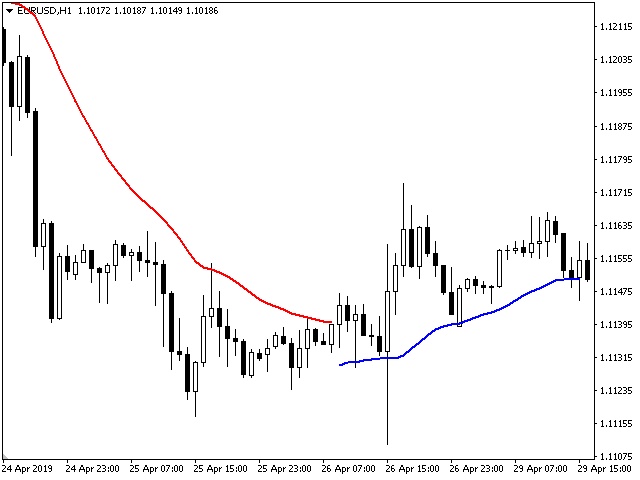
The state of the market, the phase of its movement, largely determines the success of the trader and his chosen strategy. The intelligent algorithm of the Trend RB indicator accurately determines the trend, filters out market noise and generates input signals.
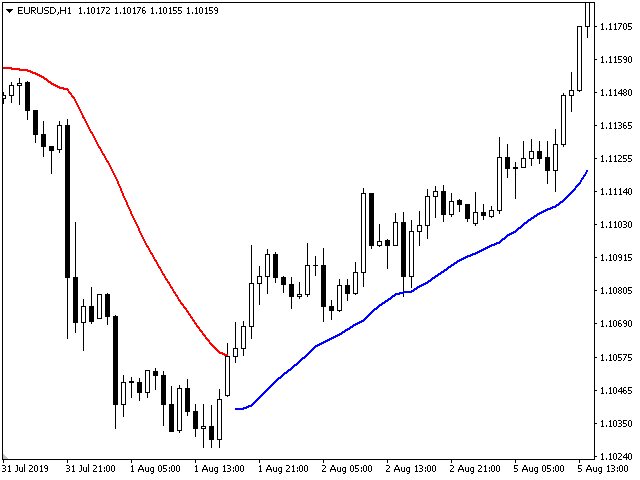
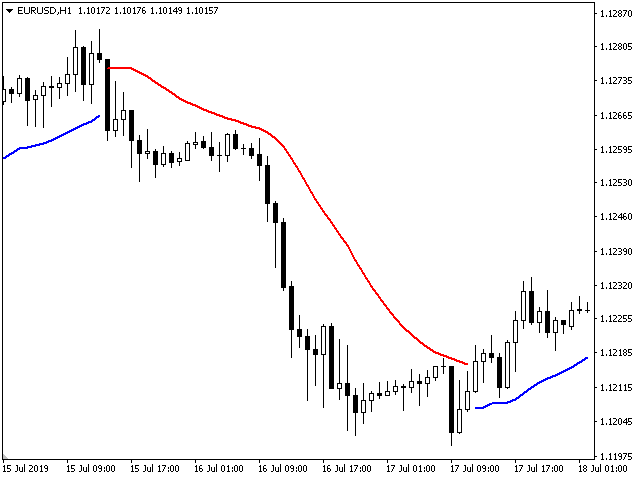
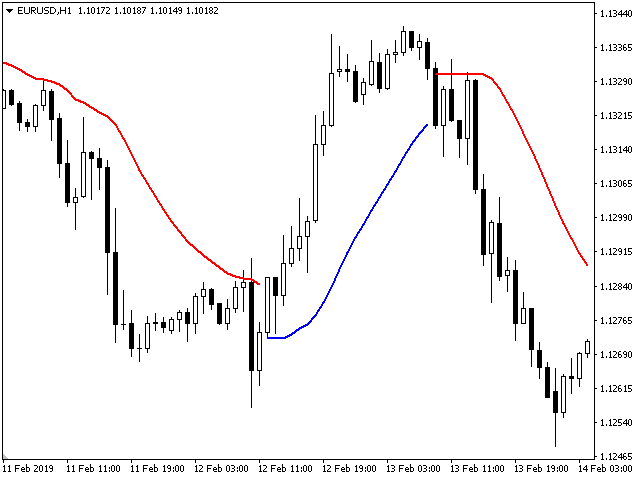
The indicator uses a color alarm: blue - when changing from descending to ascending, and red - on the contrary, to descending. You can use the indicator as the main indicator for determining the trend.
The indicator reflects information in a visual form. It can be used for pipsing on small periods, as well as for long-term trading. It works on all currency pairs and on all timeframes.