ForexTools
- 지표
- Kourosh Hossein Davallou
- 버전: 1.2
- 업데이트됨: 25 3월 2020
- 활성화: 5
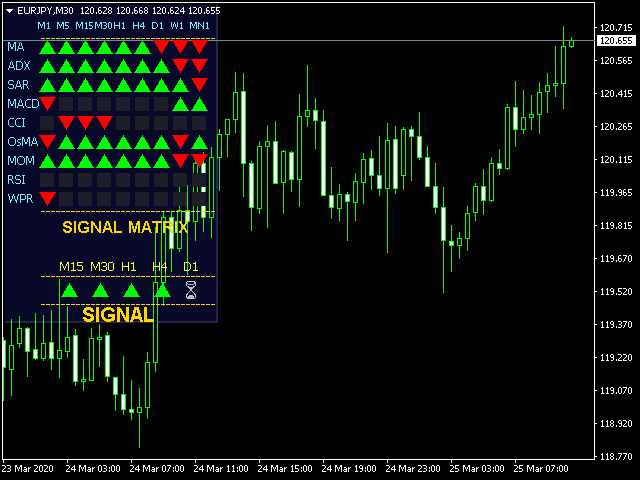
This Indicator works based on several well-known Technical Indicators in different time frame Works.
These Technical Indicators include:
- Moving Averages(MA)
- Average Directional Index (ADX)
- Parabolic Stop and Reverse (SAR)
- Moving Average Convergence Divergence (MACD)
- Commodity Channel Index (CCI)
- Oscillator of a Moving Average (OsMA)
- Momentum(MOM)
- Relative Strength Index (RSI)
- Williams' Percent Range (WPR)