IVolX 2 DPOC
- 지표
- Denis Chebatarev
- 버전: 2.0
- 활성화: 5
Vol 2 DPOC volume
vol 2 DOC-dynamic horizontal volume indicator for any time periods
Main settings of the indicator:
- Volume Source-selecting data for volumes (tick or real)
- DPOCOn-enabling / disabling the indicator
- DPOCFrom-calculation start date
- DPOCTo-settlement end date
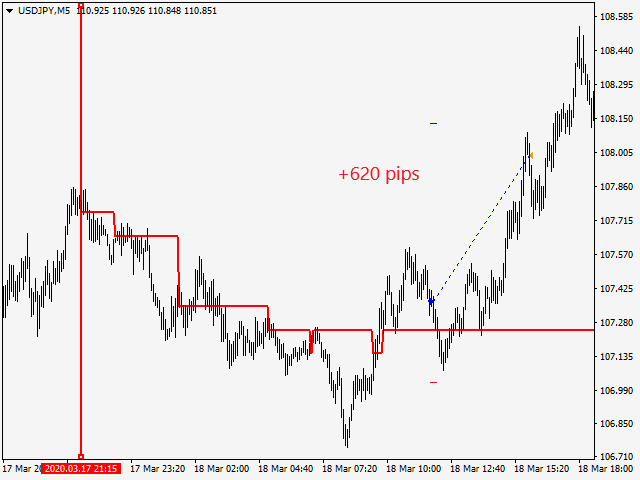
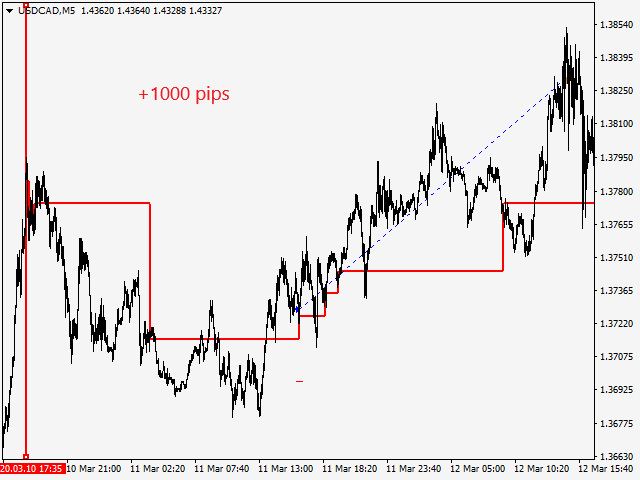
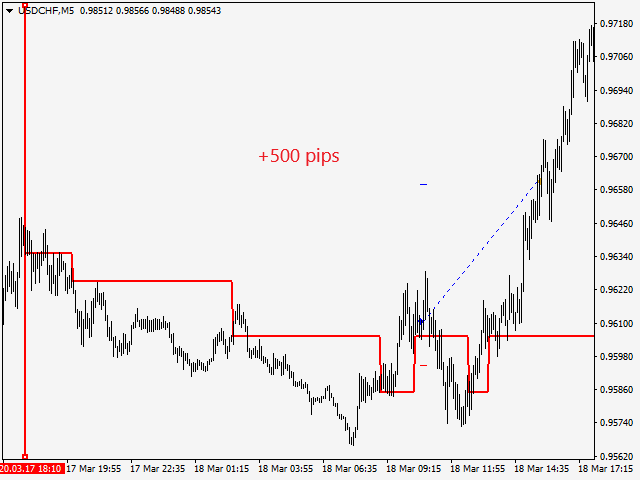
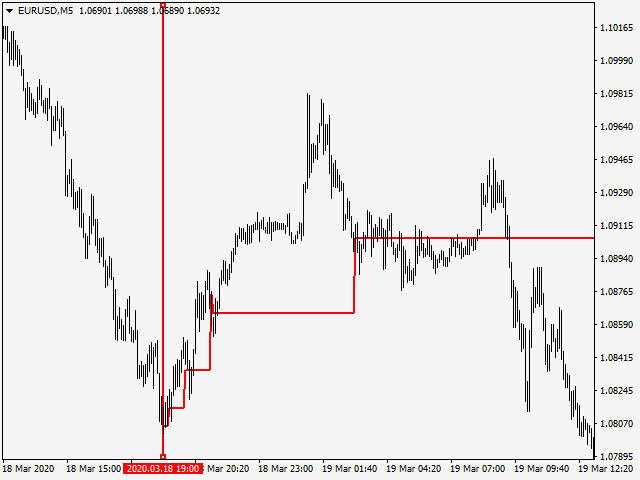
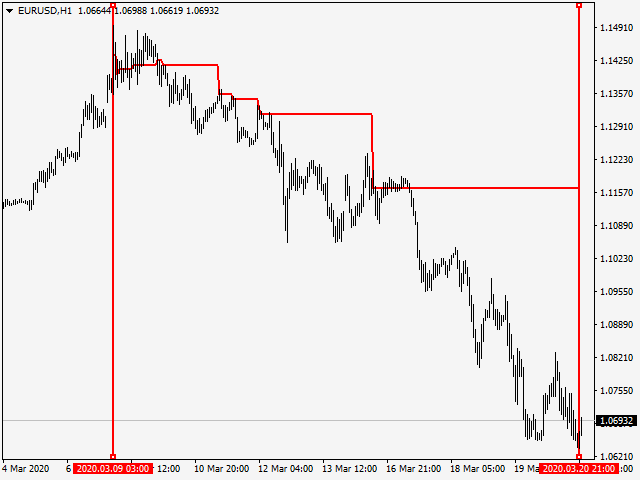
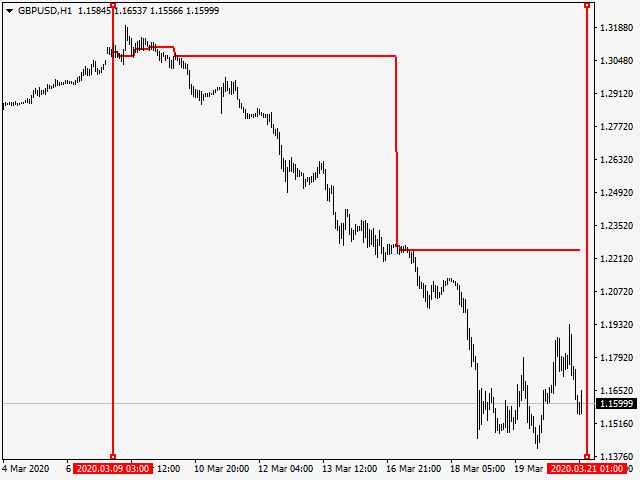
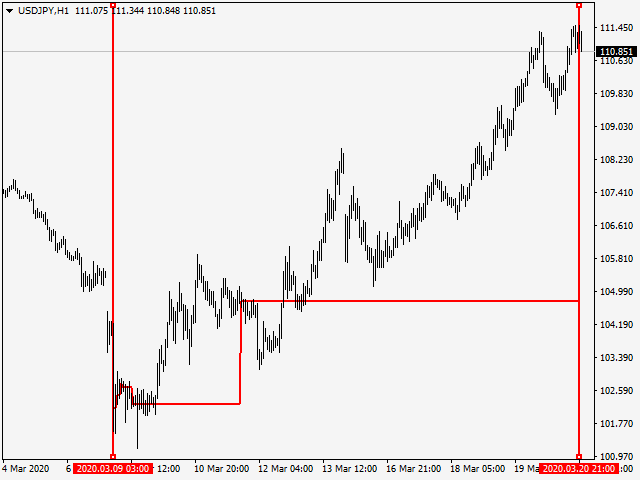
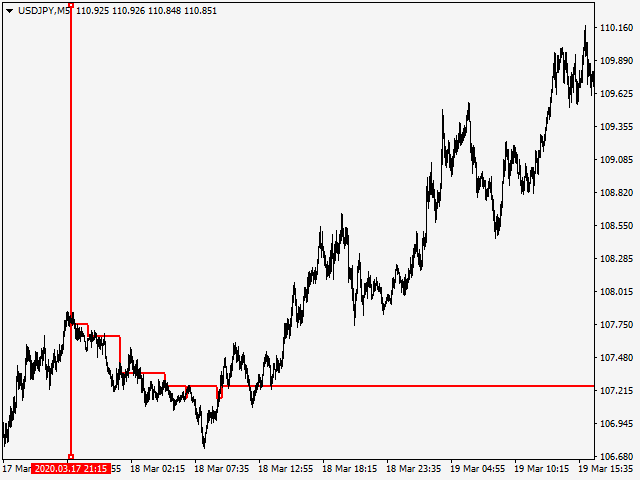
The indicator allows you to manually select areas on the chart to analyze changes in the maximum volume over time.
You can do this by using vertical lines and moving them along the chart. Or by setting specific dates in the indicator settings.
It is a very useful indicator to determine more precisely when the price leaves the correction and resumes the trend movement.
The indicator displays 3 buffers so that the indicator can be connected to the expert Advisor.